

The DOI matches its Crossref record; 22 of the 23 references it cites were found in a registry or an index.
Safety, immunogenicity, pharmacokinetics, and efficacy of degradation of anti-HLA antibodies by IdeS (imlifidase) in chronic kidney disease patients
Open accessAbstract
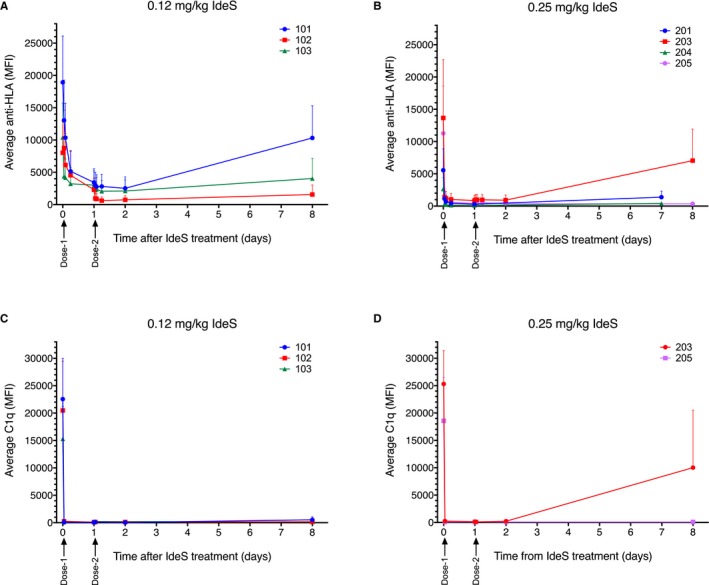
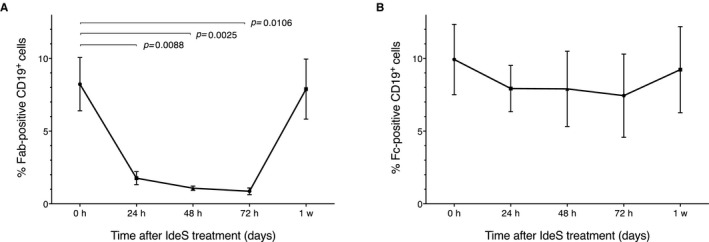
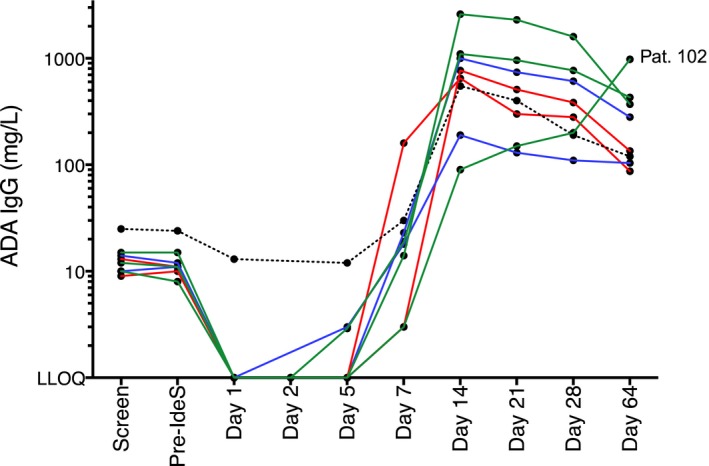
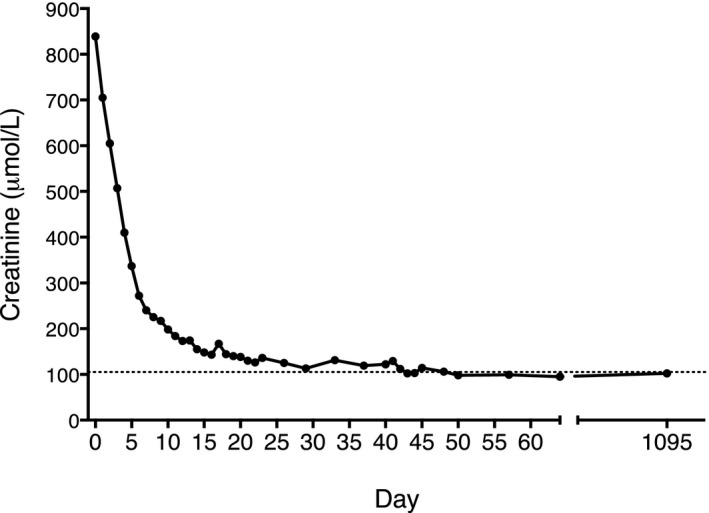
Safety, immunogenicity, pharmacokinetics, and efficacy of the IgG-degrading enzyme of Streptococcus pyogenes (IdeS [imlifidase]) were assessed in a single-center, open-label ascending-dose study in highly sensitized patients with chronic kidney disease. Eight patients with cytotoxic PRAs (median cytotoxic PRAs of 64%) at enrollment received 1 or 2 intravenous infusions of IdeS on consecutive days (0.12 mg/kg body weight ×2 [n = 3]; 0.25 mg/kg ×1 [n = 3], or 0.25 mg/kg ×2 [n = 2]). IgG degradation was observed in all subjects after IdeS treatment, with <1% plasma IgG remaining within 48 hours and remaining low up to 7 days. Mean fluorescence intensity values of HLA class I and II reactivity were substantially reduced in all patients, and C1q binding to anti-HLA was abolished. IdeS also cleaved the IgG-type B cell receptor on CD19 + memory B cells. Anti-IdeS antibodies developed 1 week after treatment, peaking at 2 weeks. A few hours after the second IdeS infusion, 1 patient received a deceased donor kidney offer. At enrollment, the patient had a positive serum crossmatch (HLA-B7), detected by complement-dependent cytotoxicity, flow cytometry, and multiplex bead assays. After IdeS infusion (0.12 mg/kg ×2) and when the HLA-incompatible donor (HLA-B7 + ) kidney was offered, the HLA antibody profile was negative. The kidney was transplanted successfully.
Overview
The claims and statistics of this paper haven’t been checked yet.
Run the check — free, no account needed. It reads the open-access text and checks the sources it cites.
Integrity signals
Registry
Cites
Statistics
Figures
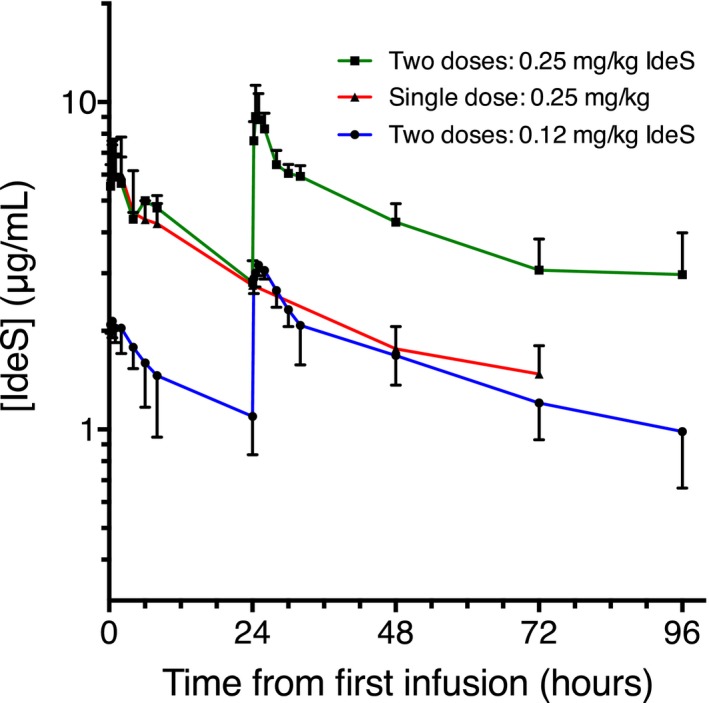
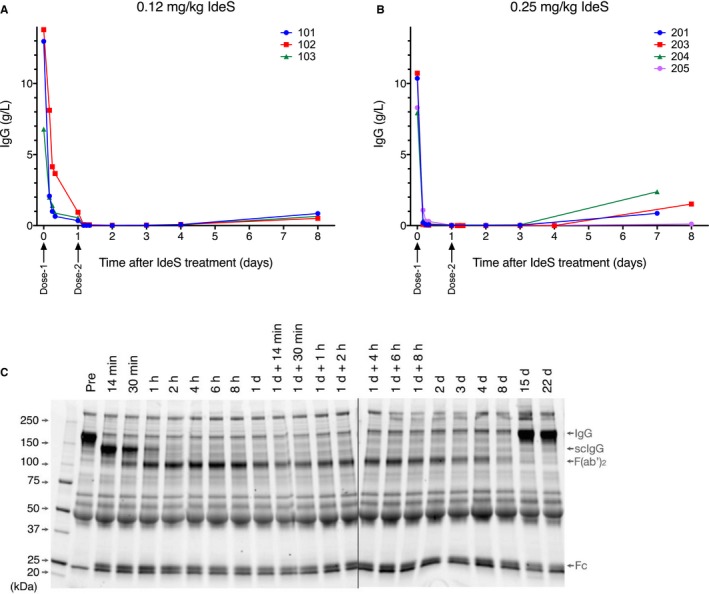
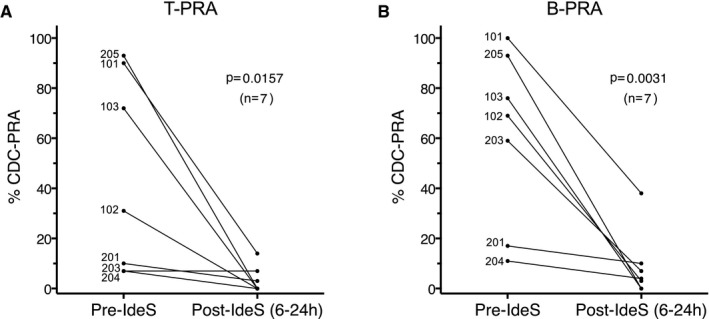
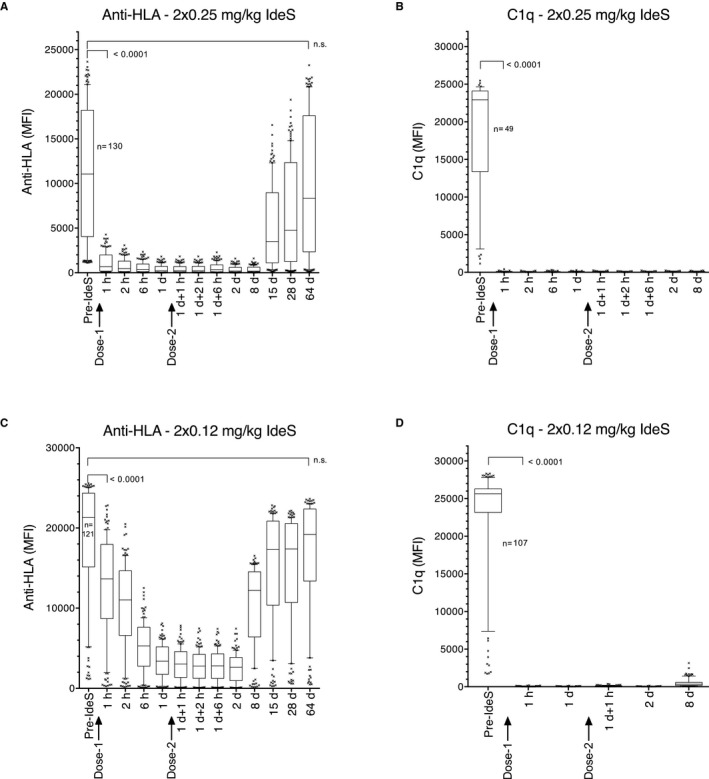
Verification
Claims the paper makes
The claims and statistics of this paper haven’t been checked yet.
Run the check — free, no account needed. It reads the open-access text and checks the sources it cites.
Claims other papers make about this one
Each is checked against this paper’s own text: does it say what the citing paper says it does?
In the citing paper
“Imlifidase (Idefirix, Hansa Biopharma) is a IgG-degrading cysteine protease derived from Streptococcus pyogenes (IdeS), which specifically cleaves opsonizing IgG at the lower hinge region of the heavy chains, resulting in a F(ab’)2 and a non-functioning dimeric Fc fragment (82).”
From Immunomodulation in Administration of RAAV: Preclinical and Clinical Adjuvant Pharmacotherapies (2021) · cites this paper as [82]
Self-check
Percentages, sums and reported differences re-computed from the paper’s own numbers.
The self-check needs the paper’s full text.
Citations
Cites
Significance of the Positive Crossmatch Test in Kidney Transplantation
Patel, R., & Terasaki, P. I. (1969) · New England Journal of Medicine · doi:10.1056/nejm196904032801401 · Cited by 1,515
Rituximab and Intravenous Immune Globulin for Desensitization during Renal Transplantation
Vo, A. A., Lukovsky, M., Toyoda, M., Wang, J. P., Reinsmoen, N. L., Lai, C.-H., Peng, A., Villicana, R., & Jordan, S. C. (2008) · New England Journal of Medicine · doi:10.1056/nejmoa0707894 · Cited by 691
Desensitization in HLA-Incompatible Kidney Recipients and Survival
Montgomery, R. A., Lonze, B. E., King, K. E., Kraus, E. S., Kucirka, L. M., Locke, J. E., Warren, D. S., Simpkins, C. E., Dagher, N. N., Singer, A. L., et al. (2011) · New England Journal of Medicine · doi:10.1056/nejmoa1012376 · Cited by 687
IdeS, a novel streptococcal cysteine proteinase with unique specificity for immunoglobulin G
von Pawel‐Rammingen, U., Johansson, B. P., & Björck, L. (2002) · The EMBO Journal · doi:10.1093/emboj/21.7.1607 · Cited by 475
Self-citationStegall, M. D., Gloor, J. M., Winters, J. L., Moore, S. B., & DeGoey, S. R. (2006) · American Journal of Transplantation · doi:10.1111/j.1600-6143.2005.01178.x · Cited by 426
IgG endopeptidase in highly sensitized patients undergoing transplantation
Jordan, S. C., Lorant, T., Choi, J., Kjellman, C., Winstedt, L., Bengtsson, M., Zhang, X., Eich, T., Toyoda, M., Eriksson, B.-M., et al. (2017) · New England Journal of Medicine · doi:10.1056/nejmoa1612567 · Cited by 377
Self-citationSurvival Benefit with Kidney Transplants from HLA-Incompatible Live Donors
Orandi, B. J., Luo, X., Massie, A. B., Garonzik‐Wang, J., Lonze, B. E., Ahmed, R., Arendonk, K. J. V., Stegall, M. D., Jordan, S. C., Oberholzer, J., et al. (2016) · New England Journal of Medicine · doi:10.1056/nejmoa1508380 · Cited by 368
Glotz, D., Antoine, C., Julia, P. L., Suberbielle, C., Boudjeltia, S., Fraoui, R., Hacen, C., DUBOUST, A., & Bariety, J. (2002) · American Journal of Transplantation · doi:10.1034/j.1600-6143.2002.20809.x · Cited by 267
Marzano, A. V., Fanoni, D., Antiga, E., Quaglino, P., Caproni, M., CROSTI, C., Meroni, P. L., & Cugno, M. (2014) · Clinical & Experimental Immunology · doi:10.1111/cei.12394 · Cited by 241
Wenig, K., Chatwell, L., von Pawel‐Rammingen, U., Björck, L., Huber, R., & Sondermann, P. (2004) · Proceedings of the National Academy of Sciences · doi:10.1073/pnas.0407965101 · Cited by 170
Self-citation
Cited by
Sorted by citations
Adeno-associated virus as a delivery vector for gene therapy of human diseases
Wang, J.-H., Gessler, D. J., Zhan, W., Gallagher, T. L., & Gao, G. (2024) · Signal Transduction and Targeted Therapy · doi:10.1038/s41392-024-01780-w · Cited by 904
Leborgne, C., Barbon, E., Alexander, J. M., Hanby, H., Delignat, S., Cohen, D. M., Collaud, F., Muraleetharan, S., Lupo, D., Silverberg, J., et al. (2020) · Nature Medicine · doi:10.1038/s41591-020-0911-7 · Cited by 336
Rescuing AAV gene transfer from neutralizing antibodies with an IgG-degrading enzyme
Elmore, Z. C., Oh, D. K., Simon, K. E., Fanous, M. M., & Asokan, A. (2020) · JCI Insight · doi:10.1172/jci.insight.139881 · Cited by 137
Jordan, S. C., Legendre, C. M., Desai, N. M., Lorant, T., Bengtsson, M., Lonze, B. E., Vo, A. A., Runström, A., Laxmyr, L., Sjöholm, K., et al. (2020) · Transplantation · doi:10.1097/tp.0000000000003496 · Cited by 123
Self-citationOutcomes at 3 years posttransplant in imlifidase-desensitized kidney transplant patients
Kjellman, C., Maldonado, A. Q., Sjöholm, K., Lonze, B. E., Montgomery, R. A., Runström, A., Lorant, T., Desai, N. M., Legendre, C. M., Lundgren, T., et al. (2021) · American Journal of Transplantation · doi:10.1111/ajt.16754 · Cited by 95
Self-citationRecent Advances and Clinical Outcomes of Kidney Transplantation
Thongprayoon, C., Hansrivijit, P., Leeaphorn, N., Acharya, P. C., Torres‐Ortiz, A., Kaewput, W., Kovvuru, K. R., Kanduri, S. R., Bathini, T. J., & Cheungpasitporn, W. (2020) · Journal of Clinical Medicine · doi:10.3390/jcm9041193 · Cited by 94
Sensitization in transplantation: Assessment of Risk 2022 Working Group Meeting Report
Tambur, A. R., Bestard, O., Campbell, P. M., Chong, A. S., Crespo, M., Ford, M. L., Gebel, H. M., Heidt, S., Hickey, M. J., Jackson, A., et al. (2023) · American Journal of Transplantation · doi:10.1016/j.ajt.2022.11.009 · Cited by 80
Imlifidase for the treatment of anti-HLA antibody-mediated processes in kidney transplantation
Huang, E., Maldonado, A. Q., Kjellman, C., & Jordan, S. C. (2021) · American Journal of Transplantation · doi:10.1111/ajt.16828 · Cited by 70
Self-citationUhlin, F., Szpirt, W. M., Kronbichler, A., Bruchfeld, A. N., Soveri, I., Rostaing, L. P. E., Daugas, É., Lionet, A., Kamar, N., Rafat, C., et al. (2022) · Journal of the American Society of Nephrology · doi:10.1681/asn.2021111460 · Cited by 69
Self-citationGross, D., Tedesco, N., Leborgne, C., & Ronzitti, G. (2022) · Frontiers in Immunology · doi:10.3389/fimmu.2022.857276 · Cited by 64
Immunomodulation in Administration of RAAV: Preclinical and Clinical Adjuvant Pharmacotherapies
Chu, W. S., & Ng, J. (2021) · Frontiers in Immunology · doi:10.3389/fimmu.2021.658038 · Cited by 59
Translating B cell immunology to the treatment of antibody-mediated allograft rejection
Heeger, P. S., Carrera-Haro, M. A., & Jordan, S. C. (2024) · Nature Reviews Nephrology · doi:10.1038/s41581-023-00791-0 · Cited by 56
Kizlik‐Masson, C., Deveuve, Q., Zhou, Y., Vayne, C., Thibault, G., McKenzie, S. E., Pouplard, C., Loyau, S., Gruel, Y., & Rollin, J. (2019) · Blood · doi:10.1182/blood.2019000437 · Cited by 44
Antibody‐mediated rejection in xenotransplantation: Can it be prevented or reversed?
Habibabady, Z. A., McGrath, G., Kinoshita, K., Maenaka, A., Ileka, I., Elias, G. F., Zaletel, T., Rosales, I. A., Hara, H., Pierson, R. N., et al. (2023) · Xenotransplantation · doi:10.1111/xen.12816 · Cited by 42
Emerging therapies for autoimmune myasthenia gravis: Towards treatment without corticosteroids
Tannemaat, M. R., & Verschuuren, J. J. G. M. (2019) · Neuromuscular Disorders · doi:10.1016/j.nmd.2019.12.003 · Cited by 45
Ge, S., Chu, M., Choi, J., Louie, S., Vo, A. A., Jordan, S. C., & Toyoda, M. (2019) · Transplantation · doi:10.1097/tp.0000000000003023 · Cited by 40
Ros‐Gañán, I., Hommel, M., Trigueros‐Motos, L., Tamarit, B., Rodríguez‐García, E., Salas, D., Pérez, G., Douar, A. M., Combal, J. P., Bénichou, B., et al. (2022) · Clinical & Translational Immunology · doi:10.1002/cti2.1375 · Cited by 37
Al-Salama, Z. T. (2020) · Drugs · doi:10.1007/s40265-020-01418-5 · Cited by 37
Extensive substrate recognition by the streptococcal antibody-degrading enzymes IdeS and EndoS
Sudol, A. S. L., Butler, J., Ivory, D. P., Tews, I., & Crispin, M. (2022) · Nature Communications · doi:10.1038/s41467-022-35340-z · Cited by 32
Update on ANCA-associated vasculitis: from biomarkers to therapy
Tedesco, M., Gallieni, M. A., Pellegata, F., Cozzolino, M. G., & Alberici, F. (2019) · Journal of Nephrology · doi:10.1007/s40620-019-00628-9 · Cited by 31
Desensitization in Crossmatch-positive Kidney Transplant Candidates
Noble, J., Jouvé, T., Malvezzi, P., & Rostaing, L. P. E. (2022) · Transplantation · doi:10.1097/tp.0000000000004279 · Cited by 32
Structural insights into the mechanisms and specificities of IgG-active endoglycosidases
Du, J. J., Klontz, E. H., Guerin, M. E., Trastoy, B., & Sundberg, E. J. (2019) · Glycobiology · doi:10.1093/glycob/cwz042 · Cited by 26
Innovations in Heart Transplantation: A Review
Coniglio, A. C., Patel, C. B., Kittleson, M. M., Schlendorf, K. H., Schroder, J. N., & DeVore, A. D. (2021) · Journal of Cardiac Failure · doi:10.1016/j.cardfail.2021.10.011 · Cited by 28
Future developments in kidney transplantation
Viklický, O., Novotny, M., & Hrubá, P. (2019) · Current Opinion in Organ Transplantation · doi:10.1097/mot.0000000000000722 · Cited by 28
On the road to eliminating long‐lived plasma cells—“are we there yet?”
Markmann, C., & Bhoj, V. G. (2021) · Immunological Reviews · doi:10.1111/imr.13015 · Cited by 27
Recent Advancements in Poor Graft Function Following Hematopoietic Stem Cell Transplantation
Man, Y., Lu, Z., Yao, X., Gong, Y., Yang, T., & Wang, Y. (2022) · Frontiers in Immunology · doi:10.3389/fimmu.2022.911174 · Cited by 27
Current Progress in the Development of Zika Virus Vaccines
Zhou, K., Li, C., Shi, W., Hu, X., Nandakumar, K. S., Jiang, S., & Zhang, N. (2021) · Vaccines · doi:10.3390/vaccines9091004 · Cited by 26
Imlifidase-generated Single-cleaved IgG: Implications for Transplantation
Bockermann, R., Järnum, S., Runström, A., Lorant, T., Winstedt, L., Palmqvist, N., & Kjellman, C. (2021) · Transplantation · doi:10.1097/tp.0000000000004031 · Cited by 22
Self-citationHalleck, F., Böhmig, G. A., Couzi, L., Rostaing, L. P. E., Einecke, G., Lefaucheur, C., Legendre, C. M., Montgomery, R. A., Hughes, P., Chandraker, A. K., et al. (2024) · Clinical Transplantation · doi:10.1111/ctr.15383 · Cited by 23
Horiuchi, M., Hinderer, C. J., Shankle, H. N., Hayashi, P. M., Chichester, J. A., Kissel, C. L., Bell, P. L., Dyer, C., & Wilson, J. M. (2023) · Human Gene Therapy · doi:10.1089/hum.2022.216 · Cited by 20
Targeting the Neonatal Fc Receptor in Autoimmune Diseases: Pipeline and Progress
Gjølberg, T. T., Mester, S., Calamera, G., Telstad, J. S., Sandlie, I., & Andersen, J. T. (2025) · BioDrugs · doi:10.1007/s40259-025-00708-2 · Cited by 20
Manook, M., Flores, W. J., Schmitz, R., Fitch, Z. W., Yoon, J., Bae, Y., Shaw, B. I., Kirk, A. D., Harnois, M. J., Permar, S. R., et al. (2021) · Frontiers in Immunology · doi:10.3389/fimmu.2021.660900 · Cited by 18
Investigational drugs for the treatment of kidney transplant rejection
van Vugt, L. K., Schagen, M. R., de Weerd, A., Reinders, M. E. J., de Winter, B. C. M., & Hesselink, D. A. (2022) · Expert Opinion on Investigational Drugs · doi:10.1080/13543784.2022.2130751 · Cited by 19
Imlifidase Desensitization in HLA-incompatible Kidney Transplantation: Finding the Sweet Spot
de Weerd, A. E., Roelen, D. L., van de Wetering, J., Betjes, M. G. H., Heidt, S., & Reinders, M. E. J. (2023) · Transplantation · doi:10.1097/tp.0000000000004689 · Cited by 20
Imlifidase in kidney transplantation
Kanbay, M., Çöpür, S., Güldan, M., Topçu, A. U., Özbek, L., Hasbal, N. B., Süsal, C., Koçak, B., Callemeyn, J., & Segelmark, M. (2024) · Clinical Kidney Journal · doi:10.1093/ckj/sfae033 · Cited by 18
Roux, A., Bunel, V., Belousova, N., Messika, J., Tanaka, S., Salpin, M., Roussel, A., Beaumont, L., Picard, C., Brugière, O., et al. (2023) · American Journal of Transplantation · doi:10.1016/j.ajt.2022.11.025 · Cited by 16
A review of imlifidase in solid organ transplantation
Lonze, B. E. (2020) · Expert Opinion on Biological Therapy · doi:10.1080/14712598.2021.1850685 · Cited by 16
Novel strategies to target the humoral alloimmune response
Suchánek, O., & Clatworthy, M. R. (2020) · HLA · doi:10.1111/tan.14092 · Cited by 16
Kamar, N., Bertrand, D., Caillard, S., Pievani, D., Apithy, M.-J., Congy‐Jolivet, N., Chauveau, B., Farce, F., François, A., Delas, A., et al. (2024) · Kidney International Reports · doi:10.1016/j.ekir.2024.07.024 · Cited by 16
DeLaura, I. F., Zikos, J., Anwar, I. J., Yoon, J., Ladowski, J. M., Jackson, A. M., Rompay, K. K. A. V., Magnani, D. M., Knechtle, S. J., & Kwun, J. (2023) · Xenotransplantation · doi:10.1111/xen.12833 · Cited by 13
Chidambaram, P., Sakeeba, S. S., Eswaramoorthy, N., Bagherjeri, F. A., Monhemi, H., Bhaskaran, M. C., Perera, G. S., & Sriram, S. (2024) · Biosensors and Bioelectronics · doi:10.1016/j.bios.2024.116516 · Cited by 14
New Therapies for Highly Sensitized Patients on the Waiting List
Vo, A. A., Ammerman, N., & Jordan, S. C. (2024) · Kidney360 · doi:10.34067/kid.0000000000000509 · Cited by 18
Furian, L., Heemann, U., Bengtsson, M., Bestard, O., Binet, I., Böhmig, G. A., Boletis, J., Briggs, D., Claas, F. H. J., Couzi, L., et al. (2025) · Transplant International · doi:10.3389/ti.2024.13886 · Cited by 14
Self-citationSegelmark, M., & Björck, L. (2019) · Frontiers in Immunology · doi:10.3389/fimmu.2019.02165 · Cited by 13
Self-citationLin, J., Boon, L., Bockermann, R., Robertson, A.-K., Kjellman, C., & Anderson, C. C. (2020) · American Journal of Transplantation · doi:10.1111/ajt.15851 · Cited by 10
Self-citationImlifidase therapy: exploring its clinical uses
Rostaing, L. P. E., Noble, J., Malvezzi, P., & Jouvé, T. (2022) · Expert Opinion on Pharmacotherapy · doi:10.1080/14656566.2022.2150965 · Cited by 12
Bertacchi, M., Parvex, P., & Villard, J. (2022) · Clinical Transplantation · doi:10.1111/ctr.14608 · Cited by 11
Bayer, A. C., Sanmarco, L. M., Pellerin, A., Masi, G., Plasencia, A., Anderson, J. M., Nowak, R. J., Damato, V., Massacesi, L., Pham, M. C., et al. (2025) · Proceedings of the National Academy of Sciences · doi:10.1073/pnas.2505984122 · Cited by 12
Mancebo, E., Diekmann, F., Palou, E., Vilches, C., Crespo, M., Mazuecos, A., Caro, J. L., Cruzado, J. M., Segundo, D. S., Muro, M., et al. (2025) · Transplantation Reviews · doi:10.1016/j.trre.2025.100919 · Cited by 11
Assessment and management of allosensitization following heart transplant in adults
Jaiswal, A., Bell, J., DeFilippis, E. M., Kransdorf, E. P., Patel, J. K., KOBASHIGAWA, J. A., Kittleson, M. M., & Baran, D. A. (2022) · The Journal of Heart and Lung Transplantation · doi:10.1016/j.healun.2022.12.011 · Cited by 10
Half‐Life Extension of the IgG‐Degrading Enzyme (IdeS) Using Fc‐Fusion Technology
Daventure, V., Bou-Jaoudeh, M., Hannachi, E., Reyes‐Ruiz, A., Trecco, A., Delignat, S., Lacroix‐Desmazes, S., & Deligne, C. (2024) · European Journal of Immunology · doi:10.1002/eji.202451264 · Cited by 9
Romei, M. G., Leonard, B. C., Kim, I., Kim, H. S., & Lazar, G. A. (2023) · Journal of Biological Chemistry · doi:10.1016/j.jbc.2023.104685 · Cited by 10
Effectiveness of different immunoadsorption columns for anti-A/B antibody depletion
Speer, C., Kälble, F., da Silva, L. P., Nußhag, C., Schaier, M., Becker, L. E., Klein, K., Beimler, J., Sommerer, C., Leo, A., et al. (2019) · Atherosclerosis Supplements · doi:10.1016/j.atherosclerosissup.2019.08.030 · Cited by 7
Five Years Follow-up of Imlifidase Desensitized Kidney Transplant Recipients
Lorant, T., Lonze, B. E., Montgomery, R. A., Desai, N. M., Legendre, C. M., Lundgren, T., von Zur‐Mühlen, B., Vo, A. A., Sjöholm, K., Runström, A., et al. (2025) · Transplant International · doi:10.3389/ti.2025.15425 · Cited by 8
Self-citationMilhès, J., Marion, O., Puissant‐Lubrano, B., Carlé, C., Bouthemy, C., Bello, A. D., Kamar, N., Renaudineau, Y., & Congy‐Jolivet, N. (2023) · Journal of Translational Autoimmunity · doi:10.1016/j.jtauto.2023.100223 · Cited by 8
Plasma cell biology: Foundations for targeted therapeutic development in transplantation
Rossi, A. P., Alloway, R. R., Hildeman, D. A., & Woodle, E. S. (2021) · Immunological Reviews · doi:10.1111/imr.13011 · Cited by 8
Serum immunoglobulin and the threshold of Fc receptor-mediated immune activation
Bauer-Smith, H., Sudol, A. S. L., Beers, S. A., & Crispin, M. (2023) · Biochimica et Biophysica Acta (BBA) - General Subjects · doi:10.1016/j.bbagen.2023.130448 · Cited by 10
IgG-cleavage protein allows therapeutic AAV gene delivery in passively immunized MPS IIIA mice
Bobo, T. A., Samowitz, P. N., Robinson, M. I., Montes, L., Forsberg, L. J., Feng, R., Nicely, N. I., & Fu, H. (2022) · Gene Therapy · doi:10.1038/s41434-022-00368-9 · Cited by 7
Sun, J., Chen, C., Pan, P., Zhang, K., Xu, J., & Chen, C. (2024) · Frontiers in Immunology · doi:10.3389/fimmu.2024.1418061 · Cited by 6
Trends in cardiovascular medicine: Update on cardiac transplantation
Coniglio, A. C., Bryner, B. S., DeVore, A. D., & Patel, C. B. (2021) · Trends in Cardiovascular Medicine · doi:10.1016/j.tcm.2021.11.005 · Cited by 6
Emerging strategies for antibody-mediated rejection
Malvezzi, P. (2022) · Current Opinion in Organ Transplantation · doi:10.1097/mot.0000000000001016 · Cited by 7
Chop-Chop: The Future of Bacterial Enzymes in Transfusion Medicine
Klontz, E. H. (2022) · Transfusion Medicine Reviews · doi:10.1016/j.tmrv.2022.05.003 · Cited by 6
Updated management for antibody-mediated rejection: opportunity to prolong kidney allograft survival
Townamchai, N., & Avihingsanon, Y. (2022) · Current Opinion in Nephrology & Hypertension · doi:10.1097/mnh.0000000000000843 · Cited by 5
Shiina, Y., Suzuki, H., Hata, A., Kaiho, T., Matsumoto, H., Toyoda, T., Sakairi, Y., Wada, H., Motohashi, S., & Yoshino, I. (2022) · General Thoracic and Cardiovascular Surgery · doi:10.1007/s11748-022-01844-0 · Cited by 5
Update on Desensitization Strategies and Drugs on Hyperimmune Patients for Kidney Transplantation
Salvadori, M. (2023) · Transplantology · doi:10.3390/transplantology4030014 · Cited by 4
Segundo, D. S., Comins‐Boo, A., & López‐Hoyos, M. (2025) · International Journal of Molecular Sciences · doi:10.3390/ijms26020630 · Cited by 4
New approach to desensitization in solid organ transplantation-imlifidase
Durlik, M. (2022) · Frontiers in Transplantation · doi:10.3389/frtra.2022.951360 · Cited by 4
Bergan, S., & Vethe, N. T. (2024) · British Journal of Clinical Pharmacology · doi:10.1111/bcp.16170 · Cited by 4
Treatment Strategies for Antibody-mediated Rejection in Kidney Transplantation and Its Prevention
Cocco, P. D., Fratti, A., Kaylan, K. B., Tzvetanov, I. G., & Benedetti, E. (2020) · OBM Transplantation · doi:10.21926/obm.transplant.2003119 · Cited by 3
Desensitization With Imlifidase: Overcoming Immunological Barriers in Kidney Transplantation
Hernández-Velasco, P., Martínez, E. G., Fernandez, N. I. P., González, E., González-García, C., Sierra, E. M., & Belmonte, A. A. (2025) · Kidney Medicine · doi:10.1016/j.xkme.2025.101076 · Cited by 2
Clinical implications of imlifidase interference in antibody screening and transfusion management
Osmani, Z., de Vries, A. P. J., & Albersen, A. (2025) · Transfusion · doi:10.1111/trf.18447 · Cited by 2
Complication from Desensitization
Han, D. J. (2019) · Springer eBooks · doi:10.1007/978-981-10-7046-4_6 · Cited by 2
Imlifidase: Is it the Magic Wand in Renal Transplantation?
Krishnan, N. S., & Briggs, D. (2024) · Indian Journal of Nephrology · doi:10.25259/ijn_325_23 · Cited by 2
Rescuing AAV gene transfer from antibody neutralization with an IgG-degrading enzymePreprint
Elmore, Z. C., Oh, D. K., Simon, K. E., Fanous, M. M., & Asokan, A. (2020) · bioRxiv (Cold Spring Harbor Laboratory) · doi:10.1101/2020.05.12.092122 · Cited by 2
Carpenter, M. C., Souter, S. C., Zipkin, R. J., & Ackerman, M. E. (2023) · Transfusion Medicine Reviews · doi:10.1016/j.tmrv.2023.150779 · Cited by 1
AlNajjar, M., Rochat, R. H., Grimes, A. B., Navaei, A., Eagar, T. N., Martinez, C. A., Yassine, K., Krance, R. A., & Bhar, S. (2024) · Pediatric Blood & Cancer · doi:10.1002/pbc.31412 · Cited by 1
Devriese, M., Carelli, I., Giraldo, L., Pin, A., Groshaeny, N., Silva, S. D., Bockermann, R., & Taupin, J. (2025) · HLA · doi:10.1111/tan.70502 · Cited by 1
Hannachi, E., Trecco, A., Daventure, V., Delignat, S., Bonilla, P., Lecerf, M., Thaunat, O., Dimitrov, J. D., Deligne, C., & Lacroix‐Desmazes, S. (2026) · Frontiers in Immunology · doi:10.3389/fimmu.2026.1728855 · Cited by 1
Bénichou, B., Fuhr, R., Vernadal, E., Valero, S., Tamarit, B., Ferrer, V., González‐Aseguinolaza, G., Douar, A. M., Froissart, M., Brossel, A., et al. (2026) · Frontiers in Immunology · doi:10.3389/fimmu.2026.1824802 · Cited by 1
Imlifidase as a Potential Treatment for Antibody-Mediated Rejection
Huang, E., & Jordan, S. C. (2021) · Current Transplantation Reports · doi:10.1007/s40472-021-00327-0 · Cited by 1
A Lesson of Immunosuppression in Renal Transplant: Retreat or Hold?
Zhang, Q., Xie, Y., Cao, S., Chen, S., Zhang, W., & Chang, S. (2023) · The Yale Journal of Biology and Medicine · doi:10.59249/xgio3365 · Cited by 1
Maier, C., Klose, C., Seitz, C. M., Heubach, F., Döring, M., Meisel, R., Schuster, F. R., Gruhn, B., Keller, F., Rabsteyn, A., et al. (2024) · Blood Advances · doi:10.1182/bloodadvances.2023011016 · Cited by 1
IgM single antigen bead HLA-assay is affected by imlifidase through the cleavage of IgG but not IgM
Runström, A., Sjöholm, K., Roupé, K. M., Lorant, T., Kjellman, C., & Bockermann, R. (2021) · Transplant Immunology · doi:10.1016/j.trim.2021.101436 · Cited by 1
Self-citationNew IDEaS for HIT treatment, anyone?
Padmanabhan, A. (2019) · Blood · doi:10.1182/blood.2019000695
Overcoming Donor/Recipient Incompatibility
Vella, J. P., & Wiseman, A. C. (2019) · Nephrology Self-Assessment Program · doi:10.1681/nsap.2019.18.5.7
Molecular Therapy in Myasthenia Gravis
Gomathy, S. B., Agarwal, A., & Vishnu, V. Y. (2022) · touchREVIEWS in Neurology · doi:10.17925/usn.2022.18.1.49
Extensive substrate recognition by the streptococcal antibody-degrading enzymes IdeS and EndoS
Sudol, A. S. L., Crispin, M., Tews, I., Butler, J., & Ivory, D. P. (2022) · Acta Crystallographica Section A Foundations and Advances · doi:10.1107/s205327332209310x
Current Strategies in Immune Modulation and Desensitization Protocols
Patel, J., & Coutance, G. (2023) · Wiley eBooks · doi:10.1002/9781119633884.ch10
Kidney transplantation: the recipient
(2024) · Elsevier eBooks · doi:10.1016/b978-0-443-23571-9.00018-9 · Cited by 1
Bhaskaran, M. C., Chidambaram, P., Sakeeba, S. S., Eswaramoorthy, N., Bagherjeri, F. A., Monhemi, H., Perera, G. S., & Sriram, S. (2024) · SSRN Electronic Journal · doi:10.2139/ssrn.4780968
TDM of belatacept and other biologicals in transplantation.Preprint
Bergan, S., & Vethe, N. T. (2024) · doi:10.22541/au.171378065.51576153/v1
Imlifidase – ein innovativer Therapieansatz in der Nephrologie
Mestekemper, A. N., & Schreiber, A. (2024) · Die Nephrologie · doi:10.1007/s11560-024-00744-z
Management of Sensitization During Mechanical Circulatory Support
Cole, R. M., & KOBASHIGAWA, J. A. (2024) · Springer eBooks · doi:10.1007/978-3-031-74963-6_25
Petersen, M., Lin, J., Zhan, K., Anwar, P., Bockermann, R., & Anderson, C. C. (2025) · bioRxiv (Cold Spring Harbor Laboratory) · doi:10.1101/2025.09.10.674224
Tyrberg, L., Uhlin, F., Alam, S., Sonesson, E., Hellmark, T., Blom, A. M., & Segelmark, M. (2025) · Clinical Kidney Journal · doi:10.1093/ckj/sfaf393
Baykara, Y., Fang, D. C., Tran, M., & Yünce, M. (2026) · Transfusion Clinique et Biologique · doi:10.1016/j.tracli.2026.01.009
Therapeutic approaches for desensitization in the sensitized kidney transplant recipient
Ammerman, N., Vo, A. A., & Jordan, S. C. (2026) · Elsevier eBooks · doi:10.1016/b978-0-443-19093-3.00006-x
The making of the universal donor: a landmark in transplantation
Nghiem, D. D. (2026) · Elsevier eBooks · doi:10.1016/b978-0-443-19093-3.00008-3
Alvisi, M., Roberts, L., Roessig, L., Balderson, D. E., Sanganalmath, S. K., Braun, M., Gordon, S. N., Lacey, S. F., Pandya, P., & Hajjar, R. J. (2026) · Human Gene Therapy · doi:10.1177/10430342261430244
Metadata
- Authors
- Lorant, T., Bengtsson, M., Eich, T., Eriksson, B.-M., Winstedt, L., Järnum, S., Stenberg, Y., Robertson, A.-K., Mosén, K., Björck, L., Bäckman, L., Larsson, E., Wood, K., Tufveson, G., & Kjellman, C.
- Affiliations
- Uppsala University (SE)
- Hansa Biopharma (Sweden) (SE)
- Lund University (SE)
- University of Oxford (GB)
- Corresponding author
- Kjellman, Christian
- ORCID
- Venue
- American Journal of Transplantation
- Publisher
- Elsevier BV
- Published
- 2018-11
- Volume
- 18
- Issue
- 11
- Pages
- 2752-2762
- ISSN
- 1600-6135 (ISSN-L)
- PMC
- PMC6221156
- OpenAlex
- W2789946756
- Cited by
- 108
- References
- 23
- Citations by year
- 2026: 11 · 2025: 11 · 2024: 18 · 2023: 14 · 2022: 18 · 2021: 12 · 2020: 12 · 2019: 11 · 2018: 1
- FWCI
- 7.69
- Type
- journal article
- Language
- en
- Open access
- hybrid
- doi.org
- Licence
- Locations
- American Journal of Transplantation (publishedVersion, cc-by-nc)
- Europe PMC (PubMed Central) (publishedVersion, other-oa)
- PubMed Central (publishedVersion, cc-by-nc)
- PubMed (publishedVersion)
- Uppsala University Publications (Uppsala University) (submittedVersion, other-oa)
- Lund University Publications (Lund University) (submittedVersion)
- Topics
- Health Sciences › Medicine › Transplantation › Renal Transplantation Outcomes and Treatments
- Life Sciences › Immunology and Microbiology › Immunology › Monoclonal and Polyclonal Antibodies Research
- Life Sciences › Immunology and Microbiology › Immunology › Complement system in diseases
- Keywords
- ide, imlifidase, HLA antibodies, chronic kidney disease, HLA sensitization, IgG degradation, complement-dependent cytotoxicity, HLA crossmatch, kidney transplantation, immunogenicity, pharmacokinetics
- MeSH terms
- Adult, Aged, Bacterial Proteins, Desensitization, Immunologic, Female, Follow-Up Studies, Graft Rejection, Graft Survival, Histocompatibility, HLA Antigens, Humans, Immunoglobulin G, Infusions, Intravenous, Isoantibodies, Male, Middle Aged, Prognosis, Risk Factors, Streptococcus pyogenes, Complement C1q, Kidney Transplantation, Renal Insufficiency, Chronic
About these checks
Registry, retraction, Cites and statistics results are computed, not judged, with one exception: a printed reference that no index lists is read once by a model before it counts as a citation error. Claims are extracted by a model and kept only when their quote appears verbatim in the text; each cited source is then checked, with a model’s help, for whether it says what the claim relies on. Those verdicts can be wrong — read the claim’s quote and the cited source before relying on one.
Statistics and arithmetic are recomputed, not judged.
Confidence bands are shown only for fields calibrated on our annotated test set. None is calibrated yet, so no band is shown.
What counts as a claim ›How we measure confidence ›How we check this ›
Are you an author, or do you see a problem with this page? Request a review
