Cited by 126Immune cells in cancerCancer, Lipids, and MetabolismPhagocytosis and Immune Regulation

The DOI matches its Crossref record; 37 of the 37 references it cites were found in a registry or an index.

Lipid accumulation in macrophages confers protumorigenic polarization and immunity in gastric cancer

Open access

Abstract

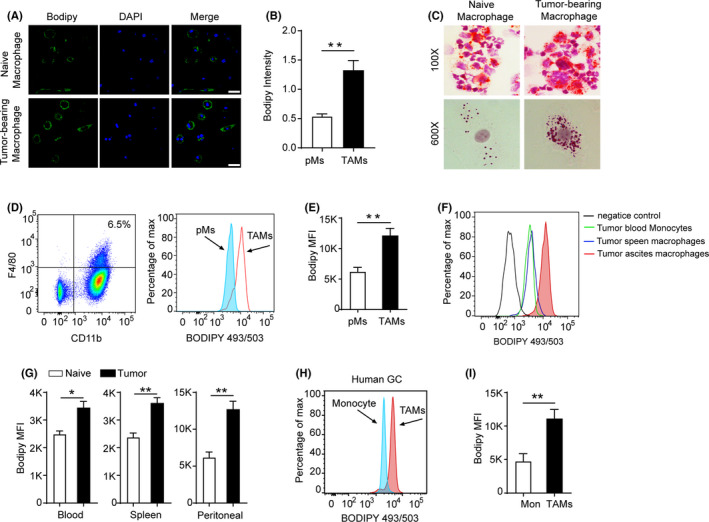
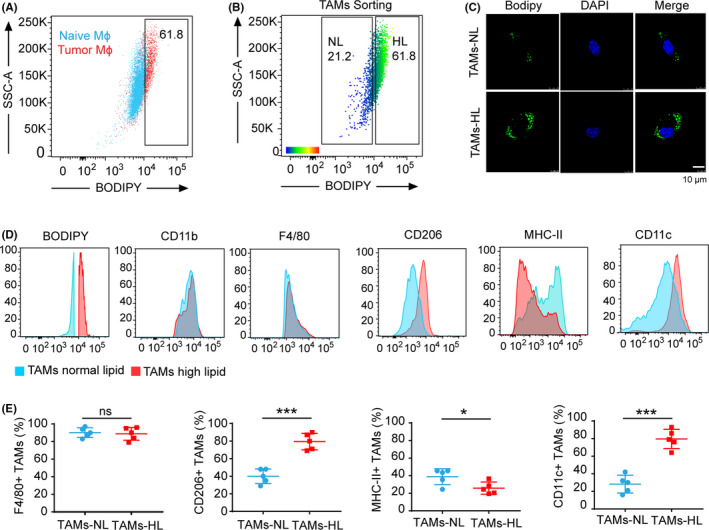
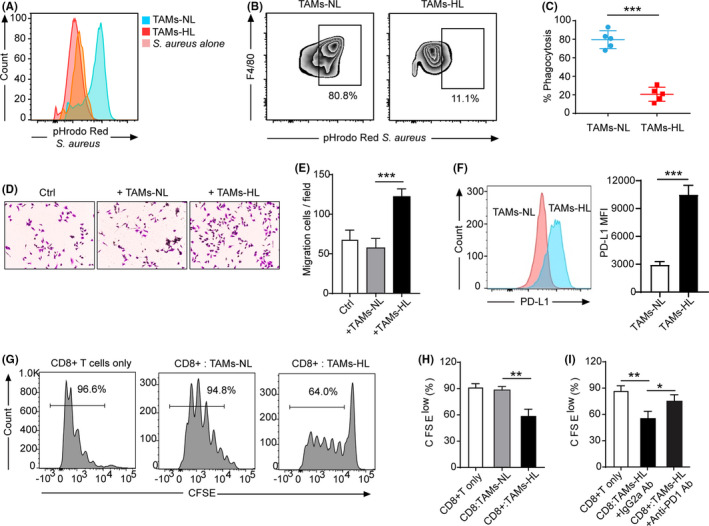
Heterotypic interactions between tumor cells and macrophages can enable tumor progression and hold potential for the development of therapeutic interventions. However, the communication between tumors and macrophages and its mechanism are poorly understood. Here, we find that tumor‐associated macrophages (TAM) from tumor‐bearing mice have high amounts of lipid as compared to macrophages from tumor‐free mice. TAM also present high lipid content in clinical human gastric cancer patients. Functionally, TAM with high lipid levels are characterized by polarized M2‐like profiling, and exhibit decreased phagocytic potency and upregulated programmed death ligand 1 (PD‐L1) expression, blocking anti–tumor T cell responses to support their immunosuppressive function. Mechanistically, Kyoto Encyclopedia of Genes and Genomes (KEGG) pathway analysis identifies the specific PI3K pathway enriched within lipid‐laid TAM. Lipid accumulation in TAM is mainly caused by increased uptake of extracellular lipids from tumor cells, which leads to the upregulated expression of gamma isoform of phosphoinositide 3‐kinase (PI3K‐γ) polarizing TAM to M2‐like profiling. Correspondingly, a preclinical gastric cancer model is used to show pharmacological targeting of PI3K‐γ in high‐lipid TAM with a selective inhibitor, IPI549. IPI549 restores the functional activity of macrophages and substantially enhances the phagocytosis activity and promotes cytotoxic‐T‐cell‐mediated tumor regression. Collectively, this symbiotic tumor‐macrophage interplay provides a potential therapeutic target for gastric cancer patients through targeting PI3K‐γ in lipid‐laden TAM.

Overview

The claims and statistics of this paper haven’t been checked yet.

Run the check — free, no account needed. It reads the open-access text and checks the sources it cites.

A few free checks a day · papers already verified open instantly · results are public

Integrity signals

Registry

Crossref · 10.1111/cas.14616

Cites

37 of 37 references verified0 citation errors · 0 not checkable

Statistics

Figures

FIGURE 1 Lipid accumulation in mouse and human tumor‐associated macrophages (TAM). A, Immunofluorescence images of F4/80+ macrophages from the peritoneal of naïve mice and the ascites of MFC tumor‐bearing mice staining with BODIPY 493/503. n = 3. Scale bar, 20 µm. Green, BODIPY 493/503; blue, DAPI. B, Immunofluorescence intensity of BODIPY 493/503 in F4/80+ peritoneal macrophages (pMs) or TAM was measured. C, neutral lipids were stained with oil red O and counterstained with hematoxylin. D, A typical example of the analysis of lipid level in F4/80+ macrophages from peritoneal of control (blue) or ascites of MFC tumor‐bearing mice (red) by FACS. E, Geometric mean fluorescence intensity (MFI) of BODIPY 493/503 was measured by FACS. n = 5. F, Lipid level in F4/80+ macrophages from blood, spleen, and ascites in MFC tumor‐bearing mice or WT mice. n = 3. G, Lipid levels in macrophages from naïve or MFC tumor‐bearing mice collected on week 2 after tumor inoculation. H, Typical FACS analysis of BODIPY 493/503 in TAM from the individual with gastric cancer (GC). I, Cumulative results of lipid levels in TAM from individuals with GC
FIGURE 1 Lipid accumulation in mouse and human tumor‐associated macrophages (TAM). A, Immunofluorescence images of F4/80+ macrophages from the peritoneal of naïve mice and the ascites of MFC tumor‐bearing mice staining with BODIPY 493/503. n = 3. Scale bar, 20 µm. Green, BODIPY 493/503; blue, DAPI. B, Immunofluorescence intensity of BODIPY 493/503 in F4/80+ peritoneal macrophages (pMs) or TAM was measured. C, neutral lipids were stained with oil red O and counterstained with hematoxylin. D, A typical example of the analysis of lipid level in F4/80+ macrophages from peritoneal of control (blue) or ascites of MFC tumor‐bearing mice (red) by FACS. E, Geometric mean fluorescence intensity (MFI) of BODIPY 493/503 was measured by FACS. n = 5. F, Lipid level in F4/80+ macrophages from blood, spleen, and ascites in MFC tumor‐bearing mice or WT mice. n = 3. G, Lipid levels in macrophages from naïve or MFC tumor‐bearing mice collected on week 2 after tumor inoculation. H, Typical FACS analysis of BODIPY 493/503 in TAM from the individual with gastric cancer (GC). I, Cumulative results of lipid levels in TAM from individuals with GCCC BY-NC-ND · PubMed Central
FIGURE 2 Characterization of lipid‐accumulated tumor‐associated macrophages (TAM). A, Dot plot shows the overlay of naïve macrophages and TAM based on different lipid levels, setting the cutoff of normal lipid levels in the macrophage. Blue, naïve mouse; red, tumor‐bearing mouse. B, Examples of gates set for the sort of F4/80 + TAM with normal lipid (NL) and high lipid (HL) content isolated from MFC tumor‐bearing mice. C, Immunofluorescence analysis of BODIPY 493/503 in sorted F4/80+ TAM with different lipid levels. Scale bar, 10 µm. D. Representative flow cytometry histograms showing expression of typical TAM markers in TAM‐NL versus HL from MFC tumors. n = 5. E, Quantification analysis of TAM markers in TAM‐NL versus TAM‐HL subsets from MFC tumors. n = 5
FIGURE 2 Characterization of lipid‐accumulated tumor‐associated macrophages (TAM). A, Dot plot shows the overlay of naïve macrophages and TAM based on different lipid levels, setting the cutoff of normal lipid levels in the macrophage. Blue, naïve mouse; red, tumor‐bearing mouse. B, Examples of gates set for the sort of F4/80 + TAM with normal lipid (NL) and high lipid (HL) content isolated from MFC tumor‐bearing mice. C, Immunofluorescence analysis of BODIPY 493/503 in sorted F4/80+ TAM with different lipid levels. Scale bar, 10 µm. D. Representative flow cytometry histograms showing expression of typical TAM markers in TAM‐NL versus HL from MFC tumors. n = 5. E, Quantification analysis of TAM markers in TAM‐NL versus TAM‐HL subsets from MFC tumors. n = 5CC BY-NC-ND · PubMed Central
FIGURE 3 The pro–tumor functional activity of lipid‐accumulated tumor‐associated macrophages (TAM). A, Representative histogram showing the difference in RED fluorescence of TAM‐normal lipid (NL) versus TAM‐high lipid (HL) by phagocytosis assay. B, Representative histograms showing the flow cytometry gating strategy for phagocytosis by TAM‐NL and TAM‐HL. REDhigh TAM were considered to be phagocytosing. C, Analysis of phagocytosis shows that TAM‐HL phagocytosed significantly less than TAM‐NL. n = 5. ***P < 0.001. D, E, Migration assay of MFC cells cocultured with sorted TAM‐NL or TAM‐HL after 24h incubation. Representative images (D) and quantification of migration cells (E) are shown. ***P < 0.001. F, Programmed death ligand 1 (PD‐L1) expression level of TAM‐NL and TAM‐HL from MFC tumor‐bearing mice. G, H, I, Representative histograms of CD8+ T cell proliferation at CD8+ T cells to TAM ratio 1:1 (G) and quantification of CD8+ T cell proliferation in indicated condition using carboxyfluorescein succinimidyl ester (CFSE) dilution assay (H, I) (n = 3). *P < 0.05. **P < 0.01
FIGURE 3 The pro–tumor functional activity of lipid‐accumulated tumor‐associated macrophages (TAM). A, Representative histogram showing the difference in RED fluorescence of TAM‐normal lipid (NL) versus TAM‐high lipid (HL) by phagocytosis assay. B, Representative histograms showing the flow cytometry gating strategy for phagocytosis by TAM‐NL and TAM‐HL. REDhigh TAM were considered to be phagocytosing. C, Analysis of phagocytosis shows that TAM‐HL phagocytosed significantly less than TAM‐NL. n = 5. ***P < 0.001. D, E, Migration assay of MFC cells cocultured with sorted TAM‐NL or TAM‐HL after 24h incubation. Representative images (D) and quantification of migration cells (E) are shown. ***P < 0.001. F, Programmed death ligand 1 (PD‐L1) expression level of TAM‐NL and TAM‐HL from MFC tumor‐bearing mice. G, H, I, Representative histograms of CD8+ T cell proliferation at CD8+ T cells to TAM ratio 1:1 (G) and quantification of CD8+ T cell proliferation in indicated condition using carboxyfluorescein succinimidyl ester (CFSE) dilution assay (H, I) (n = 3). *P < 0.05. **P < 0.01CC BY-NC-ND · PubMed Central
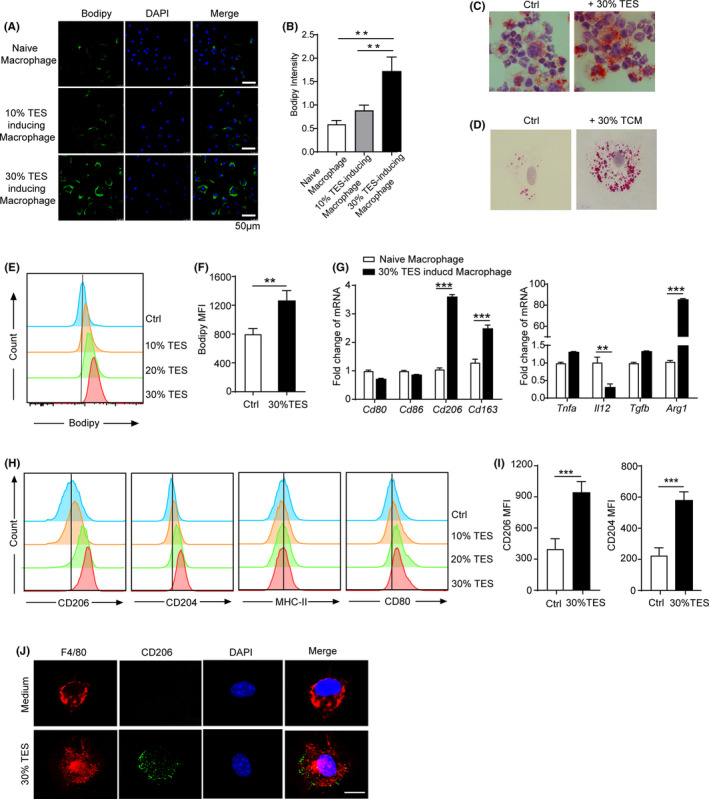
FIGURE 4 Tumor explant supernatants induce lipid accumulation to generate cancer‐supporting M2 macrophages. A, Immunofluorescence images of lipid level in naïve peritoneal macrophages cultured with 10%, 30% MFC‐tumor explant supernatant (TES) for 24 h. B, Quantification of the intensity of BODIPY 493/503 by ImageJ. n = 5. C, D, Oil red O staining the lipid content in macrophage cultured with 30% MFC‐TES (Mag. 100×) (C) or with 30% MFC‐tumor‐conditioned medium (TCM) for 24 h (Mag. 600×) (D). E, F, Representative histogram showing lipid level (E) and quantification of the intensity (F) in naïve peritoneal macrophages cultured with indicated concentrations of MFC‐TES for 24 h. G, mRNA expression of the indicated typical M1 and M2 markers in macrophage cultured with control medium or 30% TCM for 48 h. The results are normalized to β‐actin. H, I, Representative histogram (H) and quantification (I) show that 30% of MFC‐TES‐treated macrophages have higher expression of CD206 and CD204 than naïve macrophages. n = 5; three experimental repeats. J, Immunofluorescence images of TCM‐treated macrophage. Scale bar, 20 µm. Red, F4/80; green, CD206; blue, DAPI
FIGURE 4 Tumor explant supernatants induce lipid accumulation to generate cancer‐supporting M2 macrophages. A, Immunofluorescence images of lipid level in naïve peritoneal macrophages cultured with 10%, 30% MFC‐tumor explant supernatant (TES) for 24 h. B, Quantification of the intensity of BODIPY 493/503 by ImageJ. n = 5. C, D, Oil red O staining the lipid content in macrophage cultured with 30% MFC‐TES (Mag. 100×) (C) or with 30% MFC‐tumor‐conditioned medium (TCM) for 24 h (Mag. 600×) (D). E, F, Representative histogram showing lipid level (E) and quantification of the intensity (F) in naïve peritoneal macrophages cultured with indicated concentrations of MFC‐TES for 24 h. G, mRNA expression of the indicated typical M1 and M2 markers in macrophage cultured with control medium or 30% TCM for 48 h. The results are normalized to β‐actin. H, I, Representative histogram (H) and quantification (I) show that 30% of MFC‐TES‐treated macrophages have higher expression of CD206 and CD204 than naïve macrophages. n = 5; three experimental repeats. J, Immunofluorescence images of TCM‐treated macrophage. Scale bar, 20 µm. Red, F4/80; green, CD206; blue, DAPICC BY-NC-ND · PubMed Central
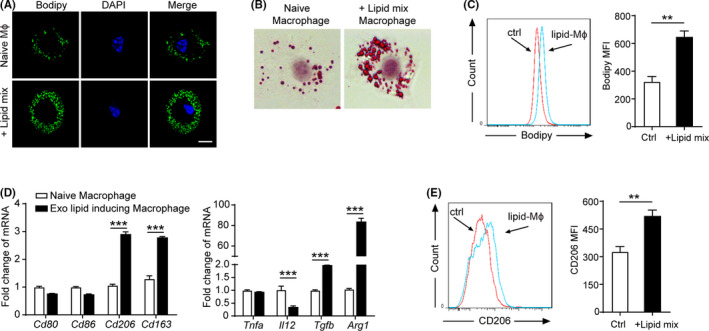
FIGURE 5 Exogenous lipid mixture is sufficient to induce M2 polarization of macrophage. A, Immunofluorescence images of lipid level in naïve peritoneal macrophages cultured in the presence of vehicle or 2 µg/mL exo‐lipid mixtures for 24 h. B, Oil red O staining the lipid content in macrophage treated with 2 µg/mL exo‐lipid mixtures for 24 h (magnification 600×). C, Representative histogram showing lipid level (left panel) and quantification of lipid content (right panel) in naïve peritoneal macrophages treated with 2 µg/mL exo‐lipid mixtures or control medium for 24 h. D, mRNA expression of the indicated typical M1/M2 markers and typical cytokine genes in macrophage cultured for 48 h with the indicated condition. E, Representative histogram (left panel) and quantification (right panel) show that lipid mixture‐treated macrophages have higher expression of CD206 than control. n = 5; three experimental repeats
FIGURE 5 Exogenous lipid mixture is sufficient to induce M2 polarization of macrophage. A, Immunofluorescence images of lipid level in naïve peritoneal macrophages cultured in the presence of vehicle or 2 µg/mL exo‐lipid mixtures for 24 h. B, Oil red O staining the lipid content in macrophage treated with 2 µg/mL exo‐lipid mixtures for 24 h (magnification 600×). C, Representative histogram showing lipid level (left panel) and quantification of lipid content (right panel) in naïve peritoneal macrophages treated with 2 µg/mL exo‐lipid mixtures or control medium for 24 h. D, mRNA expression of the indicated typical M1/M2 markers and typical cytokine genes in macrophage cultured for 48 h with the indicated condition. E, Representative histogram (left panel) and quantification (right panel) show that lipid mixture‐treated macrophages have higher expression of CD206 than control. n = 5; three experimental repeatsCC BY-NC-ND · PubMed Central
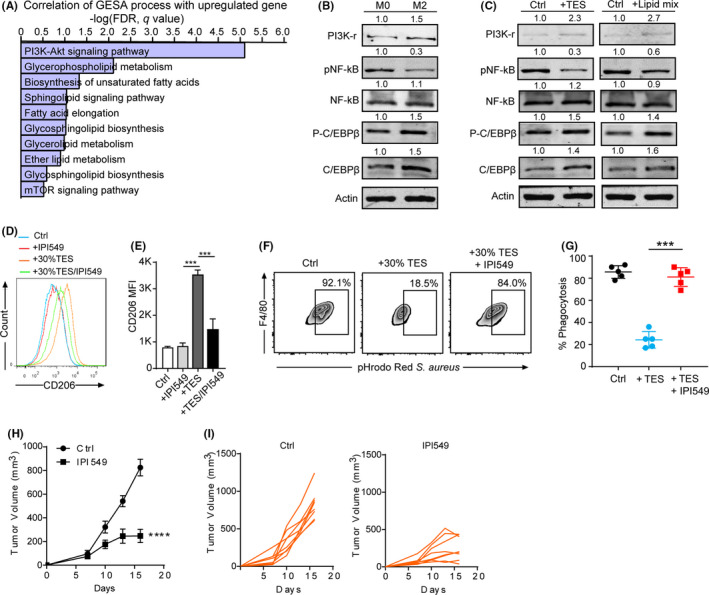
FIGURE 6 Lipid accumulation polarizes macrophages to an M2‐like state that is critical for pro–tumor potential via PI3K‐γ. A, The top enrichment of the Kyoto Encyclopedia of Genes and Genomes (KEGG) gene set in tumor‐associated macrophages (TAM) from the MFC‐bearing tumor model is shown. B, WB immunoblotting of indicated proteins in M0 and M2 macrophages. C, Immunoblotting in macrophages treated with 30% MFC‐tumor explant supernatant (TES) and 2 µg/mL exo‐lipid mixtures for 48 h. D, E, Representative overlay histogram (D) and quantification (E) showing PI3K‐γ inhibitor (IPI549) reverse the high expression of CD206 in MFC‐TES‐treated macrophages. n = 5; three experimental repeats. Data are mean + SEM; ***P < 0.001. F, Representative histograms showing the phagocytosis by macrophage treated with 30% MFC‐TES and/or IPI549. G, Analysis of phagocytosis in macrophage treated with 30% MFC‐TES and/or IPI549. n = 5. ***P < 0.001. H, Mean tumor volume of MFC murine gastric cancer in 615 mice administered with IPI‐549 versus vehicle‐treatment (n = 8). Data are mean ± SEM; ****P < 0.0001. I, Individual tumor volumes of intradermal MFC implants in mice treated with IPI‐549 or vehicle (n = 8)
FIGURE 6 Lipid accumulation polarizes macrophages to an M2‐like state that is critical for pro–tumor potential via PI3K‐γ. A, The top enrichment of the Kyoto Encyclopedia of Genes and Genomes (KEGG) gene set in tumor‐associated macrophages (TAM) from the MFC‐bearing tumor model is shown. B, WB immunoblotting of indicated proteins in M0 and M2 macrophages. C, Immunoblotting in macrophages treated with 30% MFC‐tumor explant supernatant (TES) and 2 µg/mL exo‐lipid mixtures for 48 h. D, E, Representative overlay histogram (D) and quantification (E) showing PI3K‐γ inhibitor (IPI549) reverse the high expression of CD206 in MFC‐TES‐treated macrophages. n = 5; three experimental repeats. Data are mean + SEM; ***P < 0.001. F, Representative histograms showing the phagocytosis by macrophage treated with 30% MFC‐TES and/or IPI549. G, Analysis of phagocytosis in macrophage treated with 30% MFC‐TES and/or IPI549. n = 5. ***P < 0.001. H, Mean tumor volume of MFC murine gastric cancer in 615 mice administered with IPI‐549 versus vehicle‐treatment (n = 8). Data are mean ± SEM; ****P < 0.0001. I, Individual tumor volumes of intradermal MFC implants in mice treated with IPI‐549 or vehicle (n = 8)CC BY-NC-ND · PubMed Central
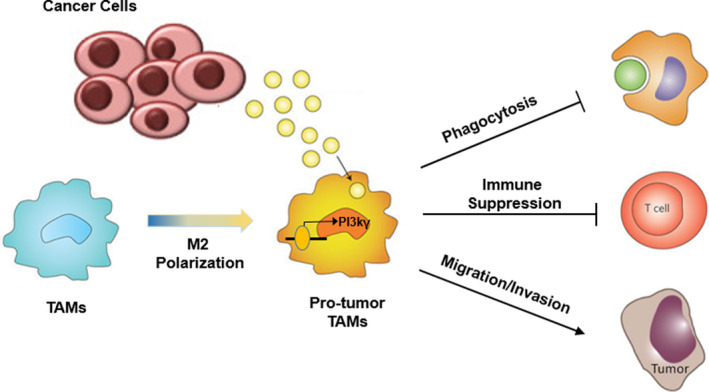
FIGURE 7 Schema of protumorigenic characteristics of lipid‐accumulated macrophages. Tumor‐associated macrophages (TAM) with high lipid content exhibit the protumorigenic characteristics with decreased phagocytosis and impaired anti–tumor immunity. Mechanically, tumor‐derived lipids induce TAM to M2‐like polarization via the PI3K‐γ signaling pathway and pharmaceutical targeting PI3K‐γ overcomes the protumoral TAM function
FIGURE 7 Schema of protumorigenic characteristics of lipid‐accumulated macrophages. Tumor‐associated macrophages (TAM) with high lipid content exhibit the protumorigenic characteristics with decreased phagocytosis and impaired anti–tumor immunity. Mechanically, tumor‐derived lipids induce TAM to M2‐like polarization via the PI3K‐γ signaling pathway and pharmaceutical targeting PI3K‐γ overcomes the protumoral TAM functionCC BY-NC-ND · PubMed Central

Verification

Claims the paper makes

The claims and statistics of this paper haven’t been checked yet.

Run the check — free, no account needed. It reads the open-access text and checks the sources it cites.

A few free checks a day · papers already verified open instantly · results are public

Claims other papers make about this one

Each is checked against this paper’s own text: does it say what the citing paper says it does?

Self-check

Percentages, sums and reported differences re-computed from the paper’s own numbers.

The self-check needs the paper’s full text.

Citations

Cites

Show all 37 references

Cited by

Sorted by citations

See all 126

Metadata

Authors
Luo, Q., Zheng, N., Jiang, L., Wang, T., Zhang, P., Liu, Y., Zheng, P., Wang, W., Xie, G., Chen, L., Li, D., Dong, P., Yuan, X., & Shen, L.
Affiliations
Shanghai Jiao Tong University (CN)
Corresponding author
  • Yuan, Xiangliang
  • Shen, Lisong
Venue
Cancer Science
Publisher
Wiley
Published
2020-09-18
Volume
111
Issue
11
Pages
4000-4011
ISSN
  • 1347-9032 (ISSN-L)
  • 1349-7006
OpenAlex
W3049344485
Cited by
126
References
37
Citations by year
2026: 21 · 2025: 26 · 2024: 32 · 2023: 21 · 2022: 21 · 2021: 4
FWCI
4.03
Type
journal article
Language
en
Open access
Locations
  • Cancer Science (publishedVersion, cc-by-nc-nd)
  • PubMed Central (publishedVersion, cc-by-nc-nd)
  • PubMed (publishedVersion)
Funders
National Natural Science Foundation of China (81372641, 81402148, 81472244, 81672363, 81772525)
Topics
  • Life Sciences › Immunology and Microbiology › Immunology › Immune cells in cancer
  • Life Sciences › Biochemistry, Genetics and Molecular Biology › Cancer Research › Cancer, Lipids, and Metabolism
  • Life Sciences › Immunology and Microbiology › Immunology › Phagocytosis and Immune Regulation
Keywords
tumor-associated macrophages, gastric cancer, lipid accumulation, macrophage polarization, M2 macrophages, PI3Kγ, PD-L1, tumor immunosuppression, phagocytosis, tumor-macrophage interaction, cytotoxic T lymphocytes
MeSH terms
Lipidomics, Tumor-Associated Macrophages, Animals, Cell Transformation, Neoplastic, Disease Models, Animal, Disease Susceptibility, Female, Fluorescent Antibody Technique, Humans, Macrophage Activation, Macrophages, Models, Biological, Phagocytosis, Stomach Neoplasms, Immunophenotyping, T-Lymphocyte Subsets, Phosphatidylinositol 3-Kinases, Cell Line, Tumor, Lipid Metabolism, Mice, Tumor Microenvironment

About these checks

Registry, retraction, Cites and statistics results are computed, not judged, with one exception: a printed reference that no index lists is read once by a model before it counts as a citation error. Claims are extracted by a model and kept only when their quote appears verbatim in the text; each cited source is then checked, with a model’s help, for whether it says what the claim relies on. Those verdicts can be wrong — read the claim’s quote and the cited source before relying on one.

Statistics and arithmetic are recomputed, not judged.

Confidence bands are shown only for fields calibrated on our annotated test set. None is calibrated yet, so no band is shown.

What counts as a claim ›How we measure confidence ›How we check this ›

Are you an author, or do you see a problem with this page? Request a review