Cited by 116

The DOI matches its Crossref record; 4 of the 4 references it cites were found in a registry or an index.

Single‐cell RNA sequencing reveals tumor heterogeneity, microenvironment, and drug‐resistance mechanisms of recurrent glioblastoma

Wu, Haibin, Guo, Chengcheng, Wang, Chaoye, Xu, Jiang, Zheng, Suyue, Duan, Jian, Li, Yiyun, Bai, Hongming, Xu, Qiuyan, Ning, Fangling, Wang, Feng, Yang, Qunying·2023·Cancer Science

Abstract

Glioblastomas are highly heterogeneous brain tumors. Despite the availability of standard treatment for glioblastoma multiforme (GBM), i.e., Stupp protocol, which involves surgical resection followed by radiotherapy and chemotherapy, glioblastoma remains refractory to treatment and recurrence is inevitable. Moreover, the biology of recurrent glioblastoma remains unclear. Increasing evidence has shown that intratumoral heterogeneity and the tumor microenvironment contribute to therapeutic resistance. However, the interaction between intracellular heterogeneity and drug resistance in recurrent GBMs remains controversial. The aim of this study was to map the transcriptome landscape of cancer cells and the tumor heterogeneity and tumor microenvironment in recurrent and drug‐resistant GBMs at a single‐cell resolution and further explore the mechanism of drug resistance of GBMs. We analyzed six tumor tissue samples from three patients with primary GBM and three patients with recurrent GBM in which recurrence and drug resistance developed after treatment with the standard Stupp protocol using single‐cell RNA sequencing. Using unbiased clustering, nine major cell clusters were identified. Upregulation of the expression of stemness‐related and cell‐cycle‐related genes was observed in recurrent GBM cells. Compared with the initial GBM tissues, recurrent GBM tissues showed a decreased proportion of microglia, consistent with previous reports. Finally, vascular endothelial growth factor A expression and the blood–brain barrier permeability were high, and the O 6 ‐methylguanine DNA methyltransferase‐related signaling pathway was activated in recurrent GBM. Our results delineate the single‐cell map of recurrent glioblastoma, tumor heterogeneity, tumor microenvironment, and drug‐resistance mechanisms, providing new insights into treatment strategies for recurrent glioblastomas.

Overview

The claims and statistics of this paper haven’t been checked yet.

Run the check — free, no account needed. It reads the open-access text and checks the sources it cites.

A few free checks a day · papers already verified open instantly · results are public

Integrity signals

Registry

Crossref · 10.1111/cas.15773

Cites

4 of 4 references verified0 citation errors · 0 not checkable

Statistics

Figures

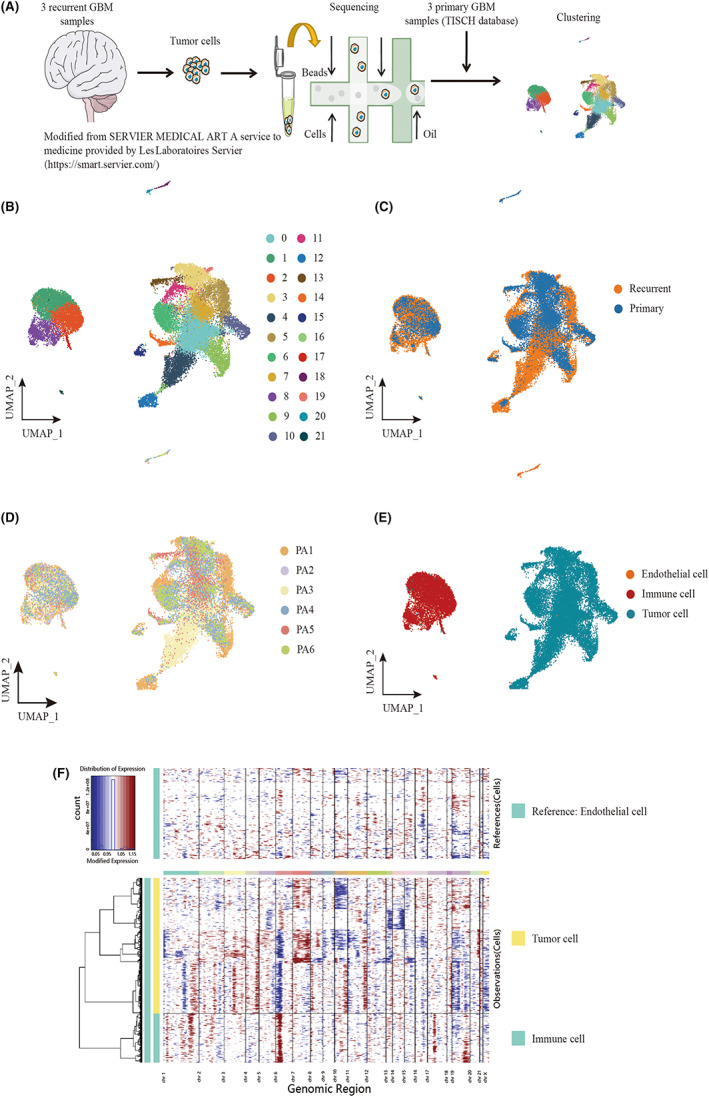
FIGURE 1 Landscape of cell composition in primary and recurrent glioblastoma. (A) Workflow of sample collection, sequencing, and analysis for single‐cell RNA‐seq data. Three samples of recurrent glioblastoma sequenced by Singleron platform. (B) Uniform Manifold Approximation and Projection (UMAP) plot showing the major clusters of all cells in a glioma. Each dot of the UMAP plot represents a single cell. Cells are color coded by their associated cell clusters. (C) UMAP plot showing the illness state of individual tumor cells in glioblastoma patients. Primary glioblastoma patients were collected from CGGA, and recurrent glioblastoma patients were collected from an independent cohort from the Sun Yat‐sen University Cancer Center. (D) UMAP plot showing the major lineages in glioblastoma (GBM). Each dot of the UMAP plot represents a single cell. Cells are color coded by their associated cell lineages. (E) UMAP plots showing the origins of individual tumor cells in GBM patients. (F) The CNV pattern of each cell in immune cells and tumor cells. Red means amplification and blue indicates deletion. The intensity of the red and blue color components correlates with the gain and loss values.
FIGURE 1 Landscape of cell composition in primary and recurrent glioblastoma. (A) Workflow of sample collection, sequencing, and analysis for single‐cell RNA‐seq data. Three samples of recurrent glioblastoma sequenced by Singleron platform. (B) Uniform Manifold Approximation and Projection (UMAP) plot showing the major clusters of all cells in a glioma. Each dot of the UMAP plot represents a single cell. Cells are color coded by their associated cell clusters. (C) UMAP plot showing the illness state of individual tumor cells in glioblastoma patients. Primary glioblastoma patients were collected from CGGA, and recurrent glioblastoma patients were collected from an independent cohort from the Sun Yat‐sen University Cancer Center. (D) UMAP plot showing the major lineages in glioblastoma (GBM). Each dot of the UMAP plot represents a single cell. Cells are color coded by their associated cell lineages. (E) UMAP plots showing the origins of individual tumor cells in GBM patients. (F) The CNV pattern of each cell in immune cells and tumor cells. Red means amplification and blue indicates deletion. The intensity of the red and blue color components correlates with the gain and loss values.CC BY-NC-ND · PubMed Central
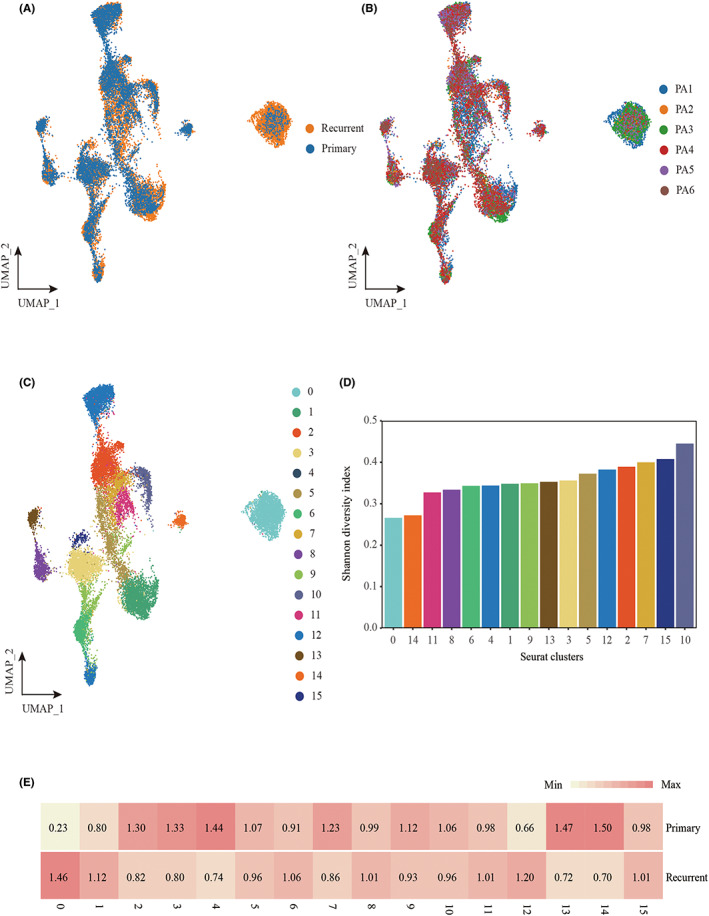
FIGURE 2 Cellular landscape of the tumor cell in primary and recurrent glioblastoma patients. (A) UMAP plot showing the illness state of individual tumor cells in glioblastoma patients. (B) UMAP plot showing the illness state of individual tumor cells in glioblastoma patients. Primary patients were collected from CGGA, and relapse patients were collected from an independent cohort from the Sun Yat‐sen University Cancer Center. (C) UMAP plot showing the major clusters of tumor cells in glioblastoma patients. Each dot of the UMAP plot represents a single cell. Cells are color coded by their associated cell clusters. (D) Normalized Shannon diversity index (NSDI) of major clusters that indicates the evenness of major clusters in each patient. (E) Heatmap showing the illness state preferences of major clusters estimated by the Ro/e score that denotes the ratio of observed to expected cell number.
FIGURE 2 Cellular landscape of the tumor cell in primary and recurrent glioblastoma patients. (A) UMAP plot showing the illness state of individual tumor cells in glioblastoma patients. (B) UMAP plot showing the illness state of individual tumor cells in glioblastoma patients. Primary patients were collected from CGGA, and relapse patients were collected from an independent cohort from the Sun Yat‐sen University Cancer Center. (C) UMAP plot showing the major clusters of tumor cells in glioblastoma patients. Each dot of the UMAP plot represents a single cell. Cells are color coded by their associated cell clusters. (D) Normalized Shannon diversity index (NSDI) of major clusters that indicates the evenness of major clusters in each patient. (E) Heatmap showing the illness state preferences of major clusters estimated by the Ro/e score that denotes the ratio of observed to expected cell number.CC BY-NC-ND · PubMed Central
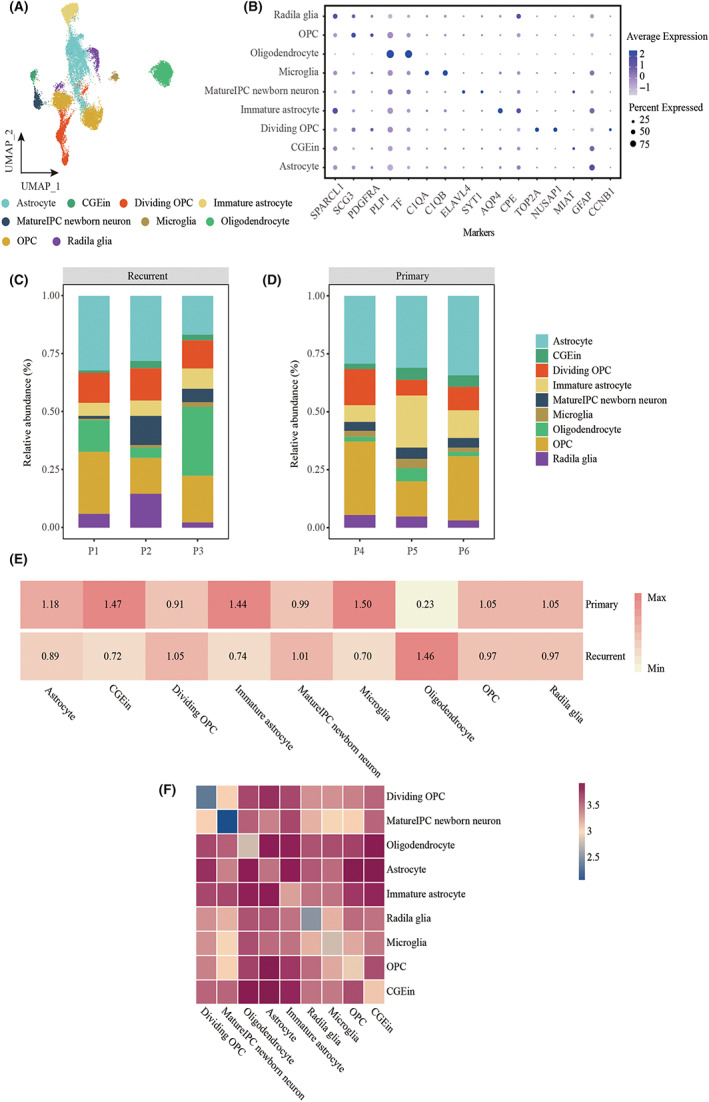
FIGURE 3 The frequency and evenness of each cell type in samples. (A) UMAP plot showing the major lineages of immune cells in a glioblastoma. Each dot of the UMAP plot represents a single cell. Cells are color coded by their associated cell lineages. (B) Dot plot showing the 16 signature gene expressions across the nine cellular clusters. The size of dots represents the proportion of cells expressing the particular marker, and the spectrum of color indicates the mean expression levels of the markers (log1p transformed). (C) Bar plot showing the fraction of major lineages of tumor cells in recurrent glioblastoma. (D) Bar plot showing the fraction of major lineages of tumor cells in primary glioblastoma. (E) Heatmap showing the illness state preferences of major tumor cell lineages estimated by the Ro/e score that denotes the ratio of observed to expected cell number. (F) Heatmap showing logarithmic interaction scores between all cell subsets.
FIGURE 3 The frequency and evenness of each cell type in samples. (A) UMAP plot showing the major lineages of immune cells in a glioblastoma. Each dot of the UMAP plot represents a single cell. Cells are color coded by their associated cell lineages. (B) Dot plot showing the 16 signature gene expressions across the nine cellular clusters. The size of dots represents the proportion of cells expressing the particular marker, and the spectrum of color indicates the mean expression levels of the markers (log1p transformed). (C) Bar plot showing the fraction of major lineages of tumor cells in recurrent glioblastoma. (D) Bar plot showing the fraction of major lineages of tumor cells in primary glioblastoma. (E) Heatmap showing the illness state preferences of major tumor cell lineages estimated by the Ro/e score that denotes the ratio of observed to expected cell number. (F) Heatmap showing logarithmic interaction scores between all cell subsets.CC BY-NC-ND · PubMed Central
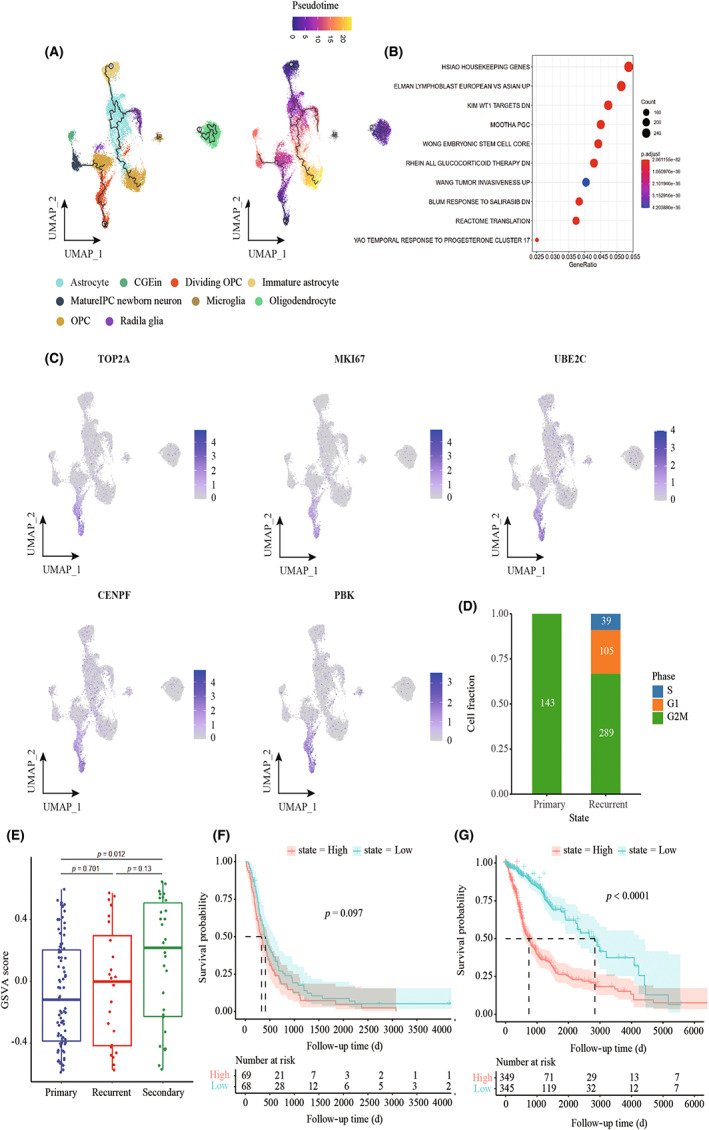
FIGURE 4 Developmental trajectory and identification of proliferation‐related tumor clusters in recurrent GBM. (A) The left UMAP plot shows the developmental trajectories (black lines). The right UMAP plot shows a pseudo‐time score from dark blue to yellow, indicating developmental states, respectively. Tumor cell subpopulations inferred by monocle3. (B) Gene set enrichment analysis in cluster 12, ordered by generation, enrichment of stem‐like cells, and tumor invasiveness in recurrent GBM. (C) UMAP plot showing the expression of proliferation gene markers in tumor subpopulations. (D) Bar plot showing the cell‐cycle distribution in different illness states. (E) Box plot showing GSVA of cluster 12 using a CGGA cohort. (F) Kaplan–Meier curves show probability of OS among patients with high radial glia signature (top 50%) versus low radial glia signature (bottom 50%) in patients from the CGGA cohort. (G) Kaplan–Meier curves show probability of OS among patients with high radial glia signature (top 50%) versus low radial glia signature (bottom 50%) in patients from TCGA‐GBM LGG cohort.
FIGURE 4 Developmental trajectory and identification of proliferation‐related tumor clusters in recurrent GBM. (A) The left UMAP plot shows the developmental trajectories (black lines). The right UMAP plot shows a pseudo‐time score from dark blue to yellow, indicating developmental states, respectively. Tumor cell subpopulations inferred by monocle3. (B) Gene set enrichment analysis in cluster 12, ordered by generation, enrichment of stem‐like cells, and tumor invasiveness in recurrent GBM. (C) UMAP plot showing the expression of proliferation gene markers in tumor subpopulations. (D) Bar plot showing the cell‐cycle distribution in different illness states. (E) Box plot showing GSVA of cluster 12 using a CGGA cohort. (F) Kaplan–Meier curves show probability of OS among patients with high radial glia signature (top 50%) versus low radial glia signature (bottom 50%) in patients from the CGGA cohort. (G) Kaplan–Meier curves show probability of OS among patients with high radial glia signature (top 50%) versus low radial glia signature (bottom 50%) in patients from TCGA‐GBM LGG cohort.CC BY-NC-ND · PubMed Central
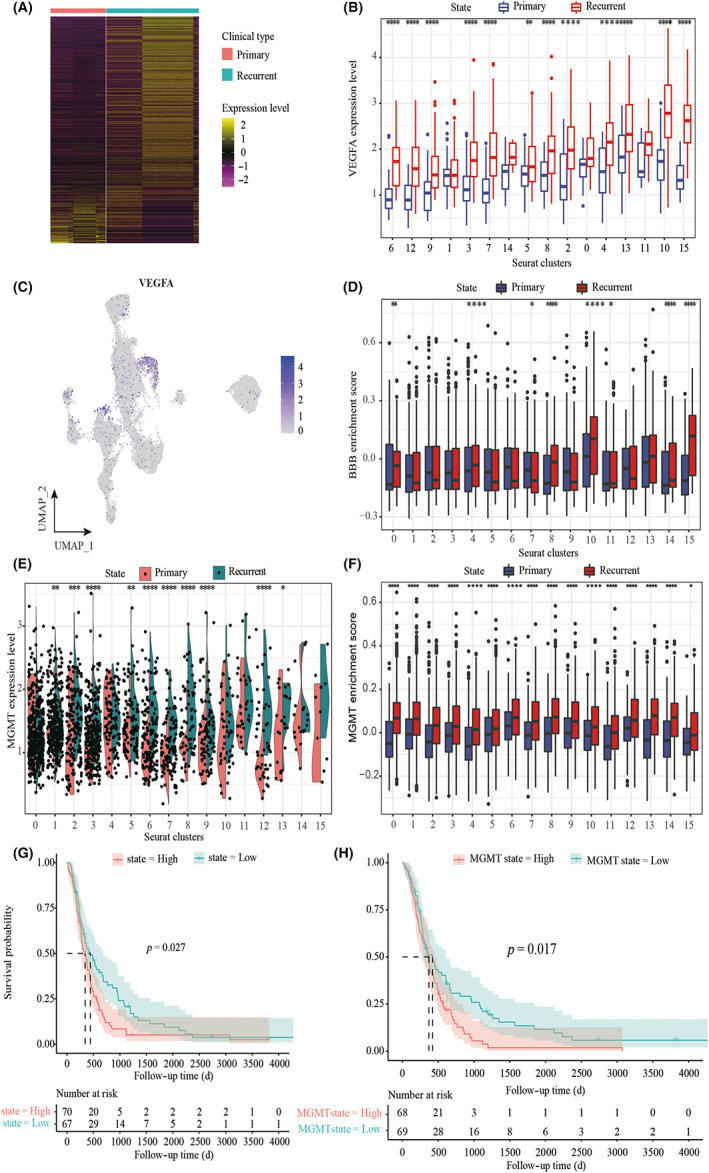
FIGURE 5 Identification of treatment resistance‐related tumor clusters in glioblastoma. (A) Heat map of differentially expressed genes (based on two‐sided Wilcoxon test) in primary and recurrent GBM. (B) Box plot showing the expression of VEGFA in tumor subpopulations. Each comparison is made using a two‐sided Wilcoxon test. (C) UMAP plot showing the expression of VEGFA in tumor subpopulations. (D) Gene set variation analysis (GSVA) of BBB signature using single‐cell data. Each comparison is made using a two‐sided Wilcoxon test. (E) Violin plots showing the expression of MGMT in tumor subpopulations. Each comparison is made using a two‐sided Wilcoxon test. (F) GSVA of MGMT signature using single‐cell data. Each comparison is made using a two‐sided Wilcoxon test. (G) Kaplan–Meier curves showing the probability of OS among patients with high radial glia signature (top 50%) versus low radial glia signature (bottom 50%) in patients from the CGGA cohort. (H) Kaplan–Meier curves showing the probability of OS among patients with high MGMT signature (top 50%) versus low MGMT signature (bottom 50%) in patients from the CGGA cohort.
FIGURE 5 Identification of treatment resistance‐related tumor clusters in glioblastoma. (A) Heat map of differentially expressed genes (based on two‐sided Wilcoxon test) in primary and recurrent GBM. (B) Box plot showing the expression of VEGFA in tumor subpopulations. Each comparison is made using a two‐sided Wilcoxon test. (C) UMAP plot showing the expression of VEGFA in tumor subpopulations. (D) Gene set variation analysis (GSVA) of BBB signature using single‐cell data. Each comparison is made using a two‐sided Wilcoxon test. (E) Violin plots showing the expression of MGMT in tumor subpopulations. Each comparison is made using a two‐sided Wilcoxon test. (F) GSVA of MGMT signature using single‐cell data. Each comparison is made using a two‐sided Wilcoxon test. (G) Kaplan–Meier curves showing the probability of OS among patients with high radial glia signature (top 50%) versus low radial glia signature (bottom 50%) in patients from the CGGA cohort. (H) Kaplan–Meier curves showing the probability of OS among patients with high MGMT signature (top 50%) versus low MGMT signature (bottom 50%) in patients from the CGGA cohort.CC BY-NC-ND · PubMed Central
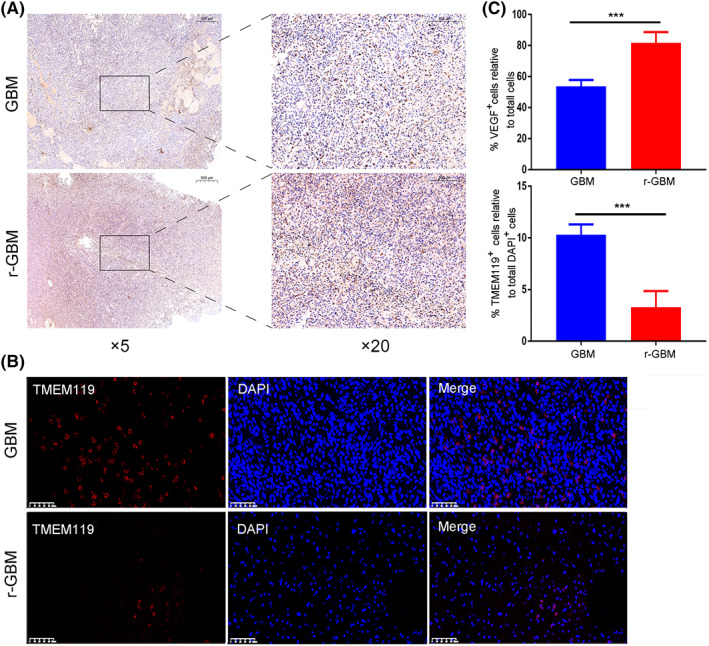
FIGURE 6 The changes of microglial cell number and VEGF protein expression in primary and recurrent GBM. (A) Immunohistochemistry images of VEGF protein expression in GBM and r‐GBM. (B) Immunofluorescence images of TMEM119 + cells and DAPI + in GBM and r‐GBM. (C) Quantitation of VEGF + cell relative to total DAPI + cells and of TMEM119 + cell relative to total DAPI + cells in GBM and r‐GBM (n = 6). Two‐tailed Student's t‐test: ***p < 0.001.
FIGURE 6 The changes of microglial cell number and VEGF protein expression in primary and recurrent GBM. (A) Immunohistochemistry images of VEGF protein expression in GBM and r‐GBM. (B) Immunofluorescence images of TMEM119 + cells and DAPI + in GBM and r‐GBM. (C) Quantitation of VEGF + cell relative to total DAPI + cells and of TMEM119 + cell relative to total DAPI + cells in GBM and r‐GBM (n = 6). Two‐tailed Student's t‐test: ***p < 0.001.CC BY-NC-ND · PubMed Central

Verification

Claims the paper makes

The claims and statistics of this paper haven’t been checked yet.

Run the check — free, no account needed. It reads the open-access text and checks the sources it cites.

A few free checks a day · papers already verified open instantly · results are public

Claims other papers make about this one

Each is checked against this paper’s own text: does it say what the citing paper says it does?

Self-check

Percentages, sums and reported differences re-computed from the paper’s own numbers.

The self-check needs the paper’s full text.

Citations

Cites

Show all 4 references

Research works printed but not linked: 41

  1. 10.1016/j.ccell.2022.02.016 · DOI
  2. 10.1007/s00401-016-1545-1 · DOI
  3. 10.1016/j.biopha.2018.10.063 · DOI
  4. 10.3390/ijms22115775 · DOI
  5. 10.3390/cancers11040469 · DOI
  6. 10.1038/ncomms15080 · DOI
  7. 10.1074/jbc.M115.664037 · DOI
  8. 10.7150/thno.22699 · DOI
  9. 10.1016/j.carbpol.2018.11.091 · DOI
  10. 10.1158/0008-5472.CAN-13-1072 · DOI
  11. 10.1016/j.pharmthera.2021.107922 · DOI
  12. 10.1007/s00401-020-02243-6 · DOI
  13. 10.1038/s41588-021-00926-8 · DOI
  14. 10.1093/bioinformatics/bty560 · DOI · Paper page
  15. Martin MJEJ, 2011, Cut adapt removes adapter sequences from high‐throughput sequencing reads, EMBnet, 17, 17
  16. 10.1093/bioinformatics/btt656 · DOI · Paper page
  17. 10.1038/s41592-019-0619-0 · DOI · Paper page
  18. 10.1089/omi.2011.0118 · DOI · Paper page
  19. EfremovaM Vento‐TormoM TeichmannSA Vento‐TormoR.CellPhoneDB v2.0: Inferring cell‐cell communication from combined expression of multi‐subunit receptor‐ligand complexes.2019. · DOI
  20. 10.1016/j.cell.2017.10.044 · DOI · Paper page
  21. 10.1016/j.drup.2015.02.002 · DOI · Paper page
  22. 10.1016/S1474-4422(18)30468-X · DOI
  23. 10.1158/1078-0432.CCR-17-0764 · DOI
  24. 10.1007/s11864-019-0619-4 · DOI
  25. 10.1038/s41416-020-01136-5 · DOI
  26. 10.1001/jama.2017.18718 · DOI · Paper page
  27. 10.1016/j.soncn.2018.10.001 · DOI
  28. 10.1101/gad.1596707 · DOI · Paper page
  29. 10.1016/j.celrep.2021.109165 · DOI
  30. 10.1093/neuonc/noaa297 · DOI
  31. 10.3389/fneur.2021.755681 · DOI
  32. 10.3390/biom11030403 · DOI
  33. 10.1038/s41467-018-05373-4 · DOI
  34. 10.3934/mbe.2021107 · DOI
  35. 10.1126/sciadv.abl5165 · DOI
  36. 10.1038/s41593-020-00789-y · DOI · Paper page
  37. 10.3389/fimmu.2020.00835 · DOI
  38. 10.1186/s12916-020-01610-0 · DOI
  39. 10.1093/neuonc/nox142 · DOI
  40. 10.1038/s41467-020-17717-0 · DOI
  41. 10.1093/neuonc/nos273 · DOI

Cited by

Sorted by citations

See all 116

Metadata

Authors
Wu, H., Guo, C., Wang, C., Xu, J., Zheng, S., Duan, J., Li, Y., Bai, H., Xu, Q., Ning, F., Wang, F., & Yang, Q.
Venue
Cancer Science
Publisher
Wiley
Published
2023-03-10
Volume
114
Issue
6
Pages
2609-2621
ISSN
  • 1347-9032
  • 1349-7006
Cited by
116
References
4
Language
en
Funders
  • Natural Science Foundation of Guangdong Province (2019A1515010702)
  • Natural Science Foundation of Jiangxi Province (20202BABL206059, 20202BABL216049)

About these checks

Registry, retraction, Cites and statistics results are computed, not judged, with one exception: a printed reference that no index lists is read once by a model before it counts as a citation error. Claims are extracted by a model and kept only when their quote appears verbatim in the text; each cited source is then checked, with a model’s help, for whether it says what the claim relies on. Those verdicts can be wrong — read the claim’s quote and the cited source before relying on one.

Statistics and arithmetic are recomputed, not judged.

Confidence bands are shown only for fields calibrated on our annotated test set. None is calibrated yet, so no band is shown.

What counts as a claim ›How we measure confidence ›How we check this ›

Are you an author, or do you see a problem with this page? Request a review

How to cite

Cite CoChat for the checks on this page, and the paper for its own findings.

This page
CoChat. (2026). Citation check: Single‐cell RNA sequencing reveals tumor heterogeneity, microenvironment, and drug‐resistance mechanisms of recurrent glioblastoma. https://app.cochat.ai/papers/10.1111/cas.15773
The paper
Wu, H., Guo, C., Wang, C., Xu, J., Zheng, S., Duan, J., Li, Y., Bai, H., Xu, Q., Ning, F., Wang, F., & Yang, Q. (2023). Single‐cell RNA sequencing reveals tumor heterogeneity, microenvironment, and drug‐resistance mechanisms of recurrent glioblastoma. Cancer Science. https://doi.org/10.1111/cas.15773