

The DOI matches its Crossref record; 95 of the 95 references it cites were found in a registry or an index.
Groundwater and Remotely Sensed Phenology Reveal Vulnerability of Riparian Trees to Drought
Abstract
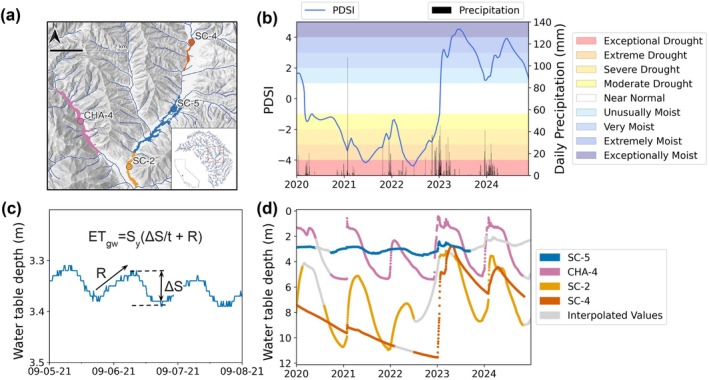
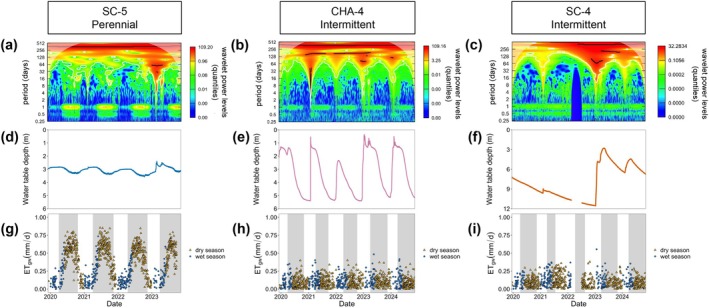
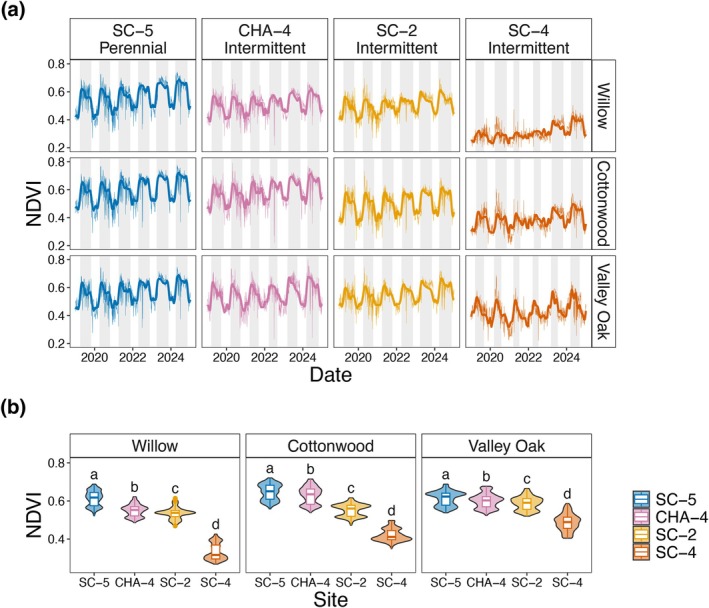
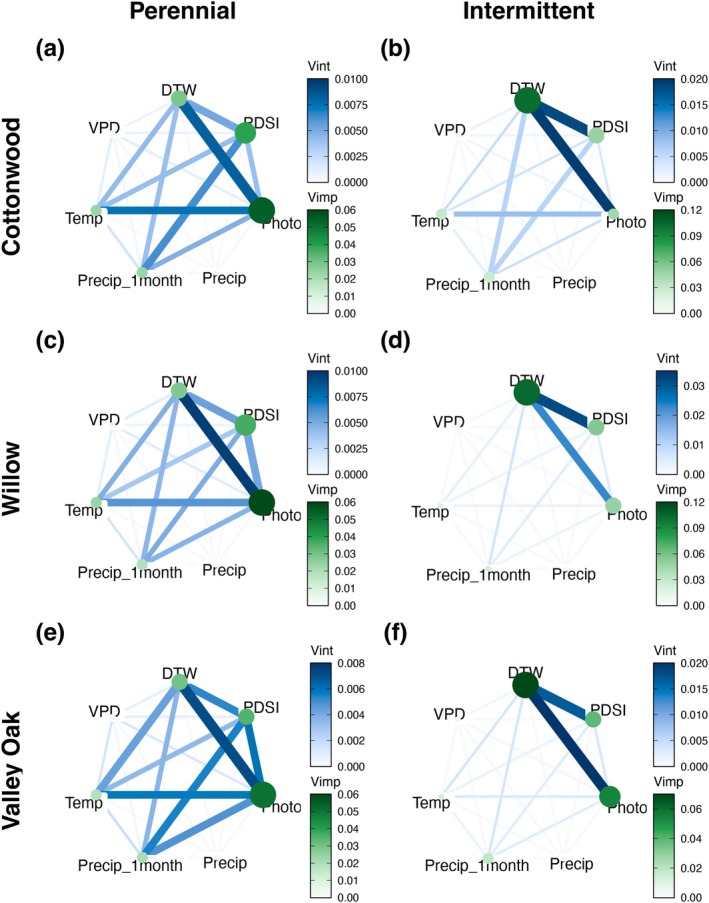
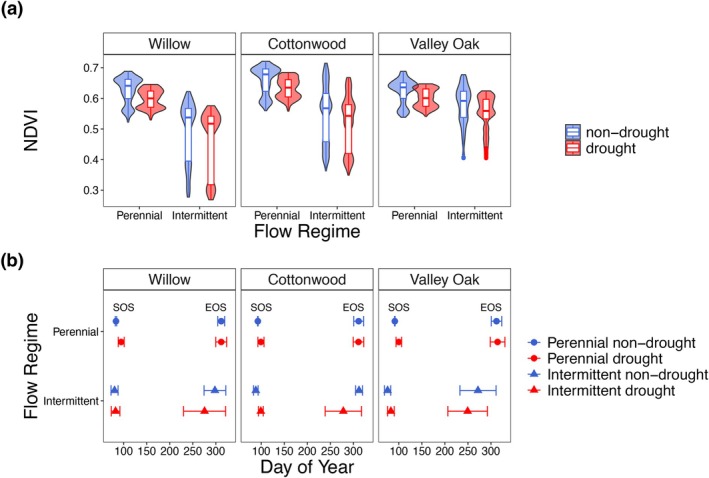
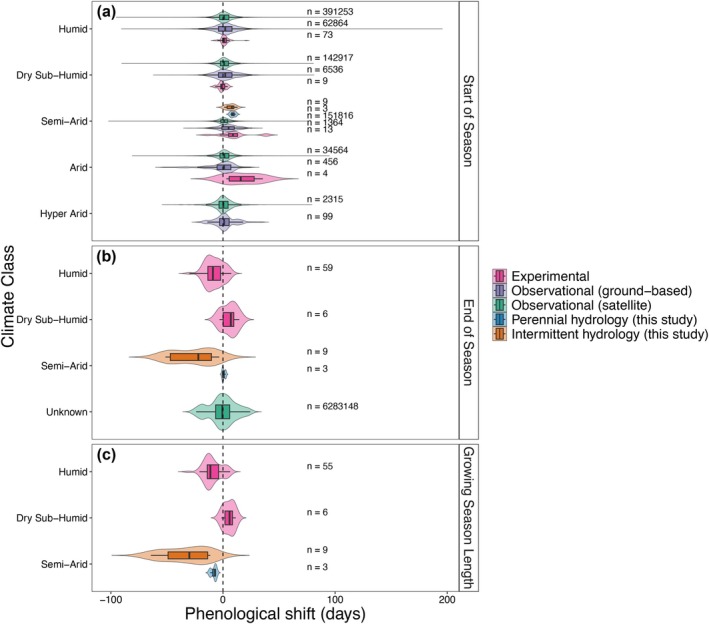
The increasing frequency and magnitude of climatic extremes are altering water availability in dryland ecosystems globally. However, riparian vulnerability to hydroclimate whiplash remains poorly understood. Here, we examined how riparian willow, cottonwood, and valley oak trees respond to groundwater fluctuations and drought through their water use patterns and phenology. To this end, we combined time‐series analysis of in situ, high‐frequency groundwater monitoring with high‐resolution PlanetScope satellite imagery of a drought‐prone and relatively pristine watershed in California (Chalone Creek, Pinnacles National Park). We found that flow regime dictates the potential for trees to access groundwater, while the identity of tree species determines the timing and magnitude of their use. Machine‐learning models revealed that at intermittent sites groundwater depth predominantly controlled vegetation greenness, represented by the Normalized Difference Vegetation Index (NDVI). In contrast, variation in photoperiod length dominated at the perennial site where water was more reliably available. During the severe 2020–2022 drought, all species experienced reduced greenness, but phenological responses differed by flow regime. While the start of the season was delayed across all sites, trees at intermittent reaches exhibited a substantially earlier end of season during drought, resulting in growing seasons shortened by as much as 37 days. These phenological shifts vastly exceed those documented across aridity classifications in global datasets from satellite observations, ground‐based monitoring networks, and experimental precipitation manipulations. Although riparian trees in drylands have been shaped by exposure to drought over evolutionary timescales, our findings show that trees in these intermittent systems may be operating close to critical groundwater thresholds, rendering them particularly vulnerable to increasingly long and severe droughts.
Overview
The claims and statistics of this paper haven’t been checked yet.
Run the check — free, no account needed. It reads the open-access text and checks the sources it cites.
Integrity signals
Registry
Cites
Statistics
Figures
Verification
Claims the paper makes
The claims and statistics of this paper haven’t been checked yet.
Run the check — free, no account needed. It reads the open-access text and checks the sources it cites.
Claims other papers make about this one
Each is checked against this paper’s own text: does it say what the citing paper says it does?
The check wasn’t confident either way, so it gives no verdict — never disputed.
In the citing paper
“Shrub cover remained comparatively stable, ranging from 260 m 2 in August to 290 m 2 in December 35 .”
From AI-driven digital twinning quantifies the trade-off between flood conveyance and riparian stability under climate extremes (2026) · cites this paper as [35]
Experimental — accuracy not yet measured
Self-check
Percentages, sums and reported differences re-computed from the paper’s own numbers.
The self-check needs the paper’s full text.
Citations
Cites
Breiman, L. (2001) · Machine Learning · doi:10.1023/a:1010933404324 · Cited by 133,538
Fitting Linear Mixed-Effects Models Using lme4
Bates, D., Mächler, M., Bolker, B., & Walker, S. (2015) · Journal of Statistical Software · doi:10.18637/jss.v067.i01 · Cited by 86,835
A theory for multiresolution signal decomposition: the wavelet representation
Mallat, S. G. (1989) · IEEE Transactions on Pattern Analysis and Machine Intelligence · doi:10.1109/34.192463 · Cited by 21,372
McDowell, N., Pockman, W. T., Allen, C. D., Breshears, D. D., Cobb, N., Kolb, T., Plaut, J., Sperry, J., West, A., Williams, D. G., et al. (2008) · New Phytologist · doi:10.1111/j.1469-8137.2008.02436.x · Cited by 4,472
ranger: A Fast Implementation of Random Forests for High Dimensional Data in C++ and R
Wright, M. N., & Ziegler, A. (2017) · Journal of Statistical Software · doi:10.18637/jss.v077.i01 · Cited by 3,340
Shifting plant phenology in response to global change
CLELAND, E., CHUINE, I., MENZEL, A., MOONEY, H., & SCHWARTZ, M. (2007) · Trends in Ecology & Evolution · doi:10.1016/j.tree.2007.04.003 · Cited by 2,335
Plant phenology and global climate change: Current progresses and challenges
Piao, S., Liu, Q., Chen, A., Janssens, I. A., Fu, Y., Dai, J., Liu, L., Lian, X., Shen, M., & Zhu, X. (2019) · Global Change Biology · doi:10.1111/gcb.14619 · Cited by 2,120
Development of gridded surface meteorological data for ecological applications and modelling
Abatzoglou, J. T. (2013) · International Journal of Climatology · doi:10.1002/joc.3413 · Cited by 1,916
Maximum rooting depth of vegetation types at the global scale
Canadell, J., Jackson, R. B., Ehleringer, J. B., Mooney, H. A., Sala, O. E., & Schulze, E.-D. (1996) · Oecologia · doi:10.1007/bf00329030 · Cited by 1,888
Adaptation to natural flow regimes
Lytle, D. A., & Poff, N. L. (2004) · Trends in Ecology & Evolution · doi:10.1016/j.tree.2003.10.002 · Cited by 1,759
Research works printed but not linked: 16
- Astronomical Applications Department, 2025, Duration of Daylight/Darkness Table for One Year
- California Department of Water Resources, 2021, Water Year 2021: An Extreme Year
- California Department of Water Resources, 2022, Water Year 2022: The Drought Continues
- 10.1007/s00484‐011‐0494‐6 · DOI
- 10.32614/rj‐2023‐054 · DOI
- Levick L. R., 2008, The Ecological and Hydrological Significance of Ephemeral and Intermittent Streams in the Arid and Semi‐Arid American Southwest
- Liaw A., 2002, Classification and Regression by randomForest, R News, 2, 18
- 10.1111/j.1466‐8238.2006.00247.x · DOI · Paper page
- R Core Team, 2021, R: A Language and Environment for Statistical Computing
- 10.1088/1748‐9326/ac1294 · DOI
- Shafroth P. B., 2000, Woody Riparian Vegetation Response to Different Alluvial Water Table Regimes, Western North American Naturalist, 60, 66
- 10.1175/1520‐0477(1998)079<0061:APGTWA>2.0.CO;2 · doi:10.1175/1520-0477(1998)079
- 10.1111/j.1469‐8137.2007.02275.x · DOI · Paper page
- Verhoef W., 1996, Fourier Analysis of Temporal NDVI in the Southern African and American Continents, Report 108, 19
- White W. N., 1932, A Method of Estimating Ground‐Water Supplies Based on Discharge by Plants and Evaporation From Soil: Results of Investigations in Escalante Valley, Utah
- Zeileis A., 2002, Diagnostic Checking in Regression Relationships, R News, 2, 7
Cited by
Shin, J. H., Go, S. H., & Park, J. H. (2026) · Scientific Reports · doi:10.1038/s41598-026-63704-8
Metadata
- Authors
- Mohammadi, R. M., Dawson, T. E., Tiedeman, C. R., Stella, J. C., & Ruhí, A.
- Affiliations
- Department of Environmental Science, Policy, and Management University of California, Berkeley Berkeley California USA
- Retired Hydrologist Sunnyvale CA USA
- Department of Sustainable Resources Management State University of New York College of Environmental Science and Forestry Syracuse New York USA
- Venue
- Global Change Biology
- Publisher
- Wiley
- Published
- 2025-10
- Volume
- 31
- Issue
- 10
- ISSN
- 1354-1013
- 1365-2486
- PMC
- PMC12555873
- Cited by
- 5
- References
- 95
- Language
- en
- Licence
- creativecommons.org/licenses/by-nc/4.0/ (vor, 26 d)
- doi.wiley.com/10.1002/tdm_license_1.1 (tdm)
- Funders
- Adolph C. and Mary Sprague Miller Institute for Basic Research in Science, University of California Berkeley
- Division of Environmental Biology (DEB‐2047324)
- National Science Foundation Graduate Research Fellowship Program
About these checks
Registry, retraction, Cites and statistics results are computed, not judged, with one exception: a printed reference that no index lists is read once by a model before it counts as a citation error. Claims are extracted by a model and kept only when their quote appears verbatim in the text; each cited source is then checked, with a model’s help, for whether it says what the claim relies on. Those verdicts can be wrong — read the claim’s quote and the cited source before relying on one.
Statistics and arithmetic are recomputed, not judged.
Confidence bands are shown only for fields calibrated on our annotated test set. None is calibrated yet, so no band is shown.
What counts as a claim ›How we measure confidence ›How we check this ›
Are you an author, or do you see a problem with this page? Request a review
How to cite
Cite CoChat for the checks on this page, and the paper for its own findings.
- This page
- CoChat. (2026). Citation check: Groundwater and Remotely Sensed Phenology Reveal Vulnerability of Riparian Trees to Drought. https://app.cochat.ai/papers/10.1111/gcb.70564
- The paper
- Mohammadi, R. M., Dawson, T. E., Tiedeman, C. R., Stella, J. C., & Ruhí, A. (2025). Groundwater and Remotely Sensed Phenology Reveal Vulnerability of Riparian Trees to Drought. Global Change Biology. https://doi.org/10.1111/gcb.70564
Data sources
Bibliographic data: Semantic Scholar, OpenAlex, Crossref.
Contains information from the Semantic Scholar Academic Graph Datasets, made available under the ODC Attribution License (ODC-BY 1.0).
Semantic Scholar’s data is described in: Kinney, R., et al. (2023). The Semantic Scholar Open Data Platform. arXiv:2301.10140.
