Cited by 113Gastrointestinal motility and disordersGut microbiota and healthCardiac Ischemia and Reperfusion

The DOI matches its Crossref record; 42 of the 43 references it cites were found in a registry or an index.

Irisin reverses intestinal epithelial barrier dysfunction during intestinal injury via binding to the integrin αVβ5 receptor

Open access

Abstract

Disruption of the gut barrier results in severe clinical outcomes with no specific treatment. Metabolic disorders and destruction of enterocytes play key roles in gut barrier dysfunction. Irisin is a newly identified exercise hormone that regulates energy metabolism. However, the effect of irisin on gut barrier function remains unknown. The therapeutic effect of irisin on gut barrier dysfunction was evaluated in gut ischemia reperfusion (IR). The direct effect of irisin on gut barrier function was studied in Caco-2 cells. Here, we discovered that serum and gut irisin levels were decreased during gut IR and that treatment with exogenous irisin restored gut barrier function after gut IR in mice. Meanwhile, irisin decreased oxidative stress, calcium influx and endoplasmic reticulum (ER) stress after gut IR. Moreover, irisin protected mitochondrial function and reduced enterocyte apoptosis. The neutralizing antibody against irisin significantly aggravated gut injury, oxidative stress and enterocyte apoptosis after gut IR. Further studies revealed that irisin activated the AMPK-UCP 2 pathway via binding to the integrin αVβ5 receptor. Inhibition of integrin αVβ5, AMPK or UCP 2 abolished the protective role of irisin in gut barrier function. In conclusion, exogenous irisin restores gut barrier function after gut IR via the integrin αVβ5-AMPK-UCP 2 pathway.

Overview

The claims and statistics of this paper haven’t been checked yet.

Run the check — free, no account needed. It reads the open-access text and checks the sources it cites.

A few free checks a day · papers already verified open instantly · results are public

Integrity signals

Registry

Crossref · 10.1111/jcmm.14811

Cites

42 of 42 references verified0 citation errors · 0 not checkable

Statistics

Figures

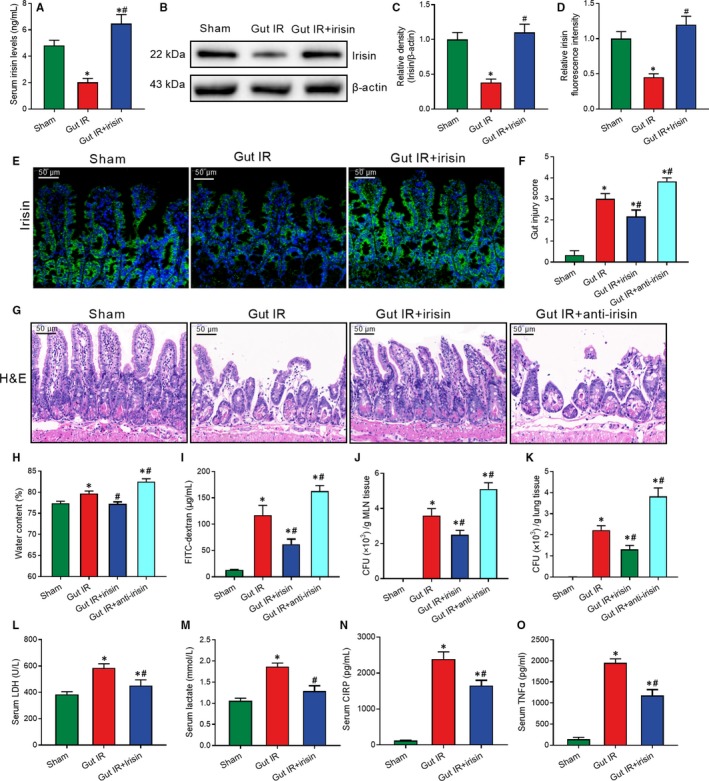
Figure 1 Exogenous irisin restores gut barrier function after gut IR. Irisin (250 μg/kg in 0.5 mL saline, a single dose, iv) was administered immediately after reperfusion. Anti‐irisin (4 mg/kg, Abcam) blocking antibodies were administered at 24 h before gut IR. Four hours after reperfusion, mice were sacrificed, and tissue samples were collected. A, Serum irisin levels; (B,C) Western blot analysis of irisin expression; (D,E) immunofluorescence staining of irisin (green) and the corresponding nuclear counterstaining (blue) in gut tissues; (F) gut injury score; (G) haematoxylin and eosin (H&E) staining; (H) water content of gut; (I) serum FITC‐dextran levels; (J,K) colony‐forming units (CFUs) from mesenteric lymph node (MLN) and lung tissues; (L,M) serum levels of LDH and lactate; and (N,O) serum TNF‐α and CIRP levels. n = 6 per group, mean ± SEM, *P < .05 vs the sham group, # P < .05 vs the gut IR group
Figure 1 Exogenous irisin restores gut barrier function after gut IR. Irisin (250 μg/kg in 0.5 mL saline, a single dose, iv) was administered immediately after reperfusion. Anti‐irisin (4 mg/kg, Abcam) blocking antibodies were administered at 24 h before gut IR. Four hours after reperfusion, mice were sacrificed, and tissue samples were collected. A, Serum irisin levels; (B,C) Western blot analysis of irisin expression; (D,E) immunofluorescence staining of irisin (green) and the corresponding nuclear counterstaining (blue) in gut tissues; (F) gut injury score; (G) haematoxylin and eosin (H&E) staining; (H) water content of gut; (I) serum FITC‐dextran levels; (J,K) colony‐forming units (CFUs) from mesenteric lymph node (MLN) and lung tissues; (L,M) serum levels of LDH and lactate; and (N,O) serum TNF‐α and CIRP levels. n = 6 per group, mean ± SEM, *P < .05 vs the sham group, # P < .05 vs the gut IR groupCC BY · PubMed Central
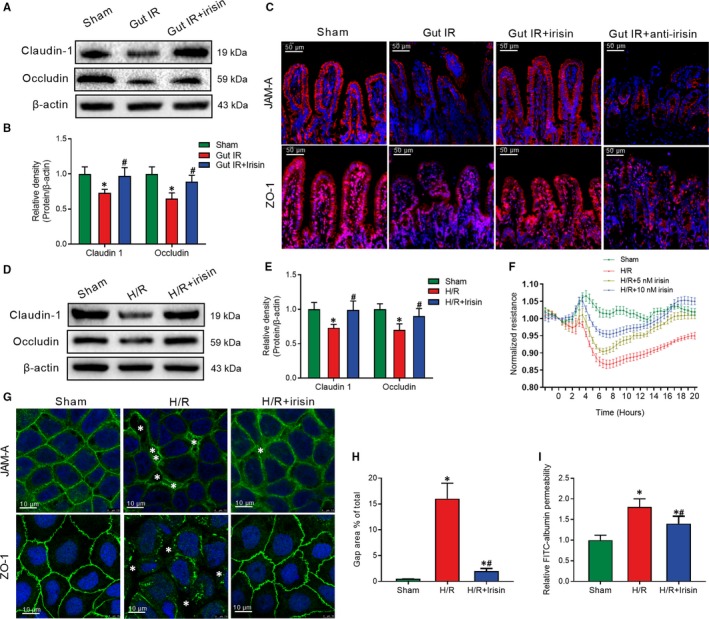
Figure 2 Irisin increases intercellular tight junctions between enterocytes after gut IR. Irisin (250 μg/kg in 0.5 mL saline, a single dose, iv) was administered immediately after reperfusion. Anti‐irisin (4 mg/kg; Abcam) blocking antibodies were administered at 24 h before gut IR. Four hours after reperfusion, mice were sacrificed, and tissue samples were collected. A,B, Western blot analysis of claudin‐1 and occludin expression; (C) immunofluorescence staining of JAM‐1 and ZO‐1 (red) and the corresponding nuclear counterstaining (blue) in gut tissues. n = 6 per group, mean ± SEM, *P < .05 vs the sham group, # P < .05 vs the gut IR group. Caco‐2 cells were exposed to hypoxia for 90 min, and 10 nmol/L irisin was added at the beginning of reoxygenation. (D,E) Western blot analysis of claudin‐1 and occludin expression; (F) transepithelial electrical resistance (TER); (G) immunofluorescence staining of JAM‐1 and ZO‐1 and the corresponding nuclear counterstaining (blue). * in the figure represents intercellular gap; (H) gap area percentage; and (I) relative diffusion of FITC‐labelled albumin at 4 h after reoxygenation in Caco‐2 cells. n = 3 per group, mean ± SEM, *P < .05 vs the sham group, # P < .05 vs the H/R group
Figure 2 Irisin increases intercellular tight junctions between enterocytes after gut IR. Irisin (250 μg/kg in 0.5 mL saline, a single dose, iv) was administered immediately after reperfusion. Anti‐irisin (4 mg/kg; Abcam) blocking antibodies were administered at 24 h before gut IR. Four hours after reperfusion, mice were sacrificed, and tissue samples were collected. A,B, Western blot analysis of claudin‐1 and occludin expression; (C) immunofluorescence staining of JAM‐1 and ZO‐1 (red) and the corresponding nuclear counterstaining (blue) in gut tissues. n = 6 per group, mean ± SEM, *P < .05 vs the sham group, # P < .05 vs the gut IR group. Caco‐2 cells were exposed to hypoxia for 90 min, and 10 nmol/L irisin was added at the beginning of reoxygenation. (D,E) Western blot analysis of claudin‐1 and occludin expression; (F) transepithelial electrical resistance (TER); (G) immunofluorescence staining of JAM‐1 and ZO‐1 and the corresponding nuclear counterstaining (blue). * in the figure represents intercellular gap; (H) gap area percentage; and (I) relative diffusion of FITC‐labelled albumin at 4 h after reoxygenation in Caco‐2 cells. n = 3 per group, mean ± SEM, *P < .05 vs the sham group, # P < .05 vs the H/R groupCC BY · PubMed Central
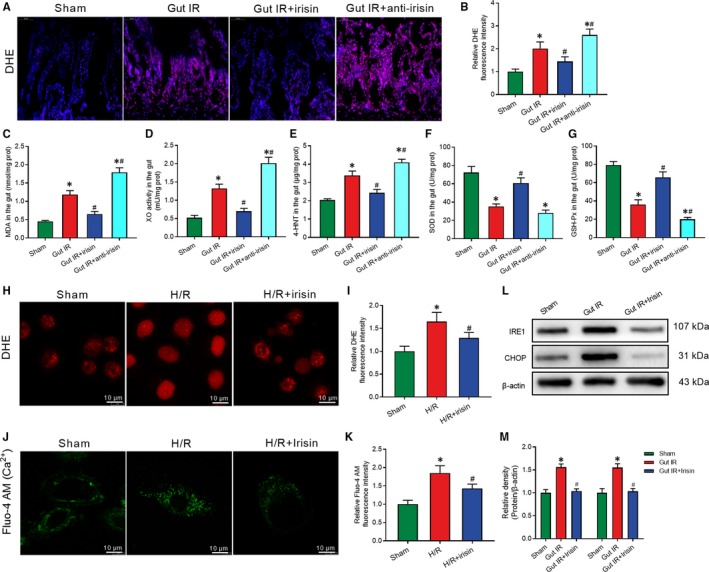
Figure 3 Irisin decreases the oxidative stress, calcium influx and ER stress after gut IR. Irisin (250 μg/kg in 0.5 mL saline, a single dose, iv) was administered immediately after reperfusion. Anti‐irisin (4 mg/kg, Abcam, USA) blocking antibody was administered at 24 h before gut IR. Four hours after reperfusion, mice were sacrificed, and tissue samples were collected. A,B, DHE fluorescence staining of gut tissues; (C‐G) levels of gut malonaldehyde (MDA), xanthine oxidase (XO), 4‐hydroxynonenal (4‐HNT), superoxide dismutase (SOD) and glutathione peroxidase activity (GSH‐PX), respectively; n = 6 per group, mean ± SEM, *P < .05 vs the sham group, # P < .05 vs the gut IR group. Caco‐2 cells were exposed to hypoxia for 90 min, and 10 nmol/L irisin was added at the beginning of reoxygenation. (H,I) DHE fluorescence staining; (J,K) Fluo‐4 AM staining of Ca2+; (L,M) Western blot analysis of IRE1 and CHOP expression at 4 h after reoxygenation in Caco‐2 cells; n = 3 per group, mean ± SEM, *P < .05 vs the sham group, # P < .05 vs the H/R group
Figure 3 Irisin decreases the oxidative stress, calcium influx and ER stress after gut IR. Irisin (250 μg/kg in 0.5 mL saline, a single dose, iv) was administered immediately after reperfusion. Anti‐irisin (4 mg/kg, Abcam, USA) blocking antibody was administered at 24 h before gut IR. Four hours after reperfusion, mice were sacrificed, and tissue samples were collected. A,B, DHE fluorescence staining of gut tissues; (C‐G) levels of gut malonaldehyde (MDA), xanthine oxidase (XO), 4‐hydroxynonenal (4‐HNT), superoxide dismutase (SOD) and glutathione peroxidase activity (GSH‐PX), respectively; n = 6 per group, mean ± SEM, *P < .05 vs the sham group, # P < .05 vs the gut IR group. Caco‐2 cells were exposed to hypoxia for 90 min, and 10 nmol/L irisin was added at the beginning of reoxygenation. (H,I) DHE fluorescence staining; (J,K) Fluo‐4 AM staining of Ca2+; (L,M) Western blot analysis of IRE1 and CHOP expression at 4 h after reoxygenation in Caco‐2 cells; n = 3 per group, mean ± SEM, *P < .05 vs the sham group, # P < .05 vs the H/R groupCC BY · PubMed Central
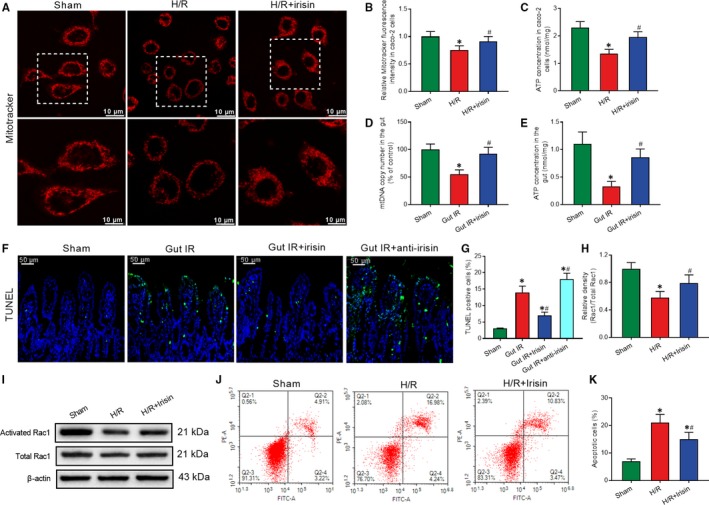
Figure 4 Irisin protects mitochondrial function to increase intercellular tight junctions and reduce enterocyte apoptosis. Caco‐2 cells were exposed to hypoxia for 90 min, and 10 nmol/L irisin was added at the beginning of reoxygenation. A,B, MitoTracker Red fluorescence staining of mitochondria; (C) ATP concentration at 4 h after reoxygenation in Caco‐2 cells; n = 3 per group, mean ± SEM, *P < .05 vs the sham group, # P < .05 vs the H/R group. Irisin (250 μg/kg in 0.5 mL saline, a single dose, iv) was administered immediately after reperfusion. Anti‐irisin (4 mg/kg; Abcam) blocking antibodies were administered at 24 h before gut IR. Four hours after reperfusion, mice were sacrificed, and tissue samples were collected. (D) Gut mtDNA copy numbers; (E) gut ATP concentration; (F,G) TUNEL fluorescence staining (green) and corresponding nuclear counterstaining (blue); n = 6 per group, mean ± SEM, *P < .05 vs the sham group, # P < .05 vs the gut IR group. (H,I) Western blot analysis of activation of Rac1; and (J,K) Flow cytometry analysis of apoptotic cells at 4 h after reoxygenation in Caco‐2 cells; n = 3 per group, mean ± SEM, *P < .05 vs the sham group, # P < .05 vs the H/R group
Figure 4 Irisin protects mitochondrial function to increase intercellular tight junctions and reduce enterocyte apoptosis. Caco‐2 cells were exposed to hypoxia for 90 min, and 10 nmol/L irisin was added at the beginning of reoxygenation. A,B, MitoTracker Red fluorescence staining of mitochondria; (C) ATP concentration at 4 h after reoxygenation in Caco‐2 cells; n = 3 per group, mean ± SEM, *P < .05 vs the sham group, # P < .05 vs the H/R group. Irisin (250 μg/kg in 0.5 mL saline, a single dose, iv) was administered immediately after reperfusion. Anti‐irisin (4 mg/kg; Abcam) blocking antibodies were administered at 24 h before gut IR. Four hours after reperfusion, mice were sacrificed, and tissue samples were collected. (D) Gut mtDNA copy numbers; (E) gut ATP concentration; (F,G) TUNEL fluorescence staining (green) and corresponding nuclear counterstaining (blue); n = 6 per group, mean ± SEM, *P < .05 vs the sham group, # P < .05 vs the gut IR group. (H,I) Western blot analysis of activation of Rac1; and (J,K) Flow cytometry analysis of apoptotic cells at 4 h after reoxygenation in Caco‐2 cells; n = 3 per group, mean ± SEM, *P < .05 vs the sham group, # P < .05 vs the H/R groupCC BY · PubMed Central
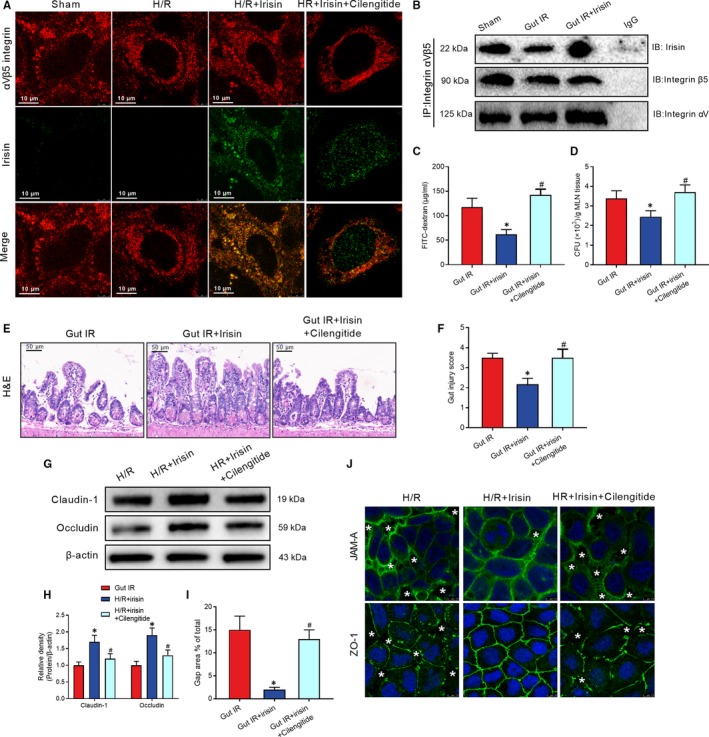
Figure 5 Irisin protects against gut IR injury via binding to integrin αvβ5 receptor in enterocyte. Caco‐2 cells were exposed to hypoxia for 90 min, and 10 nmol/L irisin and 20 μmol/L cilengitide trifluoroacetate were added at the beginning of reoxygenation. A, Immunofluorescence staining of irisin (green), integrin αVβ5 (red) and the corresponding nuclear counterstaining (blue) in Caco‐2 cells at 4 h after reoxygenation in Caco‐2 cells. Irisin (250 μg/kg, iv) and cilengitide trifluoroacetate (20 mg/kg, iv) were administered immediately after reperfusion. Four hours after reperfusion, mice were sacrificed, and tissue samples were collected. (B) CO‐IP of irisin and integrin αVβ5; (C) serum FITC‐dextran levels; (D) colony‐forming units (CFUs) from mesenteric lymph node (MLN) tissues; (E) haematoxylin and eosin (H&E) staining; (F) gut injury score; n = 6 per group, mean ± SEM, *P < .05 vs the gut IR group, # P < .05 vs the gut IR + irisin group. (G,H) Western blot analysis of claudin‐1 and occludin expression in Caco‐2 cells; and (I,J) immunofluorescence staining of JAM‐1 and ZO‐1 and the corresponding nuclear counterstaining (blue). * in the figure represents intercellular gap. n = 3 per group, mean ± SEM, *P < .05 vs the sham group, # P < .05 vs the H/R group
Figure 5 Irisin protects against gut IR injury via binding to integrin αvβ5 receptor in enterocyte. Caco‐2 cells were exposed to hypoxia for 90 min, and 10 nmol/L irisin and 20 μmol/L cilengitide trifluoroacetate were added at the beginning of reoxygenation. A, Immunofluorescence staining of irisin (green), integrin αVβ5 (red) and the corresponding nuclear counterstaining (blue) in Caco‐2 cells at 4 h after reoxygenation in Caco‐2 cells. Irisin (250 μg/kg, iv) and cilengitide trifluoroacetate (20 mg/kg, iv) were administered immediately after reperfusion. Four hours after reperfusion, mice were sacrificed, and tissue samples were collected. (B) CO‐IP of irisin and integrin αVβ5; (C) serum FITC‐dextran levels; (D) colony‐forming units (CFUs) from mesenteric lymph node (MLN) tissues; (E) haematoxylin and eosin (H&E) staining; (F) gut injury score; n = 6 per group, mean ± SEM, *P < .05 vs the gut IR group, # P < .05 vs the gut IR + irisin group. (G,H) Western blot analysis of claudin‐1 and occludin expression in Caco‐2 cells; and (I,J) immunofluorescence staining of JAM‐1 and ZO‐1 and the corresponding nuclear counterstaining (blue). * in the figure represents intercellular gap. n = 3 per group, mean ± SEM, *P < .05 vs the sham group, # P < .05 vs the H/R groupCC BY · PubMed Central
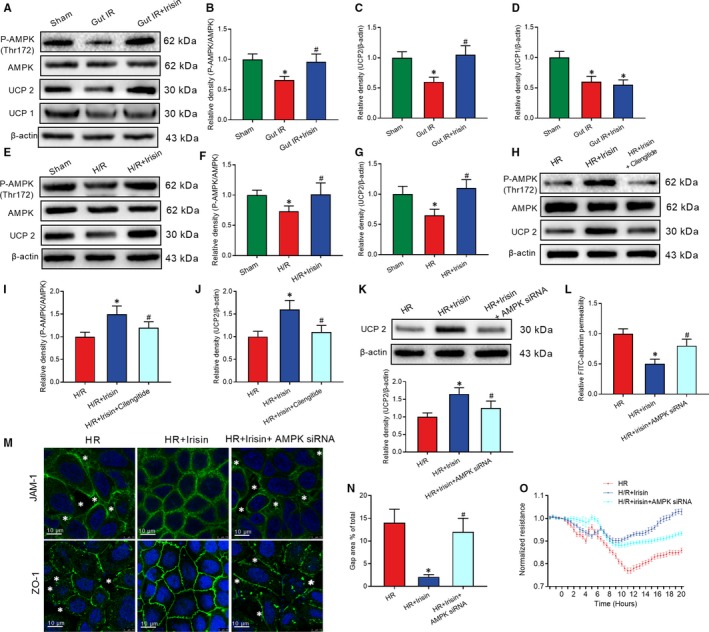
Figure 6 Irisin restores gut barrier function after gut IR by the integrin αVβ5‐AMPK‐UCP 2 pathway. Irisin (250 μg/kg, iv), cilengitide trifluoroacetate (20 mg/kg, iv) or genipin (20 mg/kg, iv) were administered immediately after reperfusion. Four hours after reperfusion, mice were sacrificed, and tissue samples were collected. A‐D, Western blot analysis of the activation of AMPK, UCP 2 and UCP 1 in gut tissues; n = 6 per group, mean ± SEM, *P < .05 vs the sham group, # P < .05 vs the gut IR group. Caco‐2 cells were exposed to hypoxia for 90 min, and 10 nmol/L irisin, 20 μmol/L cilengitide trifluoroacetate and 20 μmol/L geninpin were added at the beginning of reoxygenation. (E‐G) Western blot analysis of the activation of AMPK and UCP 2; n = 3 per group, mean ± SEM, *P < .05 vs the sham group, # P < .05 vs the H/R group; (H‐J) Western blot analysis of the activation of AMPK and UCP 2; (K) Western blot analysis of UCP 2 expression; (L) relative diffusion of FITC‐labelled albumin; (M) immunofluorescence staining of JAM‐1 and ZO‐1 and the corresponding nuclear counterstaining (blue). * in the figure represents intercellular gap; (N) gap area percentage; and (O) transepithelial electrical resistance (TER) at 4 h after reoxygenation in Caco‐2 cells; n = 3 per group, mean ± SEM, *P < .05 vs the H/R group, # P < .05 vs the H/R + irisin group
Figure 6 Irisin restores gut barrier function after gut IR by the integrin αVβ5‐AMPK‐UCP 2 pathway. Irisin (250 μg/kg, iv), cilengitide trifluoroacetate (20 mg/kg, iv) or genipin (20 mg/kg, iv) were administered immediately after reperfusion. Four hours after reperfusion, mice were sacrificed, and tissue samples were collected. A‐D, Western blot analysis of the activation of AMPK, UCP 2 and UCP 1 in gut tissues; n = 6 per group, mean ± SEM, *P < .05 vs the sham group, # P < .05 vs the gut IR group. Caco‐2 cells were exposed to hypoxia for 90 min, and 10 nmol/L irisin, 20 μmol/L cilengitide trifluoroacetate and 20 μmol/L geninpin were added at the beginning of reoxygenation. (E‐G) Western blot analysis of the activation of AMPK and UCP 2; n = 3 per group, mean ± SEM, *P < .05 vs the sham group, # P < .05 vs the H/R group; (H‐J) Western blot analysis of the activation of AMPK and UCP 2; (K) Western blot analysis of UCP 2 expression; (L) relative diffusion of FITC‐labelled albumin; (M) immunofluorescence staining of JAM‐1 and ZO‐1 and the corresponding nuclear counterstaining (blue). * in the figure represents intercellular gap; (N) gap area percentage; and (O) transepithelial electrical resistance (TER) at 4 h after reoxygenation in Caco‐2 cells; n = 3 per group, mean ± SEM, *P < .05 vs the H/R group, # P < .05 vs the H/R + irisin groupCC BY · PubMed Central
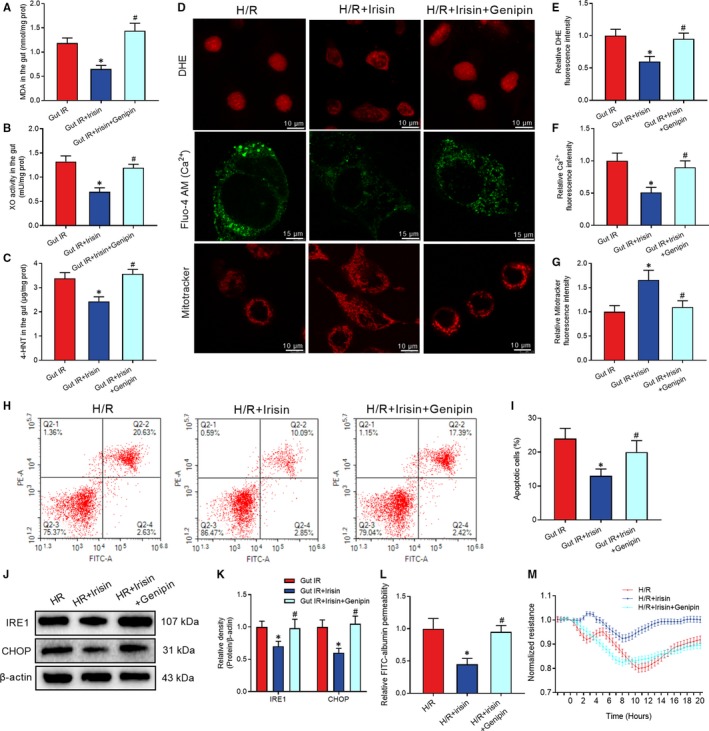
Figure 7 Genipin abolished the protective role of irisin in gut IR. Irisin (250 μg/kg in 0.5 mL saline, a single dose, iv) was administered immediately after reperfusion. Four hours after reperfusion, mice were sacrificed, and tissue samples were collected. A‐C, levels of gut malonaldehyde (MDA), xanthine oxidase (XO) and 4‐hydroxynonenal (4‐HNT), respectively; n = 6 per group, mean ± SEM, *P < .05 vs the gut IR group, # P < .05 vs the gut IR + irisin group. Caco‐2 cells were exposed to hypoxia for 90 min, and 10 nmol/L irisin was added at the beginning of reoxygenation. (D‐G) DHE fluorescence, Fluo‐4 AM and mitotracker staining; (H,I) Flow cytometry analysis of apoptotic cells at 4 h after reoxygenation in Caco‐2 cells; (J,K) Western blot analysis of IRE1 and CHOP in gut tissues; (L) relative diffusion of FITC‐labelled albumin; and (M) transepithelial electrical resistance (TER) at 4 h after reoxygenation in Caco‐2 cells; n = 3 per group, mean ± SEM, *P < .05 vs the H/R group, # P < .05 vs the H/R + irisin group
Figure 7 Genipin abolished the protective role of irisin in gut IR. Irisin (250 μg/kg in 0.5 mL saline, a single dose, iv) was administered immediately after reperfusion. Four hours after reperfusion, mice were sacrificed, and tissue samples were collected. A‐C, levels of gut malonaldehyde (MDA), xanthine oxidase (XO) and 4‐hydroxynonenal (4‐HNT), respectively; n = 6 per group, mean ± SEM, *P < .05 vs the gut IR group, # P < .05 vs the gut IR + irisin group. Caco‐2 cells were exposed to hypoxia for 90 min, and 10 nmol/L irisin was added at the beginning of reoxygenation. (D‐G) DHE fluorescence, Fluo‐4 AM and mitotracker staining; (H,I) Flow cytometry analysis of apoptotic cells at 4 h after reoxygenation in Caco‐2 cells; (J,K) Western blot analysis of IRE1 and CHOP in gut tissues; (L) relative diffusion of FITC‐labelled albumin; and (M) transepithelial electrical resistance (TER) at 4 h after reoxygenation in Caco‐2 cells; n = 3 per group, mean ± SEM, *P < .05 vs the H/R group, # P < .05 vs the H/R + irisin groupCC BY · PubMed Central
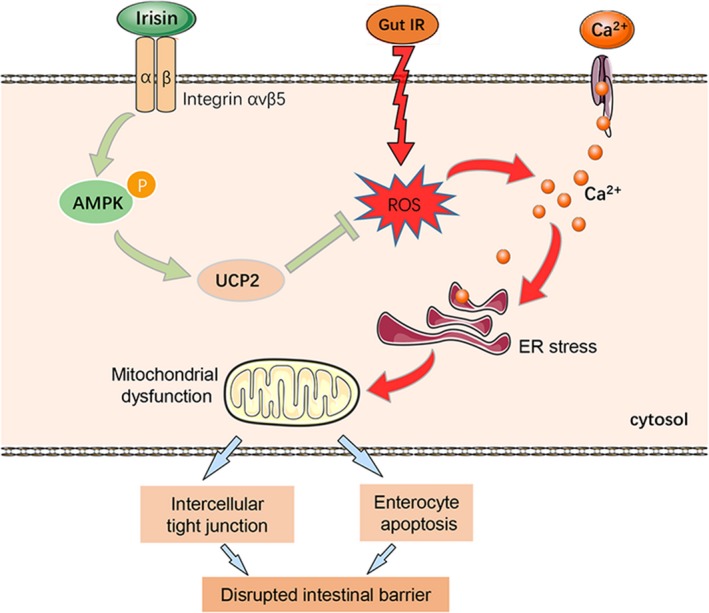
Figure 8 The exercise hormone irisin protects against gut barrier function after gut IR via relieving oxidative stress, calcium influx, ER stress and mitochondrial dysfunction. The potential mechanism is that irisin activates the AMPK‐UCP 2 pathway via binding to integrin αVβ5 receptor in enterocytes
Figure 8 The exercise hormone irisin protects against gut barrier function after gut IR via relieving oxidative stress, calcium influx, ER stress and mitochondrial dysfunction. The potential mechanism is that irisin activates the AMPK‐UCP 2 pathway via binding to integrin αVβ5 receptor in enterocytesCC BY · PubMed Central

Verification

Claims the paper makes

The claims and statistics of this paper haven’t been checked yet.

Run the check — free, no account needed. It reads the open-access text and checks the sources it cites.

A few free checks a day · papers already verified open instantly · results are public

Claims other papers make about this one

Each is checked against this paper’s own text: does it say what the citing paper says it does?

Self-check

Percentages, sums and reported differences re-computed from the paper’s own numbers.

The self-check needs the paper’s full text.

Citations

Cites

Show all 43 references

Cited by

Sorted by citations

Items 101–113 of 113

Metadata

Authors
Bi, J., Zhang, J., Ren, Y., Du, Z., Li, T., Wang, T., Zhang, L., Wang, M., Wu, Z., Lv, Y., & Wu, R.
Affiliations
First Affiliated Hospital of Xi'an Jiaotong University (CN)
Corresponding author
Wu, Rongqian
Venue
Journal of Cellular and Molecular Medicine
Publisher
Wiley
Published
2019-11-07
Volume
24
Issue
1
Pages
996-1009
ISSN
  • 1582-1838 (ISSN-L)
  • 1582-4934
OpenAlex
W2984551404
Cited by
113
References
43
Citations by year
2026: 7 · 2025: 14 · 2024: 15 · 2023: 19 · 2022: 38 · 2021: 14 · 2020: 6
FWCI
13.19
Type
journal article
Language
en
Open access
Locations
  • Journal of Cellular and Molecular Medicine (publishedVersion, cc-by)
  • PubMed Central (publishedVersion, cc-by)
  • PubMed (publishedVersion)
Funders
  • National Nature Science Foundation of China (81770491)
  • Ministry of Education Innovation Team Development Program of China (IRT16R57)
Topics
  • Health Sciences › Medicine › Gastroenterology › Gastrointestinal motility and disorders
  • Life Sciences › Biochemistry, Genetics and Molecular Biology › Molecular Biology › Gut microbiota and health
  • Health Sciences › Medicine › Cardiology and Cardiovascular Medicine › Cardiac Ischemia and Reperfusion
Keywords
irisin, intestinal barrier dysfunction, intestinal ischemia-reperfusion injury, integrin αvβ5, AMPK, UCP2, oxidative stress, endoplasmic reticulum stress, mitochondrial function, enterocyte apoptosis, Caco-2 cells, exercise hormones, energy metabolism
MeSH terms
Animals, Epithelium, Fibronectins, Intestinal Diseases, Intestinal Mucosa, Male, Mice, Inbred C57BL, Mitochondria, Signal Transduction, Reperfusion Injury, Apoptosis, Oxidative Stress, Receptors, Vitronectin, Mice, Endoplasmic Reticulum Stress

About these checks

Registry, retraction, Cites and statistics results are computed, not judged, with one exception: a printed reference that no index lists is read once by a model before it counts as a citation error. Claims are extracted by a model and kept only when their quote appears verbatim in the text; each cited source is then checked, with a model’s help, for whether it says what the claim relies on. Those verdicts can be wrong — read the claim’s quote and the cited source before relying on one.

Statistics and arithmetic are recomputed, not judged.

Confidence bands are shown only for fields calibrated on our annotated test set. None is calibrated yet, so no band is shown.

What counts as a claim ›How we measure confidence ›How we check this ›

Are you an author, or do you see a problem with this page? Request a review