Cited by 42

The DOI matches its Crossref record; 3 of the 3 references it cites were found in a registry or an index.

Exosomal microRNA‐26b‐5p down‐regulates ATF2 to enhance radiosensitivity of lung adenocarcinoma cells

Han, Fushi, Huang, Dongdong, Huang, Xinghong, Wang, Wei, Yang, Shusong, Chen, Shuzhen·2020·Journal of Cellular and Molecular Medicine

Abstract

Lung adenocarcinoma (LUAD), as the most common subtype of non‐small cell lung cancer, is responsible for more than 500 000 deaths worldwide annually. In this study, we identify a novel microRNA‐26b‐5p (miR‐26b‐5p) and elucidated its function on LUAD. The survival rate of parent LUAD cells and radiation‐resistant LUAD cells were determined using clonogenic survival assay. We overexpressed or inhibited miR‐26b‐5p in LUAD, and the correlation between activating transcription factor 2 (ATF2) and miR‐26b‐5p was determined using integrated bioinformatics analysis and dual‐luciferase reporter gene assay. Exosomes derived from A549 cell lines were then detected using Western blot assay, followed by co‐transfection with radiation‐resistant A549R cells. LUAD tissues and serum were collected, followed by miR‐26b‐5p relative expression quantification using RT‐qPCR. miR‐26b‐5p was identified as the most differentially expressed miRNA and was down‐regulated in LUAD. Radiation‐resistant cells were more resistant to X‐radiation compared with parent cells. miR‐26b‐5p overexpression and X‐irradiation led to enhanced radiosensitivity of LUAD cells. ATF2 was negatively targeted by miR‐26b‐5p. Exosomal miR‐26b‐5p derived from A549 cells could be transported to irradiation‐resistant LUAD cells and inhibit ATF2 expression to promote DNA damage, apoptosis and radiosensitivity of LUAD cells, which was verified using serum‐based miR‐26b‐5p. Our results show a regulatory network of miR‐26b‐5p on radiosensitivity of LUAD cells, which may serve as a non‐invasive biomarker for LUAD.

Overview

The claims and statistics of this paper haven’t been checked yet.

Run the check — free, no account needed. It reads the open-access text and checks the sources it cites.

A few free checks a day · papers already verified open instantly · results are public

Integrity signals

Registry

Crossref · 10.1111/jcmm.15402

Cites

3 of 3 references verified0 citation errors · 0 not checkable

Statistics

Figures

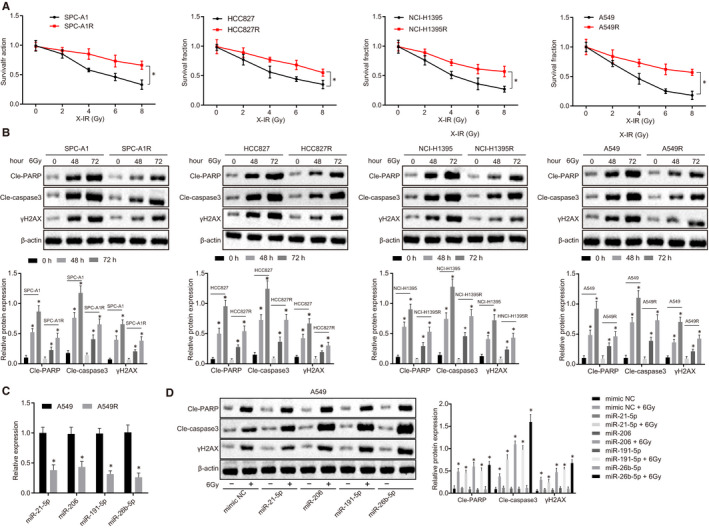
Figure 1 miR‐26b‐5p is down‐regulated in radiation‐resistant LUAD cells. A, Survival rate of cells after radiation using clonogenic survival assay. B, Cleaved‐PARP, Cleaved‐Caspase 3 and γH2AX expression in parental cells and irradiation‐resistant cells normalized to β‐actin determined by Western blot analysis. C, miR‐21‐5p miR‐206, miR‐191‐5p and miR‐26b‐5p expression in A549 and A549R cells determined by RT‐qPCR. D, Effect of miR‐21‐5p miR‐206, miR‐191‐5p and miR‐26‐5p overexpression on Cleaved‐PARP, Cleaved‐Caspase 3 and γH2AX expression in A549 cells normalized to β‐actin compared to mimic‐NC using Western blot analysis. *P < .05; Measurement data were expressed as mean ± standard deviation. Independent sample t test was used to analyse differences between two groups. ANOVA of repeated measurements was used in panel A, followed by Bonferroni's post‐test. Experiments were repeated in triplicates
Figure 1 miR‐26b‐5p is down‐regulated in radiation‐resistant LUAD cells. A, Survival rate of cells after radiation using clonogenic survival assay. B, Cleaved‐PARP, Cleaved‐Caspase 3 and γH2AX expression in parental cells and irradiation‐resistant cells normalized to β‐actin determined by Western blot analysis. C, miR‐21‐5p miR‐206, miR‐191‐5p and miR‐26b‐5p expression in A549 and A549R cells determined by RT‐qPCR. D, Effect of miR‐21‐5p miR‐206, miR‐191‐5p and miR‐26‐5p overexpression on Cleaved‐PARP, Cleaved‐Caspase 3 and γH2AX expression in A549 cells normalized to β‐actin compared to mimic‐NC using Western blot analysis. *P < .05; Measurement data were expressed as mean ± standard deviation. Independent sample t test was used to analyse differences between two groups. ANOVA of repeated measurements was used in panel A, followed by Bonferroni's post‐test. Experiments were repeated in triplicatesCC BY · PubMed Central
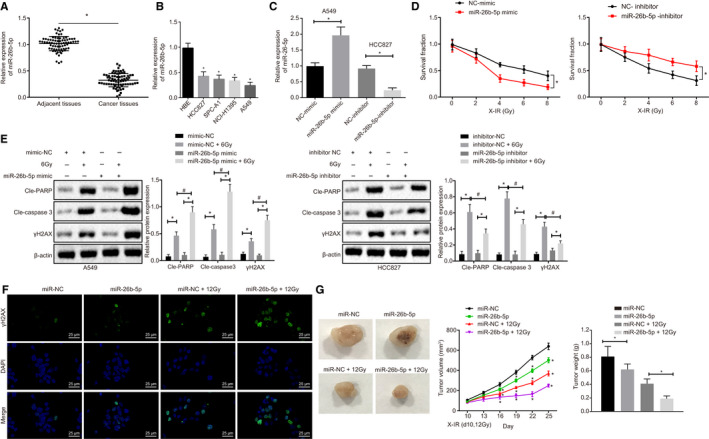
Figure 2 miR‐26b‐5p overexpression enhances radiosensitivity of A549 cells. A, miR‐26b‐5p expression in LUAD tissues and adjacent tissues using RT‐qPCR. B, miR‐26b‐5p expression in SPC‐A1, HCC827, NCI‐H1395 and A549 LUAD cell lines determined by RT‐qPCR. C, miR‐26b‐5p expression in response to miR‐26b‐5p overexpression in A549 cells and miR‐26b‐5p expression in response to miR‐26b‐5p knockdown in HCC827 cells determined by RT‐qPCR. D, Cell proliferation detected by radiation clonogenic survival assay. E, Cleaved‐PARP, Cleaved‐Caspase 3 and γH2AX expression in A549 and HCC827 cell lines normalized to β‐actin using Western blot assay. F, Immunofluorescence assay in γH2AX expression, following miR‐26b‐5p overexpression, bar = 25 µm. G, Overexpression of miR‐26b‐5p in tumour xenografts in nude mice compared with miR‐NC, miR‐NC + 12Gy, miR‐26b‐5p + 12Gy. *&# P < .05; Measurement data were expressed as mean ± standard deviation. Paired/unpaired t test was used to analyse differences between two groups, and differences among multiple groups were analysed by one‐way ANOVA, followed by Tukey's post hoc tests. ANOVA of repeated measurements was used in panel D and G, followed by Bonferroni's post‐test. Cell experiments were repeated in triplets, n = 46 (patients), n = 5 (mice)
Figure 2 miR‐26b‐5p overexpression enhances radiosensitivity of A549 cells. A, miR‐26b‐5p expression in LUAD tissues and adjacent tissues using RT‐qPCR. B, miR‐26b‐5p expression in SPC‐A1, HCC827, NCI‐H1395 and A549 LUAD cell lines determined by RT‐qPCR. C, miR‐26b‐5p expression in response to miR‐26b‐5p overexpression in A549 cells and miR‐26b‐5p expression in response to miR‐26b‐5p knockdown in HCC827 cells determined by RT‐qPCR. D, Cell proliferation detected by radiation clonogenic survival assay. E, Cleaved‐PARP, Cleaved‐Caspase 3 and γH2AX expression in A549 and HCC827 cell lines normalized to β‐actin using Western blot assay. F, Immunofluorescence assay in γH2AX expression, following miR‐26b‐5p overexpression, bar = 25 µm. G, Overexpression of miR‐26b‐5p in tumour xenografts in nude mice compared with miR‐NC, miR‐NC + 12Gy, miR‐26b‐5p + 12Gy. *&# P < .05; Measurement data were expressed as mean ± standard deviation. Paired/unpaired t test was used to analyse differences between two groups, and differences among multiple groups were analysed by one‐way ANOVA, followed by Tukey's post hoc tests. ANOVA of repeated measurements was used in panel D and G, followed by Bonferroni's post‐test. Cell experiments were repeated in triplets, n = 46 (patients), n = 5 (mice)CC BY · PubMed Central
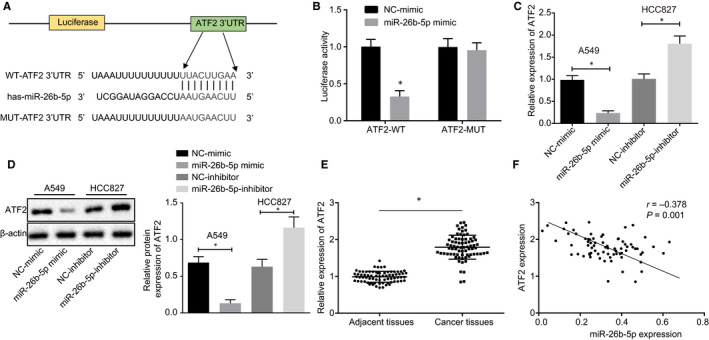
Figure 3 ATF2 is negatively targeted by miR‐26b‐5p. A, The binding sites between ATF2 and miR‐26b‐5p were predicted using TargetScan. B, Specific binding sites between ATF2 and miR‐26b‐5p determined by dual‐luciferase reporter gene assay. C, ATF2 expression in HCC827 and A549 cell lines in response to miR‐26b‐5p mimic and miR‐26b‐5p inhibitor using RT‐qPCR. D, ATF2 protein expression in HCC827 and A549 cell lines normalized to β‐actin in response to miR‐26b‐5p mimic and miR‐26b‐5p inhibitor using Western blot analysis. E, ATF2 expression in LUAD tissues and adjacent tissues determined by RT‐qPCR. F, Correlation analysis between miR‐26b‐5p and ATF2. *&# P < .05; Measurement data were expressed as mean ± standard deviation. Paired/unpaired t test was used to analyse differences between two groups, and Pearson's correlation analysis was adopted in panel F. Cell experiments were repeated in triplets, n = 46 (patients)
Figure 3 ATF2 is negatively targeted by miR‐26b‐5p. A, The binding sites between ATF2 and miR‐26b‐5p were predicted using TargetScan. B, Specific binding sites between ATF2 and miR‐26b‐5p determined by dual‐luciferase reporter gene assay. C, ATF2 expression in HCC827 and A549 cell lines in response to miR‐26b‐5p mimic and miR‐26b‐5p inhibitor using RT‐qPCR. D, ATF2 protein expression in HCC827 and A549 cell lines normalized to β‐actin in response to miR‐26b‐5p mimic and miR‐26b‐5p inhibitor using Western blot analysis. E, ATF2 expression in LUAD tissues and adjacent tissues determined by RT‐qPCR. F, Correlation analysis between miR‐26b‐5p and ATF2. *&# P < .05; Measurement data were expressed as mean ± standard deviation. Paired/unpaired t test was used to analyse differences between two groups, and Pearson's correlation analysis was adopted in panel F. Cell experiments were repeated in triplets, n = 46 (patients)CC BY · PubMed Central
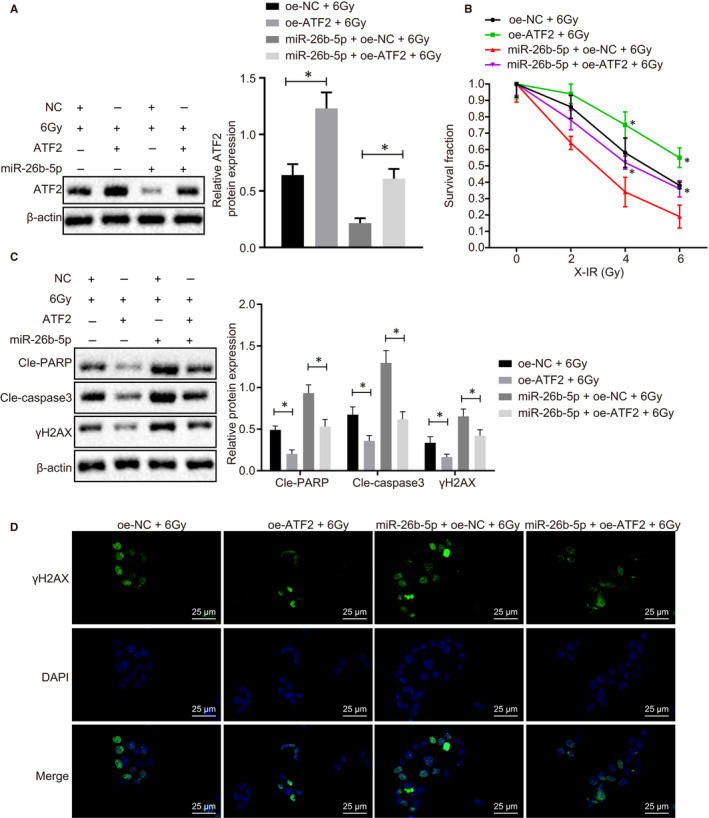
Figure 4 miR‐26b‐5p overexpression induces cell apoptosis and restores radiosensitivity by inhibiting ATF2. A, ATF2 expression in A549 cells normalized to β‐actin in response to oe‐miR‐26b‐5p or oe‐ATF2 determined by Western blot analysis. B, Cell proliferation determined using radiation clonogenic survival assay. C, Cleaved‐PARP, Cleaved‐Caspase 3 and γH2AX expression normalized to β‐actin determined using Western blot analysis. D, Immunofluorescence determination on γH2AX expression following ATF2 overexpression compared with NC, miR‐26b‐5p and miR‐26b‐5p + ATF2 after exposure to 6Gy radiation, bar = 25 µm. *&# P < .05; Measurement data were expressed as mean ± standard deviation. Independent sample t test was used to analyse differences between two groups, and ANOVA of repeated measurements was used in panel B, followed by Bonferroni's post‐test. Experiments were conducted three times independently
Figure 4 miR‐26b‐5p overexpression induces cell apoptosis and restores radiosensitivity by inhibiting ATF2. A, ATF2 expression in A549 cells normalized to β‐actin in response to oe‐miR‐26b‐5p or oe‐ATF2 determined by Western blot analysis. B, Cell proliferation determined using radiation clonogenic survival assay. C, Cleaved‐PARP, Cleaved‐Caspase 3 and γH2AX expression normalized to β‐actin determined using Western blot analysis. D, Immunofluorescence determination on γH2AX expression following ATF2 overexpression compared with NC, miR‐26b‐5p and miR‐26b‐5p + ATF2 after exposure to 6Gy radiation, bar = 25 µm. *&# P < .05; Measurement data were expressed as mean ± standard deviation. Independent sample t test was used to analyse differences between two groups, and ANOVA of repeated measurements was used in panel B, followed by Bonferroni's post‐test. Experiments were conducted three times independentlyCC BY · PubMed Central
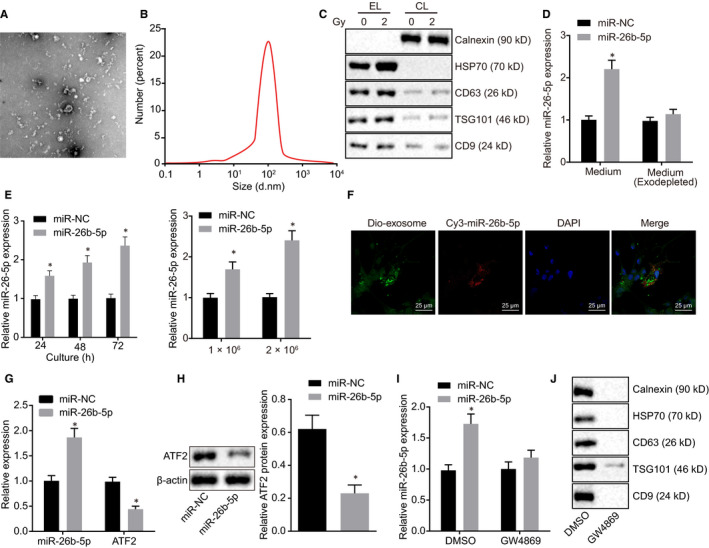
Figure 5 Exosomal miR‐26b‐5p can be transferred in irradiation‐resistant cells. A, Isolated exosomes from A549 observed by transmission electron microscopy. B, Particle size and concentration of exosomes observed using NanoSight N300. C, Western blot determination of protein markers of exosomes in EL and CL. D, RT‐qPCR quantification of miR‐26b‐5p expression in A549 cells in the absence of exosomes. E, miR‐26b‐5p expression at different culture time determined by RT‐qPCR. F, Cellular localization of DIO‐labelled exosomes and Cy3‐labelled miR‐26b‐5p using confocal microscope in A549R cells. G, miR‐26b‐5p and ATF2 expression in A549R cells using RT‐qPCR. H, ATF2 protein expression in A549R cells normalized to β‐actin using Western blot assay. I, miR‐26b‐5p expression in the medium treated with GW4869 or DMSO using RT‐qPCR. J, The exosomal markers detected in A549 cells treated with GW4869 or DMSO using Western blot analysis. *&# P < .05; Measurement data were expressed as mean ± standard deviation. Independent sample t test was used to analyse differences between two groups, and experiments were conducted three times independently. EL: exosome lysates; CL: cell lysates
Figure 5 Exosomal miR‐26b‐5p can be transferred in irradiation‐resistant cells. A, Isolated exosomes from A549 observed by transmission electron microscopy. B, Particle size and concentration of exosomes observed using NanoSight N300. C, Western blot determination of protein markers of exosomes in EL and CL. D, RT‐qPCR quantification of miR‐26b‐5p expression in A549 cells in the absence of exosomes. E, miR‐26b‐5p expression at different culture time determined by RT‐qPCR. F, Cellular localization of DIO‐labelled exosomes and Cy3‐labelled miR‐26b‐5p using confocal microscope in A549R cells. G, miR‐26b‐5p and ATF2 expression in A549R cells using RT‐qPCR. H, ATF2 protein expression in A549R cells normalized to β‐actin using Western blot assay. I, miR‐26b‐5p expression in the medium treated with GW4869 or DMSO using RT‐qPCR. J, The exosomal markers detected in A549 cells treated with GW4869 or DMSO using Western blot analysis. *&# P < .05; Measurement data were expressed as mean ± standard deviation. Independent sample t test was used to analyse differences between two groups, and experiments were conducted three times independently. EL: exosome lysates; CL: cell lysatesCC BY · PubMed Central
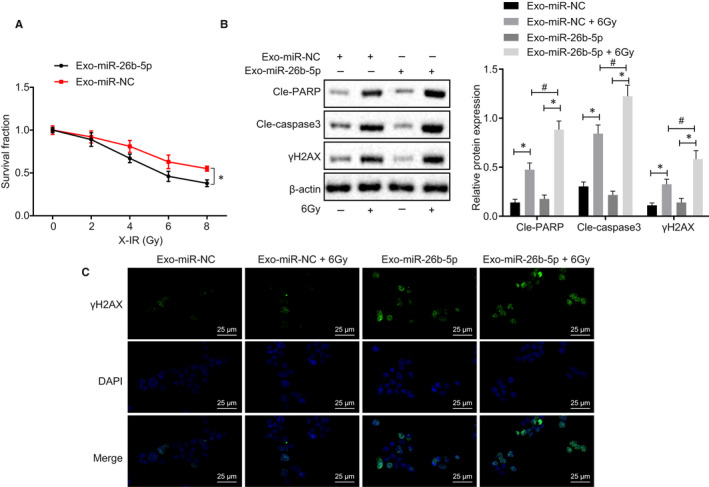
Figure 6 Exosomal miR‐26b‐5p transferred to A549R induces cell apoptosis and restores radiosensitivity. A, Cell proliferation of exo‐miR‐NC and exo‐miR‐26b‐5p determined by radiation clonogenic survival assay. B, Cleaved‐PARP, Cleaved‐Caspase 3 and γH2AX expression normalized to β‐actin in exo‐miR‐NC, 6Gy and exo‐miR‐26b‐5p determined using Western blot assay. C, γH2AX expression in exo‐miR‐NC, exo‐miR‐NC + 6Gy, exo‐miR‐26b‐5p, exo‐miR‐26b‐5p + 6Gy determined by immunofluorescence, bar = 25 µm. *&# P < .05; Measurement data were expressed as mean ± standard deviation. Independent sample t test was used to analyse differences between two groups, and ANOVA of repeated measurements was used in panel A, followed by Bonferroni's post‐test. Experiments were conducted 3 times independently
Figure 6 Exosomal miR‐26b‐5p transferred to A549R induces cell apoptosis and restores radiosensitivity. A, Cell proliferation of exo‐miR‐NC and exo‐miR‐26b‐5p determined by radiation clonogenic survival assay. B, Cleaved‐PARP, Cleaved‐Caspase 3 and γH2AX expression normalized to β‐actin in exo‐miR‐NC, 6Gy and exo‐miR‐26b‐5p determined using Western blot assay. C, γH2AX expression in exo‐miR‐NC, exo‐miR‐NC + 6Gy, exo‐miR‐26b‐5p, exo‐miR‐26b‐5p + 6Gy determined by immunofluorescence, bar = 25 µm. *&# P < .05; Measurement data were expressed as mean ± standard deviation. Independent sample t test was used to analyse differences between two groups, and ANOVA of repeated measurements was used in panel A, followed by Bonferroni's post‐test. Experiments were conducted 3 times independentlyCC BY · PubMed Central
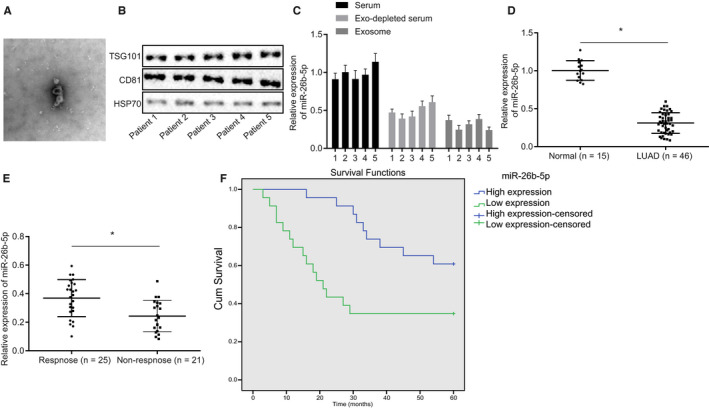
Figure 7 Serum miR‐26b‐5p can serve as a non‐invasive biomarker for LUAD. A, Exosomes isolated from serum of five LUAD patients observed under microscope B, Exosomal markers determined using Western blot analysis. C, miR‐26b‐5p expression in serum and exosomes using RT‐qPCR. D, RT‐qPCR was adopted to measure miR‐26b‐5p expression in LUAD patients (46) and healthy control (15). E, Comparison of miR‐26b‐5p expression between non‐responsive (21) and responsive (25) groups of patient serum samples. F, Survival curve of 46 patients with LUAD with different level of miR‐26b‐5p using Kaplan Meier survival analysis. Measurement data were expressed as mean ± standard deviation. Independent sample t test was used to analyse differences between two groups
Figure 7 Serum miR‐26b‐5p can serve as a non‐invasive biomarker for LUAD. A, Exosomes isolated from serum of five LUAD patients observed under microscope B, Exosomal markers determined using Western blot analysis. C, miR‐26b‐5p expression in serum and exosomes using RT‐qPCR. D, RT‐qPCR was adopted to measure miR‐26b‐5p expression in LUAD patients (46) and healthy control (15). E, Comparison of miR‐26b‐5p expression between non‐responsive (21) and responsive (25) groups of patient serum samples. F, Survival curve of 46 patients with LUAD with different level of miR‐26b‐5p using Kaplan Meier survival analysis. Measurement data were expressed as mean ± standard deviation. Independent sample t test was used to analyse differences between two groupsCC BY · PubMed Central

Verification

Claims the paper makes

The claims and statistics of this paper haven’t been checked yet.

Run the check — free, no account needed. It reads the open-access text and checks the sources it cites.

A few free checks a day · papers already verified open instantly · results are public

Claims other papers make about this one

Each is checked against this paper’s own text: does it say what the citing paper says it does?

Self-check

Percentages, sums and reported differences re-computed from the paper’s own numbers.

The self-check needs the paper’s full text.

Citations

Cites

Show all 3 references

Research works printed but not linked: 39

  1. 10.1038/nature13385 · DOI · Paper page
  2. 10.1093/jnci/djv059 · DOI
  3. 10.1002/cncr.30794 · DOI
  4. 10.1002/ijc.28290 · DOI
  5. 10.18632/oncotarget.6248 · DOI
  6. Hirata H, 2013, Association between egfr‐tki resistance and efficacy of radiotherapy for brain metastases from egfr‐mutant lung adenocarcinoma, Anticancer Res, 33, 1649
  7. 10.1038/nrd3179 · DOI
  8. 10.1038/nm.2284 · DOI
  9. 10.1016/j.cell.2009.03.047 · DOI
  10. 10.1158/1078-0432.CCR-17-0577 · DOI
  11. 10.1038/bjc.2016.179 · DOI
  12. 10.1007/s13277-016-4964-7 · DOI
  13. 10.1016/j.gene.2018.05.008 · DOI
  14. 10.1038/bjc.2015.201 · DOI · Paper page
  15. 10.1159/000487006 · DOI
  16. 10.1038/nrc2681 · DOI
  17. 10.1007/s13277-016-4906-4 · DOI
  18. 10.1126/scisignal.aac6479 · DOI
  19. 10.1158/0008-5472.CAN-04-1433 · DOI
  20. 10.1016/j.mrrev.2015.07.001 · DOI
  21. Steffen JD, 2016, Fluorescent sensors of parp‐1 structural dynamics and allosteric regulation in response to DNA damage, Nucleic Acids Res, 44, 9771
  22. 10.1016/j.dnarep.2018.08.022 · DOI
  23. 10.1136/gutjnl‐2019‐318903 · DOI
  24. 10.1038/s41467-019-14100-6 · DOI
  25. 10.1038/s41388-019-0771-0 · DOI
  26. 10.1038/nrg.2016.134 · DOI
  27. 10.1016/j.eururo.2015.12.054 · DOI
  28. 10.1002/hep.29374 · DOI
  29. 10.1016/j.febslet.2014.04.044 · DOI
  30. 10.3892/ijo.2014.2386 · DOI
  31. 10.1038/cddis.2017.434 · DOI
  32. 10.1667/RR1851.1 · DOI
  33. 10.1371/journal.pone.0023802 · DOI
  34. 10.1038/onc.2015.22 · DOI
  35. 10.1155/2018/5109497 · DOI · Paper page
  36. 10.1016/j.cell.2012.01.016 · DOI
  37. 10.1038/nm.3562 · DOI
  38. 10.1016/j.eururo.2014.07.035 · DOI
  39. 10.1002/cncr.27895 · DOI · Paper page

Cited by

Sorted by citations

Metadata

Authors
Han, F., Huang, D., Huang, X., Wang, W., Yang, S., & Chen, S.
Venue
Journal of Cellular and Molecular Medicine
Publisher
Wiley
Published
2020-05-31
Volume
24
Issue
14
Pages
7730-7742
ISSN
  • 1582-1838
  • 1582-4934
Cited by
42
References
3
Language
en

About these checks

Registry, retraction, Cites and statistics results are computed, not judged, with one exception: a printed reference that no index lists is read once by a model before it counts as a citation error. Claims are extracted by a model and kept only when their quote appears verbatim in the text; each cited source is then checked, with a model’s help, for whether it says what the claim relies on. Those verdicts can be wrong — read the claim’s quote and the cited source before relying on one.

Statistics and arithmetic are recomputed, not judged.

Confidence bands are shown only for fields calibrated on our annotated test set. None is calibrated yet, so no band is shown.

What counts as a claim ›How we measure confidence ›How we check this ›

Are you an author, or do you see a problem with this page? Request a review