

The DOI matches its Crossref record; 18 of the 18 references it cites were found in a registry or an index.
An open source pipeline for quantitative immunohistochemistry image analysis of inflammatory skin disease using artificial intelligence
Open accessAbstract
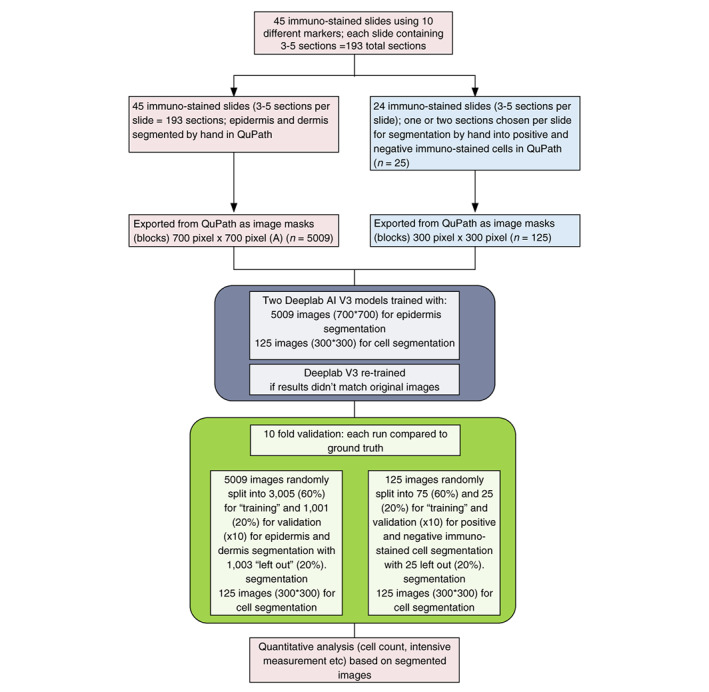
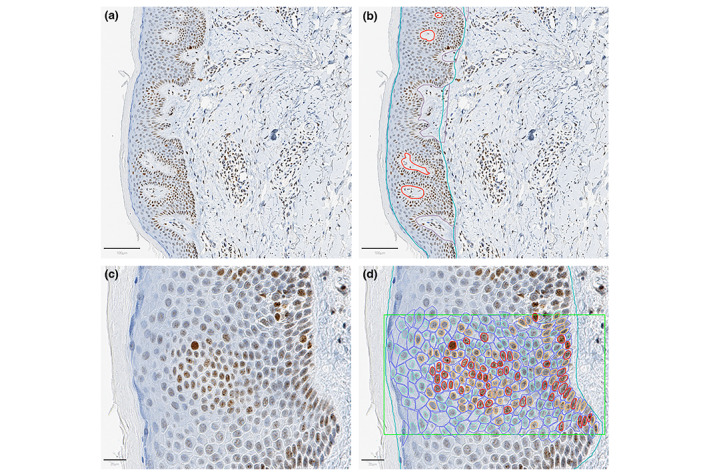
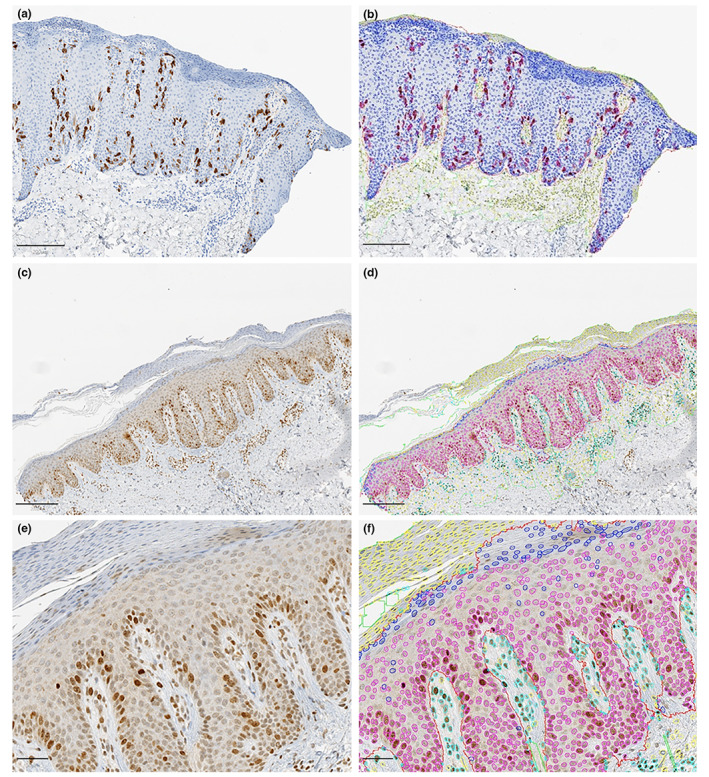
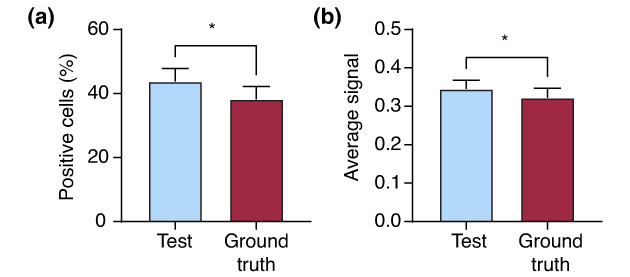
BACKGROUND: The application of artificial intelligence (AI) to whole slide images has the potential to improve research reliability and ultimately diagnostic efficiency and service capacity. Image annotation plays a key role in AI and digital pathology. However, the work-streams required for tissue-specific (skin) and immunostain-specific annotation has not been extensively studied compared with the development of AI algorithms. OBJECTIVES: The objective of this study is to develop a common workflow for annotating whole slide images of biopsies from inflammatory skin disease immunostained with a variety of epidermal and dermal markers prior to the development of the AI-assisted analysis pipeline. METHODS: A total of 45 slides containing 3-5 sections each were scanned using Aperio AT2 slide scanner (Leica Biosystems). These slides were annotated by hand using a commonly used image analysis tool which resulted in more than 4000 images blocks. We used deep learning (DL) methodology to first sequentially segment (epidermis and upper dermis), with the exclusion of common artefacts and second to quantify the immunostained signal in those two compartments of skin biopsies and the ratio of positive cells. RESULTS: We validated two DL models using 10-fold validation runs and by comparing to ground truth manually annotated data. The models achieved an average (global) accuracy of 95.0% for the segmentation of epidermis and dermis and 86.1% for the segmentation of positive/negative cells. CONCLUSIONS: The application of two DL models in sequence facilitates accurate segmentation of epidermal and dermal structures, exclusion of common artefacts and enables the quantitative analysis of the immunostained signal. However, inaccurate annotation of the slides for training the DL model can decrease the accuracy of the output. Our open source code will facilitate further external validation across different immunostaining platforms and slide scanners.
Overview
The claims and statistics of this paper haven’t been checked yet.
Run the check — free, no account needed. It reads the open-access text and checks the sources it cites.
Integrity signals
Registry
Cites
Statistics
Figures
Verification
Claims the paper makes
The claims and statistics of this paper haven’t been checked yet.
Run the check — free, no account needed. It reads the open-access text and checks the sources it cites.
Claims other papers make about this one
Each is checked against this paper’s own text: does it say what the citing paper says it does?
The source backs part of the claim, not all of it — or backs it for a different population, condition or comparison.
In the citing paper
“The results proved that the AI-assisted model is effective in achieving the aim, and not inferior to traditional evaluation via microscopy.”
From Artificial Intelligence in the Histopathological Assessment of Non-Neoplastic Skin Disorders: A Narrative Review with Future Perspectives (2025) · cites this paper as [35]
Experimental — accuracy not yet measuredThe cited source says what the claim attributes to it.
In the citing paper
“Therefore, it can be applied in research settings to provide a reliable and time-effective immunohistochemical evaluation of inflammatory skin diseases for a deep understanding of dermatitis.”
From Artificial Intelligence in the Histopathological Assessment of Non-Neoplastic Skin Disorders: A Narrative Review with Future Perspectives (2025) · cites this paper as [35]
Self-check
Percentages, sums and reported differences re-computed from the paper’s own numbers.
The self-check needs the paper’s full text.
Citations
Cites
Encoder-Decoder with Atrous Separable Convolution for Semantic Image Segmentation
Chen, L.-C., Zhu, Y., Papandreou, G., Schroff, F., & Adam, H. (2018) · Lecture Notes in Computer Science · doi:10.1007/978-3-030-01234-2_49 · Cited by 20,054
SegNet: A Deep Convolutional Encoder-Decoder Architecture for Image Segmentation
Badrinarayanan, V., Kendall, A., & Cipolla, R. (2017) · IEEE Transactions on Pattern Analysis and Machine Intelligence · doi:10.1109/tpami.2016.2644615 · Cited by 19,631
QuPath: Open source software for digital pathology image analysis
Bankhead, P., Loughrey, M. B., Fernández, J. A., Dombrowski, Y., McArt, D. G., Dunne, P. D., McQuaid, S., Gray, R. T., Murray, L. J., Coleman, H. G., et al. (2017) · Scientific Reports · doi:10.1038/s41598-017-17204-5 · Cited by 8,908
A method for normalizing histology slides for quantitative analysis
Macenko, M., Niethammer, M., Marron, J. S., Borland, D., Woosley, J. T., Guan, X., Schmitt, C., & Thomas, N. E. (2009) · 2009 IEEE International Symposium on Biomedical Imaging: From Nano to Macro · doi:10.1109/isbi.2009.5193250 · Cited by 1,482
Semantic object classes in video: A high-definition ground truth database
Brostow, G., Fauqueur, J., & Cipolla, R. (2008) · Pattern Recognition Letters · doi:10.1016/j.patrec.2008.04.005 · Cited by 1,426
What is a good evaluation measure for semantic segmentation?
Csurka, G., Larlus, D., & Perronnin, F. (2013) · British Machine Vision Conference (BMVC) · doi:10.5244/c.27.32 · Cited by 536
Mukhopadhyay, S., Feldman, M. D., Abels, E., Ashfaq, R., Beltaifa, S., Cacciabeve, N. G., Cathro, H. P., Cheng, L., Cooper, K., Dickey, G. E., et al. (2018) · American Journal of Surgical Pathology · doi:10.1097/pas.0000000000000948 · Cited by 399
Critical Comparison of 31 Commercially Available Digital Slide Systems in Pathology
Rojo, M. G., García, G. B., Mateos, C. P., et al. (2006) · International Journal of Surgical Pathology · doi:10.1177/1066896906292274 · Cited by 228
Learning to detect lymphocytes in immunohistochemistry with deep learning
Świderska-Chadaj, Ż., Pinckaers, H., van Rijthoven, M., Balkenhol, M. C. A., Melnikova, M., Geessink, O. G. F., Manson, Q. F., Sherman, M. E., Polónia, A., Parry, J., et al. (2019) · Medical Image Analysis · doi:10.1016/j.media.2019.101547 · Cited by 159
Jiang, Y., Xie, J., Han, Z., Liu, W., Xi, S., Huang, L., Huang, W., Lin, T., Zhao, L., Hu, Y., et al. (2018) · Clinical Cancer Research · doi:10.1158/1078-0432.ccr-18-0848 · Cited by 143
Cited by
Sorted by citations
Della Mura, M., Sorino, J., Colagrande, A., Daruish, M., Ingravallo, G., Massaro, A., Cazzato, G., Lupo, C., Casatta, N., Ribatti, D., et al. (2025) · Medical Sciences · doi:10.3390/medsci13020070 · Cited by 6
“Moreover, it could possibly be introduced in clinical practice in the coming future as new biomarkers emerge in clinical applications in the field of precision medicine [35].”
Metadata
- Authors
- Ding, Y., Dhawan, G., Jones, C., Ness, T., Nichols, E., Krasnogor, N., & Reynolds, N. J.
- Affiliations
- Newcastle University (GB)
- Royal Victoria Infirmary (GB)
- Engineering and Physical Sciences Research Council (GB)
- Corresponding author
- Ding, Yuchun
- Reynolds, Nick J.
- Venue
- Journal of the European Academy of Dermatology and Venereology
- Publisher
- Wiley
- Published
- 2022-12-03
- Volume
- 37
- Issue
- 3
- Pages
- 605-614
- ISSN
- 0926-9959 (ISSN-L)
- 1468-3083
- PMC
- PMC10947200
- OpenAlex
- W4308772283
- Cited by
- 9
- References
- 18
- Citations by year
- 2026: 2 · 2025: 4 · 2024: 1 · 2023: 1 · 2022: 1
- FWCI
- 0.58
- Type
- journal article
- Language
- en
- Open access
- hybrid
- doi.org
- Locations
- Journal of the European Academy of Dermatology and Venereology (publishedVersion, cc-by)
- PubMed Central (publishedVersion, cc-by)
- PubMed (publishedVersion)
- Newcastle University ePrints (Newcastle Univesity) (cc-by)
- Funders
- Medical Research Council Canada (MC_PC_17168, MR/N005872/1)
- Topics
- Physical Sciences › Computer Science › Artificial Intelligence › AI in cancer detection
- Life Sciences › Biochemistry, Genetics and Molecular Biology › Biophysics › Cell Image Analysis Techniques
- Health Sciences › Medicine › Health Informatics › Artificial Intelligence in Healthcare and Education
- Keywords
- immunohistochemistry image analysis, inflammatory skin diseases, deep learning, skin biopsy, digital pathology
- MeSH terms
- Artificial Intelligence, Humans, Immunohistochemistry, Skin Diseases, Software, Reproducibility of Results
About these checks
Registry, retraction, Cites and statistics results are computed, not judged, with one exception: a printed reference that no index lists is read once by a model before it counts as a citation error. Claims are extracted by a model and kept only when their quote appears verbatim in the text; each cited source is then checked, with a model’s help, for whether it says what the claim relies on. Those verdicts can be wrong — read the claim’s quote and the cited source before relying on one.
Statistics and arithmetic are recomputed, not judged.
Confidence bands are shown only for fields calibrated on our annotated test set. None is calibrated yet, so no band is shown.
What counts as a claim ›How we measure confidence ›How we check this ›
Are you an author, or do you see a problem with this page? Request a review
