

The DOI matches its Crossref record; 98 of the 98 references it cites were found in a registry or an index.
A mechanical signal transmitted by the flagellum controls signalling in Bacillus subtilis
Open accessAbstract
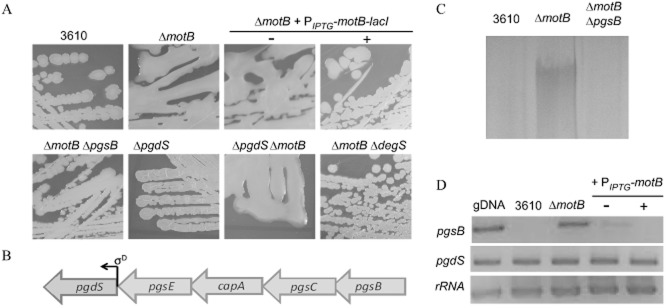
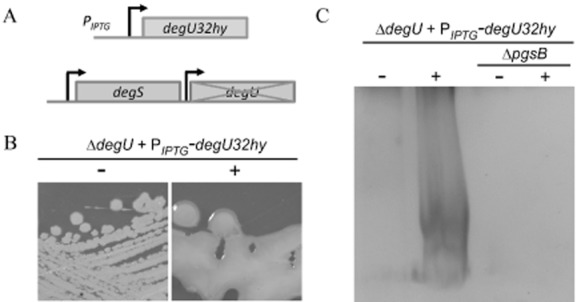
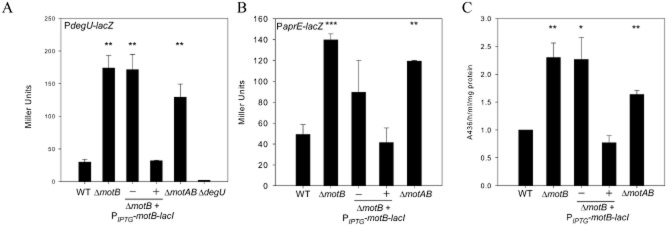
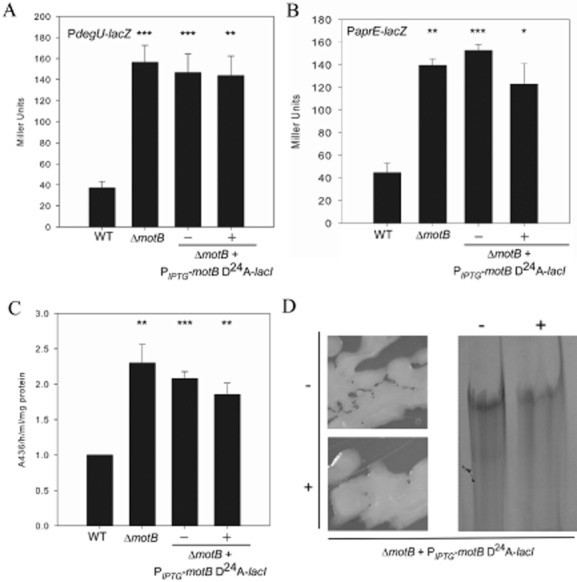
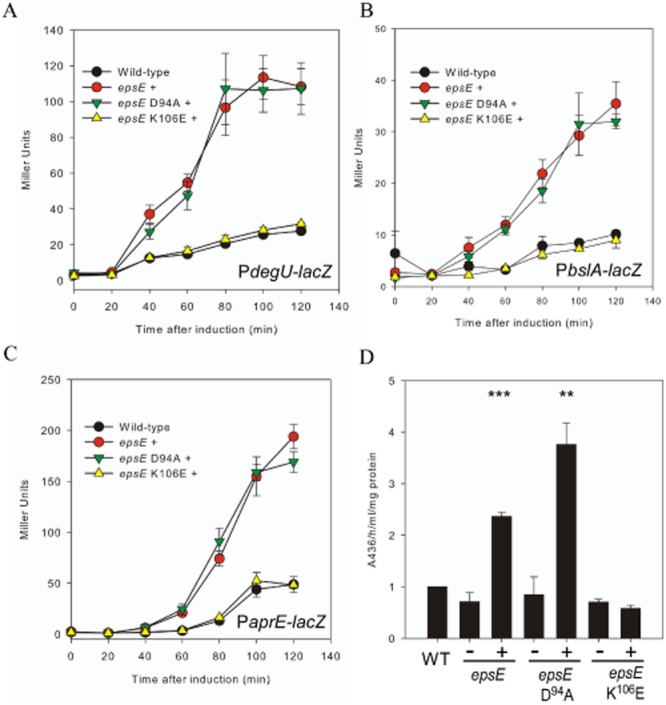
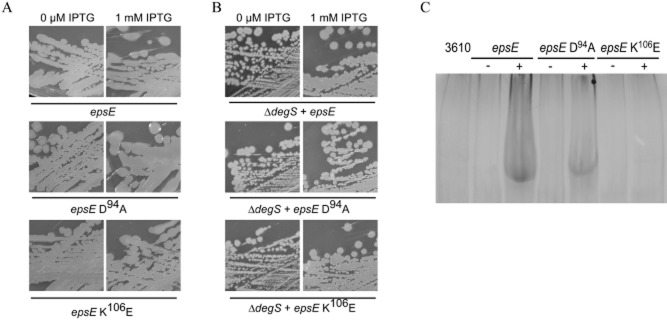
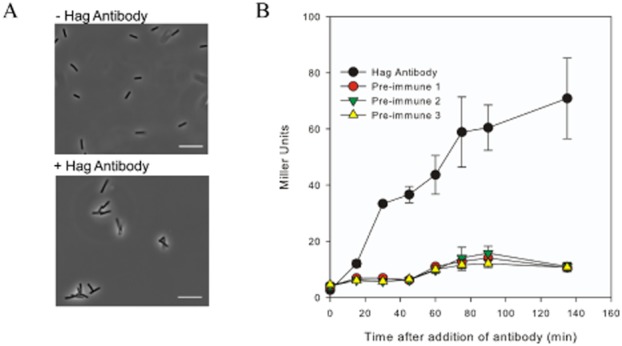
Summary: In the natural environment bacteria predominantly live adhered to a surface as part of a biofilm. While many of the components needed for biofilm assembly are known, the mechanism by which microbes sense and respond to contact with a surface is poorly understood. B acillus subtilis is a G ram‐positive model for biofilm formation. The DegS – DegU two‐component system controls several multicellular behaviours in B . subtilis , including biofilm formation. Here we identify the B . subtilis flagellum as a mechanosensor that activates the DegS – DegU regulatory pathway. Inhibition of flagellar rotation by deletion or mutation of the flagellar stator gene, motB , results in an increase in both degU transcription and DegU ∼ P driven processes, namely exoprotease production and poly‐γ‐ dl ‐glutamic acid biosynthesis. Similarly, inhibition of flagellar rotation by engaging the flagellar clutch or by tethering the flagella with antibodies also promotes an increase in degU transcription that is reflective of increased DegU ∼ P levels in the cell. Collectively, these findings strongly indicate that inhibition of flagellar rotation acts as a mechanical trigger to activate the DegS – DegU two‐component signal transduction system. We postulate that inhibition of flagellar rotation could function as a mechanical trigger to activate bacterial signal transduction cascades in many motile bacteria upon contact with a surface.
Overview
The claims and statistics of this paper haven’t been checked yet.
Run the check — free, no account needed. It reads the open-access text and checks the sources it cites.
Integrity signals
Registry
Cites
Statistics
Figures
Verification
Claims the paper makes
The claims and statistics of this paper haven’t been checked yet.
Run the check — free, no account needed. It reads the open-access text and checks the sources it cites.
Claims other papers make about this one
Each is checked against this paper’s own text: does it say what the citing paper says it does?
In the citing paper
“The top-ranked module for the CMDs and liver cirrhosis was the ACVD-microbiome depleted DegS-DegU two component system, which can trigger biofilm formation in response to impeded flagellar rotation49.”
From The gut microbiome in atherosclerotic cardiovascular disease (2017) · cites this paper as [49]
Self-check
Percentages, sums and reported differences re-computed from the paper’s own numbers.
The self-check needs the paper’s full text.
Citations
Cites
Experiments in molecular genetics
Miller, J. H. (1972) · Medical Entomology and Zoology · Cited by 27,157
Flemming, H.-C., & Wingender, J. (2010) · Nature Reviews Microbiology · doi:10.1038/nrmicro2415 · Cited by 10,137
Vieira, J., & Messing, J. W. (1982) · Gene · doi:10.1016/0378-1119(82)90015-4 · Cited by 5,984
Costerton, J. W., Lewandowski, Z., Caldwell, D. E., Korber, D. R., & Lappin-Scott, H. M. (1995) · Annual Review of Microbiology · doi:10.1146/annurev.mi.49.100195.003431 · Cited by 4,921
Biofilm formation as microbial development
O'Toole, G., Kaplan, H. B., & Kolter, R. (2000) · Annual Review of Microbiology · doi:10.1146/annurev.micro.54.1.49 · Cited by 3,571
Flagellar and twitching motility are necessary for Pseudomonas aeruginosa biofilm development
O'Toole, G. A., & Kolter, R. (1998) · Molecular Microbiology · doi:10.1046/j.1365-2958.1998.01062.x · Cited by 2,697
Pratt, L. A., & Kolter, R. (1998) · Molecular Microbiology · doi:10.1046/j.1365-2958.1998.01061.x · Cited by 1,641
Watnick, P. I., & Kolter, R. (2000) · Journal of Bacteriology · doi:10.1128/jb.182.10.2675-2679.2000 · Cited by 1,434
Fruiting body formation by Bacillus subtilis
Branda, S. S., González-Pastor, J. E., Ben-Yehuda, S., Losick, R., & Kolter, R. (2001) · Proceedings of the National Academy of Sciences · doi:10.1073/pnas.191384198 · Cited by 1,129
Sticking together: building a biofilm the Bacillus subtilis way
Vlamakis, H. C., Chai, Y., Beauregard, P. B., Losick, R. M., & Kolter, R. (2013) · Nature Reviews Microbiology · doi:10.1038/nrmicro2960 · Cited by 1,080
Research works printed but not linked: 1
- 10.1073/pnas.130639110 · DOI
Cited by
Sorted by citations
The gut microbiome in atherosclerotic cardiovascular disease
Jie, Z., Xia, H., Zhong, S.-L., Feng, Q., Li, S., Liang, S., Zhong, H., Liu, Z., Gao, Y., Zhao, H., et al. (2017) · Nature Communications · doi:10.1038/s41467-017-00900-1 · Cited by 1,638
Biofilms, flagella, and mechanosensing of surfaces by bacteria
Belas, R. (2014) · Trends in Microbiology · doi:10.1016/j.tim.2014.05.002 · Cited by 388
Mechanomicrobiology: how bacteria sense and respond to forces
Dufrêne, Y. F., & Persat, A. (2020) · Nature Reviews Microbiology · doi:10.1038/s41579-019-0314-2 · Cited by 319
Type III secretion systems: the bacterial flagellum and the injectisome
Diepold, A., & Armitage, J. P. (2015) · Philosophical Transactions of the Royal Society B Biological Sciences · doi:10.1098/rstb.2015.0020 · Cited by 242
Cairns, L. S., Hobley, L., & Stanley‐Wall, N. R. (2014) · Molecular Microbiology · doi:10.1111/mmi.12697 · Cited by 242
Self-citationChemotaxis towards autoinducer 2 mediates autoaggregation in Escherichia coli
Laganenka, L., Colin, R., & Sourjik, V. (2016) · Nature Communications · doi:10.1038/ncomms12984 · Cited by 218
Sensational biofilms: surface sensing in bacteria
O’Toole, G. A., & Wong, G. C. L. (2016) · Current Opinion in Microbiology · doi:10.1016/j.mib.2016.02.004 · Cited by 188
Molecular mechanisms involved in B acillus subtilis biofilm formation
Mielich‐Süss, B., & López, D. (2014) · Environmental Microbiology · doi:10.1111/1462-2920.12527 · Cited by 200
How bacteria recognise and respond to surface contact
Kimkes, T. E. P., & Heinemann, M. (2019) · FEMS Microbiology Reviews · doi:10.1093/femsre/fuz029 · Cited by 183
The Structure and Regulation of Flagella in Bacillus subtilis
Mukherjee, S., & Kearns, D. B. (2014) · Annual Review of Genetics · doi:10.1146/annurev-genet-120213-092406 · Cited by 173
Dynamic cell–matrix interactions modulate microbial biofilm and tissue 3D microenvironments
Koo, H., & Yamada, K. M. (2016) · Current Opinion in Cell Biology · doi:10.1016/j.ceb.2016.05.005 · Cited by 143
Against the tide: the role of bacterial adhesion in host colonization
Stones, D. H., & Krachler, A. M. (2016) · Biochemical Society Transactions · doi:10.1042/bst20160186 · Cited by 136
Hölscher, T., Bartels, B., Lin, Y.-C., Gallegos‐Monterrosa, R., Price‐Whelan, A., Kolter, R., Dietrich, L. E. P., & Kovács, Á. T. (2015) · Journal of Molecular Biology · doi:10.1016/j.jmb.2015.06.014 · Cited by 139
Alsharif, G. S., Ahmad, S., Islam, M. S., Shah, R., Busby, S. J. W., & Krachler, A. M. (2015) · Proceedings of the National Academy of Sciences · doi:10.1073/pnas.1422986112 · Cited by 122
Bacterial mechanosensing: the force will be with you, always
Gordon, V. D., & Wang, L. (2019) · Journal of Cell Science · doi:10.1242/jcs.227694 · Cited by 121
Kazmierczak, B. I., Schniederberend, M., & Jain, R. (2015) · Current Opinion in Microbiology · doi:10.1016/j.mib.2015.07.017 · Cited by 120
Surface Sensing and Adaptation in Bacteria
Laventie, B., & Jenal, U. (2020) · Annual Review of Microbiology · doi:10.1146/annurev-micro-012120-063427 · Cited by 116
The Matrix Reloaded: How Sensing the Extracellular Matrix Synchronizes Bacterial Communities
Steinberg, N., & Kolodkin‐Gal, I. (2015) · Journal of Bacteriology · doi:10.1128/jb.02516-14 · Cited by 107
Adaptor-mediated Lon proteolysis restricts Bacillus subtilis hyperflagellation
Mukherjee, S., Bree, A. C., Liu, J., Patrick, J. E., Chien, P., & Kearns, D. B. (2014) · Proceedings of the National Academy of Sciences · doi:10.1073/pnas.1417419112 · Cited by 95
Functional Regulators of Bacterial Flagella
Subramanian, S., & Kearns, D. B. (2019) · Annual Review of Microbiology · doi:10.1146/annurev-micro-020518-115725 · Cited by 91
Wong, G. C. L., Antani, J. D., Lele, P. P., Chen, J., Nan, B., Kühn, M. J., Persat, A., Bru, J.-L., Høyland‐Kroghsbo, N. M., Siryaporn, A., et al. (2021) · Physical Biology · doi:10.1088/1478-3975/abdc0e · Cited by 93
Yu, Y., Yan, F., Chen, Y., Jin, C. A., Guo, J.-H., & Chai, Y. (2016) · Frontiers in Microbiology · doi:10.3389/fmicb.2016.01811 · Cited by 88
Hsueh, Y., Huang, K., Kunene, S. C., & Lee, T.-Y. (2017) · International Journal of Molecular Sciences · doi:10.3390/ijms18122644 · Cited by 87
Trends in the application of Bacillus in fermented foods
Kimura, K., & Yokoyama, S. (2018) · Current Opinion in Biotechnology · doi:10.1016/j.copbio.2018.09.001 · Cited by 87
Schniederberend, M., Williams, J. F., Shine, E. E., Shen, C., Jain, R., Emonet, T., & Kazmierczak, B. I. (2019) · PLoS Pathogens · doi:10.1371/journal.ppat.1008149 · Cited by 87
Harrison, J. J., Almblad, H., Irie, Y., Wolter, D. J., Eggleston, H., Randall, T. E., Kitzman, J. O., Stackhouse, B., Emerson, J., McNamara, S., et al. (2020) · PLoS Genetics · doi:10.1371/journal.pgen.1008848 · Cited by 80
Mohsin, M. Z., Omer, R., Huang, J., Mohsin, A., Guo, M., Qian, J., & Zhuang, Y. (2021) · Synthetic and Systems Biotechnology · doi:10.1016/j.synbio.2021.07.002 · Cited by 79
Purcell, E. B., McKee, R. W., Bordeleau, É., Burrus, V., & Tamayo, R. (2015) · Journal of Bacteriology · doi:10.1128/jb.00816-15 · Cited by 76
Persat, A. (2017) · Current Opinion in Microbiology · doi:10.1016/j.mib.2016.12.002 · Cited by 84
Straub, H., Bigger, C. M., Valentin, J. D. P., Abt, D., Qin, X., Eberl, L., Maniura‐Weber, K., & Ren, Q. (2019) · Advanced Healthcare Materials · doi:10.1002/adhm.201801323 · Cited by 75
Cyclic diguanylate signaling in Gram-positive bacteria
Purcell, E. B., & Tamayo, R. (2016) · FEMS Microbiology Reviews · doi:10.1093/femsre/fuw013 · Cited by 78
Balaure, P. C., & Grumezescu, A. M. (2020) · Nanomaterials · doi:10.3390/nano10061230 · Cited by 73
Harshey, R. M., & Partridge, J. D. (2015) · Journal of Molecular Biology · doi:10.1016/j.jmb.2015.07.025 · Cited by 73
Just in case it rains: building a hydrophobic biofilm the Bacillus subtilis way
Arnaouteli, S., MacPhee, C. E., & Stanley‐Wall, N. R. (2016) · Current Opinion in Microbiology · doi:10.1016/j.mib.2016.07.012 · Cited by 71
Self-citationPhosphorylated DegU Manipulates Cell Fate Differentiation in the Bacillus subtilis Biofilm
Marlow, V. L., Porter, M., Hobley, L., Kiley, T. B., Swedlow, J. R., Davidson, F. A., & Stanley‐Wall, N. R. (2013) · Journal of Bacteriology · doi:10.1128/jb.00930-13 · Cited by 69
Self-citationWu, D. C., Zamorano‐Sánchez, D., Pagliai, F. A., Park, J. H., Floyd, K. A., Lee, C. K., Kitts, G., Rose, C. B., Bilotta, E. M., Wong, G. C. L., et al. (2020) · PLoS Genetics · doi:10.1371/journal.pgen.1008703 · Cited by 67
Torque-dependent remodeling of the bacterial flagellar motor
Wadhwa, N., Phillips, R., & Berg, H. C. (2019) · Proceedings of the National Academy of Sciences · doi:10.1073/pnas.1904577116 · Cited by 66
A Skeptic's Guide to Bacterial Mechanosensing
Chawla, R., Gupta, R., Lele, T. P., & Lele, P. P. (2019) · Journal of Molecular Biology · doi:10.1016/j.jmb.2019.09.004 · Cited by 65
Steinberg, N., Keren‐Paz, A., Hou, Q., Doron, S., Yanuka‐Golub, K., Olender, T., Hadar, R., Rosenberg, G., Jain, R., Cámara-Almirón, J., et al. (2020) · Science Signaling · doi:10.1126/scisignal.aaw8905 · Cited by 63
A New Player at the Flagellar Motor: FliL Controls both Motor Output and Bias
Partridge, J. D., Nieto, V., & Harshey, R. M. (2015) · mBio · doi:10.1128/mbio.02367-14 · Cited by 61
Tecon, R., & Or, D. (2016) · Scientific Reports · doi:10.1038/srep19409 · Cited by 60
Chandrangsu, P., & Helmann, J. D. (2016) · PLoS Genetics · doi:10.1371/journal.pgen.1006515 · Cited by 62
Bacterial biofilms as an essential component of rhizosphere plant-microbe interactions
Bhattacharyya, A., Mavrodi, O. V., Bhowmik, N., Weller, D. M., Thomashow, L. S., & Mavrodi, D. V. (2023) · Methods in microbiology · doi:10.1016/bs.mim.2023.05.006 · Cited by 61
Chemotaxis to self-generated AI-2 promotes biofilm formation in Escherichia coli
Jani, S., Seely, A. L., Peabody, G. L., V, Jayaraman, A., & Manson, M. D. (2017) · Microbiology · doi:10.1099/mic.0.000567 · Cited by 58
Defects in the Flagellar Motor Increase Synthesis of Poly-γ-Glutamate in Bacillus subtilis
Chan, J. M., Guttenplan, S. B., & Kearns, D. B. (2013) · Journal of Bacteriology · doi:10.1128/jb.01217-13 · Cited by 59
The prevalence and origin of exoprotease-producing cells in the Bacillus subtilis biofilm
Marlow, V. L., Cianfanelli, F. R., Porter, M., Cairns, L. S., Dale, J. K., & Stanley‐Wall, N. R. (2013) · Microbiology · doi:10.1099/mic.0.072389-0 · Cited by 57
Self-citationBiophysical aspects underlying the swarm to biofilm transition
Worlitzer, V. M., Jose, A., Grinberg, I., Bär, M., Heidenreich, S., Eldar, A., Ariel, G., & Be’er, A. (2022) · Science Advances · doi:10.1126/sciadv.abn8152 · Cited by 50
Vuotto, C., Donelli, G., Buckley, A. M., & Chilton, C. H. (2018) · Advances in experimental medicine and biology · doi:10.1007/978-3-319-72799-8_7 · Cited by 58
Duan, Y., Petzold, M., Saleem-Batcha, R., & Teufel, R. (2020) · ChemBioChem · doi:10.1002/cbic.201900786 · Cited by 49
Kamada, M., Hase, S., Fujii, K., Miyake, M., Sato, K., Kimura, K., & Sakakibara, Y. (2015) · PLoS ONE · doi:10.1371/journal.pone.0141369 · Cited by 47
Lisevich, I., Colin, R., Yang, H. Y., Ni, B., & Sourjik, V. (2025) · Nature Communications · doi:10.1038/s41467-025-56980-x · Cited by 44
The Role of SwrA, DegU and PD3 in fla/che Expression in B. subtilis
Mordini, S., Osera, C., Marini, S., Scavone, F., Bellazzi, R., Galizzi, A., & Calvio, C. (2013) · PLoS ONE · doi:10.1371/journal.pone.0085065 · Cited by 42
Bacteria differently deploy type-IV pili on surfaces to adapt to nutrient availability
Ni, L., Yang, S., Zhang, R., Jin, Z., Chen, H., Conrad, J. C., & Jin, F. (2016) · npj Biofilms and Microbiomes · doi:10.1038/npjbiofilms.2015.29 · Cited by 42
Sultana, A., Zare, M., Luo, H., & Ramakrishna, S. (2021) · International Journal of Molecular Sciences · doi:10.3390/ijms222111788 · Cited by 40
Flagellum-Mediated Mechanosensing and RflP Control Motility State of Pathogenic Escherichia coli
Laganenka, L., López, M. E., Colin, R., & Sourjik, V. (2020) · mBio · doi:10.1128/mbio.02269-19 · Cited by 40
When the swimming gets tough, the tough form a biofilm
Belas, R. (2013) · Molecular Microbiology · doi:10.1111/mmi.12354 · Cited by 40
Management of Osmotic Stress by Bacillus Subtilis: Genetics and Physiology
Hoffmann, T., & Bremer, E. (2016) · Stress and Environmental Regulation of Gene Expression and Adaptation in Bacteria · doi:10.1002/9781119004813.ch63 · Cited by 39
Novel antibiofilm chemotherapies target nitrogen from glutamate and glutamine
Hassanov, T., Karunker, I., Steinberg, N., Erez, A., & Kolodkin‐Gal, I. (2018) · Scientific Reports · doi:10.1038/s41598-018-25401-z · Cited by 40
Cell biomechanics and mechanobiology in bacteria: Challenges and opportunities
Harper, C. E., & Hernandez, C. J. (2020) · APL Bioengineering · doi:10.1063/1.5135585 · Cited by 38
Mechanosensing: A Regulation Sensation
Ellison, C. K., & Brun, Y. V. (2015) · Current Biology · doi:10.1016/j.cub.2014.12.026 · Cited by 37
Loss of FliL Alters Proteus mirabilis Surface Sensing and Temperature-Dependent Swarming
Lee, Y., & Belas, R. (2014) · Journal of Bacteriology · doi:10.1128/jb.02235-14 · Cited by 37
Rath, H., Sappa, P. K., Hoffmann, T., Salazar, M. G., Reder, A., Steil, L., Hecker, M., Bremer, E., Mäder, U., & Völker, U. (2020) · Environmental Microbiology · doi:10.1111/1462-2920.15087 · Cited by 34
Recent Advances and Future Prospects in Bacterial and Archaeal Locomotion and Signal Transduction
Bardy, S. L., Briegel, A., Rainville, S., & Krell, T. (2017) · Journal of Bacteriology · doi:10.1128/jb.00203-17 · Cited by 32
Huang, Q., Zhu, J., Qu, C., Wang, Y., Hao, X., Chen, W., Cai, P., & Huang, Q. (2022) · Environmental Science & Technology · doi:10.1021/acs.est.2c06410 · Cited by 28
SwrD (YlzI) Promotes Swarming in Bacillus subtilis by Increasing Power to Flagellar Motors
Hall, A. N., Subramanian, S., Oshiro, R. T., Canzoneri, A. K., & Kearns, D. B. (2017) · Journal of Bacteriology · doi:10.1128/jb.00529-17 · Cited by 28
Janesch, B., Koerdt, A., Messner, P., & Schäffer, C. (2013) · PLoS ONE · doi:10.1371/journal.pone.0076566 · Cited by 27
Wozniak, D. J., & Parsek, M. R. (2014) · F1000Prime Reports · doi:10.12703/p6-26 · Cited by 28
An alternate route to phosphorylating DegU of Bacillus subtilis using acetyl phosphate
Cairns, L. S., Martyn, J. E., Bromley, K. M., & Stanley‐Wall, N. R. (2015) · BMC Microbiology · doi:10.1186/s12866-015-0410-z · Cited by 26
Self-citationOgura, M., Yoshikawa, H., & Chibazakura, T. (2013) · Journal of Bacteriology · doi:10.1128/jb.01321-13 · Cited by 24
Li, Y., Chen, N., Wu, Q., Liang, X., Yuan, X., Zhu, Z., Zheng, Y., Yu, S., Chen, M., Zhang, J., et al. (2022) · Frontiers in Microbiology · doi:10.3389/fmicb.2022.897836 · Cited by 23
Bose, T., Venkatesh, K. V., & Mande, S. S. (2017) · Frontiers in Cellular and Infection Microbiology · doi:10.3389/fcimb.2017.00128 · Cited by 22
Mechanotransduction in Prokaryotes: A Possible Mechanism of Spaceflight Adaptation
Fajardo-Cavazos, P., & Nicholson, W. L. (2021) · Life · doi:10.3390/life11010033 · Cited by 22
FlgN Is Required for Flagellum-Based Motility by Bacillus subtilis
Cairns, L. S., Marlow, V. L., Kiley, T. B., Birchall, C., Ostrowski, A., Aldridge, P. D., & Stanley‐Wall, N. R. (2014) · Journal of Bacteriology · doi:10.1128/jb.01599-14 · Cited by 22
Self-citationMechanical stimuli activate gene expression via a cell envelope stress sensing pathway
Harper, C. E., Zhang, W., Lee, J., Shin, J., Keller, M. R., van Wijngaarden, E. W., Chou, E., Wang, Z., Dörr, T., Chen, P., et al. (2023) · Scientific Reports · doi:10.1038/s41598-023-40897-w · Cited by 21
SwrA as global modulator of the two-component system DegSU in Bacillus subtilis
Ermoli, F., Bontà, V., Vitali, G., & Calvio, C. (2021) · Research in Microbiology · doi:10.1016/j.resmic.2021.103877 · Cited by 21
Nordgaard, M., Mortensen, R. M. R., Kirk, N. K., Gallegos‐Monterrosa, R., & Kovács, Á. T. (2021) · MicrobiologyOpen · doi:10.1002/mbo3.1212 · Cited by 19
Viscous drag on the flagellum activates Bacillus subtilis entry into the K‐state
Diethmaier, C., Chawla, R., Canzoneri, A. K., Kearns, D. B., Lele, P. P., & Dubnau, D. A. (2017) · Molecular Microbiology · doi:10.1111/mmi.13770 · Cited by 19
Sánchez, S., Snider, E. V., Wang, X., & Kearns, D. B. (2022) · Journal of Bacteriology · doi:10.1128/jb.00089-22 · Cited by 18
Yuan, F., Li, K. V., Zhou, C., Zhou, H., Liu, H., Chai, H., Fuping, L., & Zhang, H. (2019) · Genomics · doi:10.1016/j.ygeno.2019.10.021 · Cited by 18
Sacher, J., Shajahan, A., Butcher, J., Patry, R. T., Flint, A., Hendrixson, D. R., Stintzi, A. P., Azadi, P., & Szymanski, C. M. (2020) · Frontiers in Microbiology · doi:10.3389/fmicb.2020.00397 · Cited by 18
Bacterial flagellar motor as a multimodal biosensor
Krasnopeeva, E., Barboza‐Pérez, U. E., Rosko, J., Piližota, T., & Lo, C. (2020) · Methods · doi:10.1016/j.ymeth.2020.06.012 · Cited by 17
Indole Derivatives Maintain the Status Quo Between Beneficial Biofilms and Their Plant Hosts
Ganin, H., Kemper, N., Meir, S., Rogachev, I., Ely, S., Massalha, H., Mandabi, A., Shanzer, A., Keren‐Paz, A., Meijler, M. M., et al. (2019) · Molecular Plant-Microbe Interactions · doi:10.1094/mpmi-12-18-0327-r · Cited by 17
Poudel, S., Giannone, R. J., Farmer, A. T., Campagna, S. R., Bible, A. N., Morrell‐Falvey, J. L., Elkins, J. G., & Hettich, R. L. (2019) · Frontiers in Microbiology · doi:10.3389/fmicb.2019.02594 · Cited by 16
Hölscher, T., Schiklang, T., Dragoš, A., Dietel, A., Kost, C., & Kovács, Á. T. (2017) · Environmental Microbiology Reports · doi:10.1111/1758-2229.12601 · Cited by 16
The force awakens: The dark side of mechanosensing in bacterial pathogens
Mordue, J., O’Boyle, N., Gadegaard, N., & Roe, A. J. (2020) · Cellular Signalling · doi:10.1016/j.cellsig.2020.109867 · Cited by 15
Collective Vortex-Like Movement of Bacillus subtilis Facilitates the Generation of Floating Biofilms
Steinberg, N., Rosenberg, G., Keren‐Paz, A., & Kolodkin‐Gal, I. (2018) · Frontiers in Microbiology · doi:10.3389/fmicb.2018.00590 · Cited by 15
Zanditenas, E., Trebicz‐Geffen, M., Kolli, D., Domínguez-García, L., Farhi, E., Linde, L., Romero, D., Chapman, M. R., Kolodkin‐Gal, I., & Ankri, S. (2023) · npj Biofilms and Microbiomes · doi:10.1038/s41522-023-00444-x · Cited by 14
Harris, K. D., & Kolodkin‐Gal, I. (2018) · Environmental Microbiology · doi:10.1111/1462-2920.14497 · Cited by 14
Terahara, N., Namba, K., & Minamino, T. (2020) · Computational and Structural Biotechnology Journal · doi:10.1016/j.csbj.2020.10.009 · Cited by 14
Morris, R. J., Stevenson, D., Sukhodub, T., Stanley‐Wall, N. R., & MacPhee, C. E. (2022) · npj Biofilms and Microbiomes · doi:10.1038/s41522-022-00361-5 · Cited by 12
Self-citationMechanosensing regulates virulence inEscherichia coliO157:H7
Islam, M. S., & Krachler, A. M. (2016) · Gut Microbes · doi:10.1080/19490976.2015.1121365 · Cited by 13
Kim, D., Kim, W., & Kim, J. (2021) · Biotechnology and Bioprocess Engineering · doi:10.1007/s12257-020-0397-7 · Cited by 12
Queraltó, C., Ortega, C., Díaz-Yáñez, F., Inostroza, O., Espinoza, G., Álvarez, R., González, R., Parra, F., Paredes‐Sabja, D., Acuña, L. G., et al. (2023) · Journal of Global Antimicrobial Resistance · doi:10.1016/j.jgar.2023.05.004 · Cited by 11
Huang, R., Li, Q., Wang, D., Feng, H., Zhang, N., Shao, J., Shen, Q., Xu, Z., & Zhang, R. (2023) · 中国科学通报:英文版 · doi:10.1016/j.scib.2023.06.022 · Cited by 11
Bacillus subtilis degSU operon is regulated by the ClpXP-Spx regulated proteolysis system
Shiwa, Y., Yoshikawa, H., Tanaka, T., & Ogura, M. (2014) · The Journal of Biochemistry · doi:10.1093/jb/mvu076 · Cited by 11
Völker, F., Hoffmann, K., Halmschlag, B., Maaß, S., Büchs, J., & Blank, L. M. (2025) · Engineering in Life Sciences · doi:10.1002/elsc.70009 · Cited by 9
Ribardo, D. A., Johnson, J. G., & Hendrixson, D. R. (2023) · mBio · doi:10.1128/mbio.02544-23 · Cited by 9
Flagellar rotation facilitates the transfer of a bacterial conjugative plasmid
Bhattacharya, S., Bejerano‐Sagie, M., Ravins, M., Zeroni, L., Kaur, P., Gopu, V., Rosenshine, I., & Ben‐Yehuda, S. (2024) · The EMBO Journal · doi:10.1038/s44318-024-00320-0 · Cited by 7
More than a Feeling: Microscopy Approaches to Understanding Surface-Sensing Mechanisms
Graham, K. J., & Burrows, L. L. (2020) · Journal of Bacteriology · doi:10.1128/jb.00492-20 · Cited by 7
Biofilms: Besieged Cities or Thriving Ports?
Kroukamp, O., Bester, E., & Wolfaardt, G. M. (2019) · Advances in environmental microbiology · doi:10.1007/978-3-030-16775-2_3 · Cited by 7
Metadata
- Authors
- Cairns, L. S., Marlow, V. L., Bissett, E., Ostrowski, A., & Stanley‐Wall, N. R.
- Affiliations
- University of Dundee (GB)
- Corresponding author
- Stanley‐Wall, Nicola R.
- Venue
- Molecular Microbiology
- Publisher
- Wiley
- Published
- 2013-08-14
- Volume
- 90
- Issue
- 1
- Pages
- 6-21
- ISSN
- 0950-382X (ISSN-L)
- 1365-2958
- PMC
- PMC3963450
- OpenAlex
- W1908456294
- Cited by
- 143
- References
- 98
- Citations by year
- 2026: 7 · 2025: 8 · 2024: 7 · 2023: 7 · 2022: 9 · 2021: 13 · 2020: 17 · 2019: 12 · 2018: 6 · 2017: 12 · 2016: 13 · 2015: 13 · 2014: 11 · 2013: 8
- FWCI
- 9.95
- Type
- journal article
- Language
- en
- Open access
- hybrid
- doi.org
- Licence
- Locations
- Molecular Microbiology (publishedVersion, cc-by)
- Europe PMC (PubMed Central) (publishedVersion, cc-by)
- PubMed Central (publishedVersion, cc-by)
- PubMed (publishedVersion)
- Discovery Research Portal (University of Dundee) (submittedVersion)
- Funders
- Wellcome Trust (093714, 097945, 093714/Z/10/Z, 097818/Z/11, 097945/B/11/Z, 097818/Z/11/A)
- International Seafood Sustainability Foundation
- Directorate for Biological Sciences
- Biotechnology and Biological Sciences Research Council (BB/I006915/1, BB/H002340/1, BB/D526161/1)
- Topics
- Life Sciences › Biochemistry, Genetics and Molecular Biology › Genetics › Bacterial Genetics and Biotechnology
- Life Sciences › Biochemistry, Genetics and Molecular Biology › Molecular Biology › Bacterial biofilms and quorum sensing
- Life Sciences › Biochemistry, Genetics and Molecular Biology › Molecular Biology › Biochemical and Structural Characterization
- Keywords
- Bacillus subtilis, flagella, mechanosensing, biofilm formation, MotB, bacterial signal transduction
- MeSH terms
- Bacillus subtilis, Bacterial Proteins, Flagella, Locomotion, Signal Transduction, Gene Expression Regulation, Bacterial
About these checks
Registry, retraction, Cites and statistics results are computed, not judged, with one exception: a printed reference that no index lists is read once by a model before it counts as a citation error. Claims are extracted by a model and kept only when their quote appears verbatim in the text; each cited source is then checked, with a model’s help, for whether it says what the claim relies on. Those verdicts can be wrong — read the claim’s quote and the cited source before relying on one.
Statistics and arithmetic are recomputed, not judged.
Confidence bands are shown only for fields calibrated on our annotated test set. None is calibrated yet, so no band is shown.
What counts as a claim ›How we measure confidence ›How we check this ›
Are you an author, or do you see a problem with this page? Request a review
