

The DOI matches its Crossref record; 21 of the 21 references it cites were found in a registry or an index; none of the 17 sources its claims cite is checked for support yet.
An objective measure of quality for time-scale modification of audio
Open accessAbstract
Objective evaluation of audio processed with time-scale modification (TSM) remains an open problem. Recently, a dataset of time-scaled audio with subjective quality labels was published and used to create an initial objective measure of quality (OMOQ). In this paper, an improved OMOQ for time-scaled audio is proposed. The measure uses handcrafted features and a fully connected network to predict subjective mean opinion scores (SMOS). Basic and advanced perceptual evaluation of audio quality features are used in addition to nine features specific to TSM artefacts. Six methods of alignment are explored with interpolation of the reference magnitude spectrum to the length of the test magnitude spectrum giving the best performance. The proposed measure achieves a mean root mean square error of 0.490 and a mean Pearson correlation of 0.864 to SMOS, equivalent to the 97th and 82nd percentiles of the subjective sessions, respectively. The proposed measure is used to evaluate TSM algorithms, finding that Elastique gives the highest objective quality for solo instrument and voice signals, whereas the identity phase-locking phase vocoder gives the highest objective quality for music signals and the best overall quality. The objective measure is available online at https://www.github.com/zygurt/TSM.
Overview
CoChat Summary
TL;DR
The paper proposes an objective quality measure for time-scale modified audio using hand-crafted PEAQ and TSM-specific features with a fully connected neural network trained on a subjective dataset. It reports mean RMSE 0.487 and mean Pearson correlation 0.865, and uses the measure to rank TSM algorithms.
Key findings
- The proposed measure achieved a mean RMSE of 0.487 and a mean Pearson correlation of 0.865, equivalent to the 98th and 82nd percentiles of subjective sessions respectively (abstract; Results states PCC 82nd and RMSE 98th).
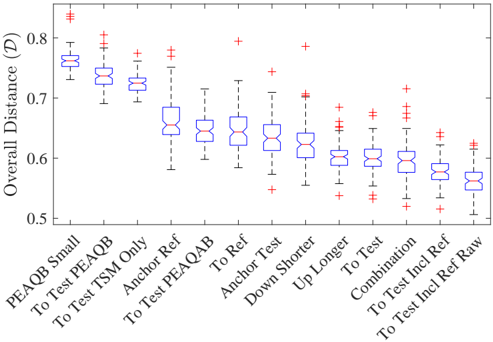
- Among six alignment methods, interpolation of the reference magnitude spectrum to the length of the test magnitude spectrum gave the best performance; including reference files improved results.
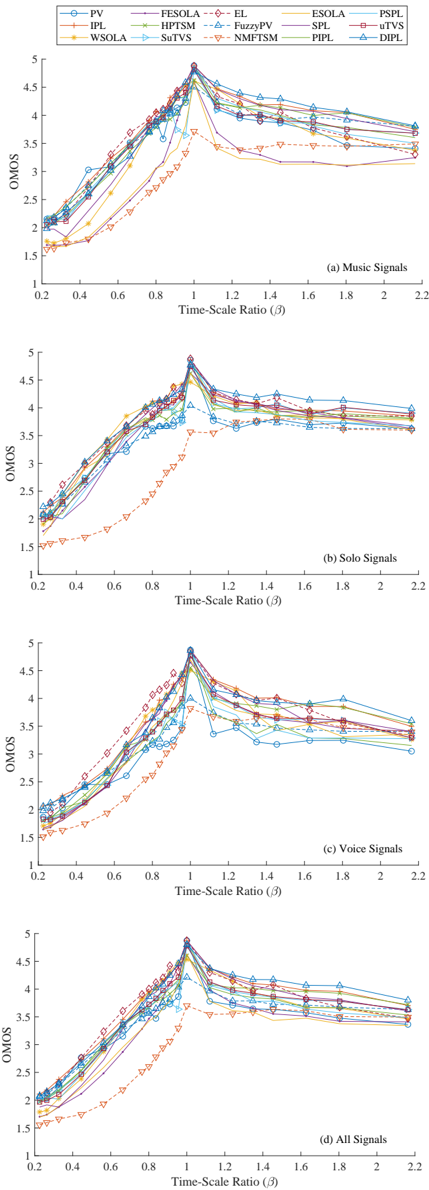
- For TSM algorithm evaluation, the paper reports Elastique gives the highest objective quality for Solo instrument and voice signals, while the Identity Phase-Locking Phase Vocoder (IPL) gives the highest objective quality for music signals and the best overall quality.
- Table II overall mean OMOS: IPL 3.717, Driedger’s IPL 3.710, Elastique 3.694; for music IPL 3.810 and Elastique 3.691; for voice Elastique 3.617 and IPL 3.568; for solo Driedger’s IPL 3.833 and Elastique 3.773, which differs from the abstract/conclusion statement that Elastique is highest for solo.
Methods
- Dataset: training subset of 5,280 processed files from 88 reference files at 10 ratios using six TSM methods; testing subset of 240 files from 20 reference files using three additional methods; evaluation subset of 5,200 files (400 per method) at 20 ratios in 0.22 < β < 2.2. Subjective labels came from 42,529 ratings by 263 participants in 633 sessions, with a minimum of 7 ratings per file.
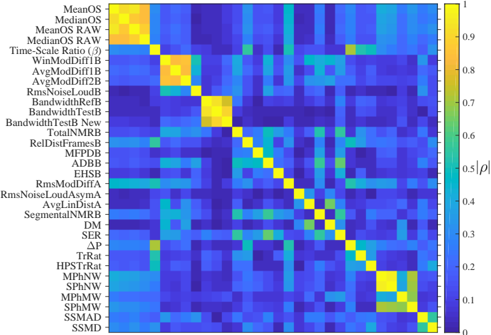
- Features: PEAQ Basic and Advanced MOVs plus nine TSM-specific features (phasiness, spectral similarity, transient, etc.); features were pruned if Pearson correlation between same-type features exceeded approximately 0.95, normalized to [0,1], and trained to normalized SMOS.
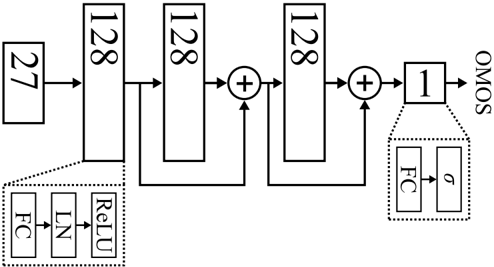
- Network: fully connected network with three hidden layers of 128 nodes, layer normalization, ReLU activation, residual connections around the second and third layers, and sigmoid output; trained for 800 epochs (extended if still improving), single batch, RMSE loss, AdamW, learning rate 1e-4, 10% validation, seeds 0–99; final alignment used interpolation to test including reference files.
Limitations
- Stated: future research includes evaluating a wider range of commercial and lesser-known TSM methods, comparing different implementations of the same method, and exploring alternative/deeper neural networks; initial testing gave ρte of 0.71 for a random forest and 0.65 for a CNN with blind data-driven features.
- Evident from text: the method assumes a constant time-scale ratio and single-channel audio; PEAQ assumes 48 kHz while the dataset uses 44.1 kHz; evaluation averages exclude β = 1 and β < 0.25; some TSM method results are noisy and were smoothed; the solo-signal ranking in the abstract/conclusion conflicts with the Results text and Table II.
Model-written summary. Check it against the paper before relying on it.
Integrity signals
Registry
Cites
Statistics
Figures
Verification
Claims the paper makes
0 Valid · 1 Not valid · 16 Not checked · 49 Own results and interpretations
A result the paper states — it cites no source for it, so there is none to check. The quote shows it is in the paper.
In the paper
“As all time-alignment methods produced highly correlated results, interpolation to test was chosen as the alignment method.”
§ An Objective Measure of Quality for Time-Scale Modification of Audio > B. Additional Features
plainstates an association- Asserted: passes — The authors put it forward as true.
- Checkable: passes — It can be checked against evidence.
- Load-bearing: passes — The paper’s conclusions depend on it.
- Based: passes — The paper gives a reason why it holds.
A result the paper reports from its own data — it cites no other source for it, so there is none to check. The quote shows it is in the paper.
In the paper
“The proposed measure is used to evaluate time-scale modification algorithms, finding that Elastique gives the highest objective quality for Solo instrument and voice signals, while the Identity Phase-Locking Phase Vocoder gives the highest objective quality for music signals and the best overall quality.”
plainstates an association- Asserted: passes — The authors put it forward as true.
- Checkable: passes — It can be checked against evidence.
- Load-bearing: passes — The paper’s conclusions depend on it.
- Based: passes — The paper gives a reason why it holds.
A result the paper reports from its own data — it cites no other source for it, so there is none to check. The quote shows it is in the paper.
In the paper
“For solo files all methods except NMFTSM perform similarly with a maximum difference between methods of approximately 0.5 around β = 0.9.”
§ An Objective Measure of Quality for Time-Scale Modification of Audio > C. TSM Algorithm Evaluation
plain- Asserted: passes — The authors put it forward as true.
- Checkable: passes — It can be checked against evidence.
- Load-bearing: unclear — It is unclear whether the paper’s conclusions depend on it.
- Based: passes — The paper gives a reason why it holds.
- Rests on 2 assumptions not shown here.
A result the paper states — it cites no source for it, so there is none to check. The quote shows it is in the paper.
In the paper
“ESOLA and FESOLA give significantly improved performance for this class.”
§ An Objective Measure of Quality for Time-Scale Modification of Audio > C. TSM Algorithm Evaluation
plainstates a cause- Asserted: passes — The authors put it forward as true.
- Checkable: passes — It can be checked against evidence.
- Load-bearing: unclear — It is unclear whether the paper’s conclusions depend on it.
- Based: passes — The paper gives a reason why it holds.
- Rests on 2 assumptions not shown here.
A result the paper reports from its own data — it cites no other source for it, so there is none to check. The quote shows it is in the paper.
In the paper
“Across all test cases, the network was more successful when training to mean, rather than median, targets.”
§ An Objective Measure of Quality for Time-Scale Modification of Audio > B. Network Performance
plainstates a cause- Asserted: passes — The authors put it forward as true.
- Checkable: passes — It can be checked against evidence.
- Load-bearing: unclear — It is unclear whether the paper’s conclusions depend on it.
- Based: passes — The paper gives a reason why it holds.
15 more claims
Create a free account to see all 66 claims and to verify the 11 references still open.
- It may state two separate claims as one. 33
- The quote only partly states this claim. 3
- Probably not a substantial claim. 15
Self-check
Percentages, sums and reported differences re-computed from the paper’s own numbers.
Each contradiction between two passages listed here was confirmed by an independent check.
Rated major: it would touch a result — a value a result rests on, reported and recomputed p-values on opposite sides of the significance level, two passages that conflict with no sign which is right, or a cited work retracted before this paper was published.
In the paper
§ An Objective Measure of Quality for Time-Scale Modification of Audio
“Elastique gives the highest objective quality for Solo instrument and voice signals”
§ An Objective Measure of Quality for Time-Scale Modification of Audio > C. TSM Algorithm Evaluation
“Solo 2.826 3.604 3.621 3.416 3.408 3.540 3.623 3.595 3.650 3.581 3.754 3.618 3.773 3.833 3.742”
Rated minor: it would not touch a result — a value no result rests on, a p-value that stays on the same side of the significance level, or a conflict that is clerical, resolved elsewhere in the paper, or outside its own findings.
In the paper
§ An Objective Measure of Quality for Time-Scale Modification of Audio > C. TSM Algorithm Evaluation
“When averaged, the OMOQ rates IPL highest followed by Elastique.”
§ An Objective Measure of Quality for Time-Scale Modification of Audio > C. TSM Algorithm Evaluation
“Music 2.842 2.883 2.982 3.571 3.641 3.643 3.548 3.673 3.622 3.627 3.516 3.660 3.691 3.750 3.810”
Citations
Cites
Decoupled Weight Decay Regularization
Loshchilov, I., & Hutter, F. (2017) · arXiv · doi:10.48550/arxiv.1711.05101 · Cited by 12,522
A tutorial on onset detection in music signals
Bello, J. P., Daudet, L., Abdallah, S., Duxbury, C., Davies, M., & Sandler, M. B. (2005) · IEEE Transactions on Speech and Audio Processing · doi:10.1109/tsa.2005.851998 · Cited by 719
Improved phase vocoder time-scale modification of audio
Laroche, J., & Dolson, M. (1999) · IEEE Transactions on Speech and Audio Processing · doi:10.1109/89.759041 · Cited by 276
Verhelst, W., & Roelands, M. (1993) · IEEE International Conference on Acoustics Speech and Signal Processing · doi:10.1109/icassp.1993.319366 · Cited by 217
Implementation of the digital phase vocoder using the fast Fourier transform
Portnoff, M. R. (1976) · IEEE Transactions on Acoustics Speech and Signal Processing · doi:10.1109/tassp.1976.1162810 · Cited by 209
High quality time-scale modification for speech
Roucos, S., & Wilgus, A. (2005) · ICASSP '85. IEEE International Conference on Acoustics, Speech, and Signal Processing · doi:10.1109/icassp.1985.1168381 · Cited by 143
Non-intrusive Speech Quality Assessment Using Neural Networks
Avila, A. R., Gamper, H., Reddy, C. K. A., Cutler, R., Tashev, I., & Gehrke, J. E. (2019) · IEEE International Conference on Acoustics Speech and Signal Processing · doi:10.1109/icassp.2019.8683175 · Cited by 104
Improving Time-Scale Modification of Music Signals Using Harmonic-Percussive Separation
Driedger, J., Muller, M., & Ewert, S. (2014) · IEEE Signal Processing Letters · doi:10.1109/lsp.2013.2294023 · Cited by 64
Audio Time Stretching Using Fuzzy Classification of Spectral Bins
Damskägg, E.-P., & Välimäki, V. (2017) · Applied Sciences · doi:10.3390/app7121293 · Cited by 34
PhaVoRIT: A Phase Vocoder for Real-Time Interactive Time-Stretching
Karrer, T., Lee, E., & Borchers, J. (2006) · Cited by 22
Epoch-Synchronous Overlap-Add (ESOLA) for Time- and Pitch-Scale Modification of Speech SignalsPreprint
Rudresh, S., Vasisht, A., Vijayan, K., & Seelamantula, C. S. (2018) · arXiv (Cornell University) · doi:10.48550/arxiv.1801.06492 · Cited by 22
An Improved Measure of Musical Noise Based on Spectral Kurtosis
Torcoli, M. (2019) · IEEE Workshop on Applications of Signal Processing to Audio and Acoustics (WASPAA) · doi:10.1109/waspaa.2019.8937195 · Cited by 11
Time-Scale Modification Using Fuzzy Epoch-Synchronous Overlap-Add (FESOLA)
Roberts, T., & Paliwal, K. K. (2019) · IEEE Workshop on Applications of Signal Processing to Audio and Acoustics (WASPAA) · doi:10.1109/waspaa.2019.8937258 · Cited by 7
Self-citationGomez, A. M., Schwerin, B., & Paliwal, K. K. (2011) · Interspeech (USB) · doi:10.21437/interspeech.2011-429 · Cited by 5
Self-citationA time-scale modification dataset with subjective quality labels
Roberts, T., & Paliwal, K. K. (2020) · The Journal of the Acoustical Society of America · doi:10.1121/10.0001567 · Cited by 4
Self-citationSharma, N., Potadar, S., Chetupalli, S. R., & Sreenivas, T. V. (2017) · 2017 Twenty-third National Conference on Communications (NCC) · doi:10.1109/ncc.2017.8077073 · Cited by 3
Subjective Quality Labelled Time-Scale Modification of Audio Dataset
Roberts, T. (2020) · IEEE DataPort · doi:10.21227/ny9p-rv41 · Cited by 2
Self-citationStereo Time-Scale Modification Using Sum and Difference Transformation
Roberts, T., & Paliwal, K. K. (2018) · 2018 12th International Conference on Signal Processing and Communication Systems (ICSPCS) · doi:10.1109/icspcs.2018.8631776 · Cited by 1
Self-citation(2000) · Publikationsdatenbank der Fraunhofer-Gesellschaft (Fraunhofer-Gesellschaft)
(2014)
(2019) · Huddersfield Research Portal (University of Huddersfield)
Cited by
Torcoli, M., Kastner, T., & Herre, J. (2021) · IEEE/ACM Transactions on Audio Speech and Language Processing · doi:10.1109/taslp.2021.3069302 · Cited by 87
Deep Learning-Based Single-Ended Objective Quality Measures for Time-Scale Modified AudioPreprint
Roberts, T., Nicolson, A., & Paliwal, K. K. (2020) · arXiv (Cornell University) · doi:10.48550/arxiv.2009.02940 · Cited by 1
Self-citation
Metadata
- Authors
- Roberts, T., & Paliwal, K. K.
- Affiliations
- Griffith University (AU)
- Venue
- The Journal of the Acoustical Society of America
- Publisher
- Acoustical Society of America (ASA)
- Published
- 2021-03-01
- Volume
- 149
- Issue
- 3
- Pages
- 1843-1854
- ISSN
- 0001-4966 (ISSN-L)
- 1520-8524
- OpenAlex
- W3035738007
- Cited by
- 2
- References
- 21
- Citations by year
- 2021: 1
- FWCI
- 0.11
- Type
- journal article
- Language
- en
- Open access
- green
- arxiv.org
- Licence
- cc-by
- Locations
- The Journal of the Acoustical Society of America (publishedVersion)
- PubMed (publishedVersion)
- arXiv (Cornell University) (submittedVersion, cc-by)
- Griffith Research Online (submittedVersion)
- arXiv (Cornell University)
- Topics
- Physical Sciences › Computer Science › Signal Processing › Speech and Audio Processing
- Physical Sciences › Computer Science › Signal Processing › Music and Audio Processing
- Physical Sciences › Computer Science › Computer Vision and Pattern Recognition › Image and Video Quality Assessment
- Keywords
- time-scale modification, objective quality metrics, audio quality assessment, handcrafted features, fully connected networks, music signals
- MeSH terms
- Algorithms, Music
About these checks
Registry, retraction, Cites and statistics results are computed, not judged, with one exception: a printed reference that no index lists is read once by a model before it counts as a citation error. Claims are extracted by a model and kept only when their quote appears verbatim in the text; each cited source is then checked, with a model’s help, for whether it says what the claim relies on. Those verdicts can be wrong — read the claim’s quote and the cited source before relying on one.
A language model drew the claims from the paper on 2026-11-14, under version 3 of the claim definition (model deepseek-v4.1-flash, prompt extract-v3).
A second model labelled each claim on 2026-11-14 (model jev-1.13-20260917, definition revision gold-guideline-v0.2).
Statistics and arithmetic are recomputed, not judged.
Confidence bands are shown only for fields calibrated on our annotated test set. None is calibrated yet, so no band is shown.
What counts as a claim ›How we measure confidence ›How we check this ›
Are you an author, or do you see a problem with this page? Request a review
Data sources
Bibliographic data: Semantic Scholar, OpenAlex, Crossref.
Contains information from the Semantic Scholar Academic Graph Datasets, made available under the ODC Attribution License (ODC-BY 1.0).
Semantic Scholar’s data is described in: Kinney, R., et al. (2023). The Semantic Scholar Open Data Platform. arXiv:2301.10140.
