Student or educator? Sign up with your school email and get 6 months of Pro free.
Cited by 107

The DOI matches its Crossref record; 55 of the 55 references it cites were found in a registry or an index.

Structure of a 1.5-MDa adhesin that binds its Antarctic bacterium to diatoms and ice

Guo, Shuaiqi, Stevens, Corey A., Vance, Tyler D. R., Olijve, Luuk L. C., Graham, Laurie A., Campbell, Robert L., Yazdi, Saeed R., Escobedo, Carlos, Bar-Dolev, Maya, Yashunsky, Victor, Braslavsky, Ido, Langelaan, David N., Smith, Steven P., Allingham, John S., Voets, Ilja K., Davies, Peter L.·2017·Science Advances

Abstract

Structure of a bacterial adhesin reveals its role in forming a mixed-species symbiotic community with diatoms on sea ice.

Overview

The claims and statistics of this paper haven’t been checked yet.

Run the check — free, no account needed. It reads the open-access text and checks the sources it cites.

A few free checks a day · papers already verified open instantly · results are public

Integrity signals

Registry

Crossref · 10.1126/sciadv.1701440

Cites

55 of 55 references verified0 citation errors · 0 not checkable

Statistics

Figures

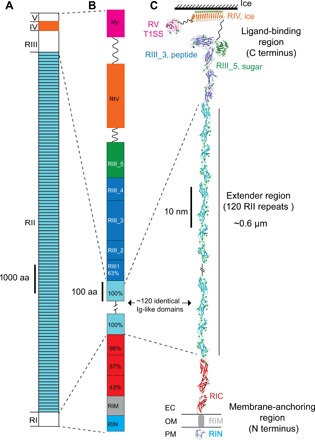
Fig. 1 Overall structure of MpIBP. (A) Linear domain map of MpIBP drawn to scale. The MpIBP amino acid (aa) sequence is shown in fig. S1. RII and RIV (colored light blue and orange, respectively) are known from two structures solved previously (10, 11, 22). RI, RIII, and RV in white are new three-dimensional structures determined in this study. (B) Expanded view of the RI and RIII to RV linear domain maps colored as in (C). Sequence identities (%) to a 104–amino acid RII repeat are shown for the RIC and RIII_1 domains. (C) NMR and x-ray crystal structures of linked MpIBP domains from N to C termini are shown in cartoon representation: RIN (blue), RIC (red), RII repeats (cyan), RIII_1–4 (dark blue), RIII_5 (dark green), RIV (orange), and RV (magenta). Small green spheres indicate calcium ions. OM is indicated by horizontal lines on either side of RIM. The solution structure of RIM determined by SAXS is illustrated as a gray cylinder. Hatched lines indicate the ~108 RII repeats that are not shown in the figure. The linker regions between RIII_5/RIV (94 residues) and RIV/RV (112 residues) are indicated by wavy lines.
Fig. 1 Overall structure of MpIBP. (A) Linear domain map of MpIBP drawn to scale. The MpIBP amino acid (aa) sequence is shown in fig. S1. RII and RIV (colored light blue and orange, respectively) are known from two structures solved previously (10, 11, 22). RI, RIII, and RV in white are new three-dimensional structures determined in this study. (B) Expanded view of the RI and RIII to RV linear domain maps colored as in (C). Sequence identities (%) to a 104–amino acid RII repeat are shown for the RIC and RIII_1 domains. (C) NMR and x-ray crystal structures of linked MpIBP domains from N to C termini are shown in cartoon representation: RIN (blue), RIC (red), RII repeats (cyan), RIII_1–4 (dark blue), RIII_5 (dark green), RIV (orange), and RV (magenta). Small green spheres indicate calcium ions. OM is indicated by horizontal lines on either side of RIM. The solution structure of RIM determined by SAXS is illustrated as a gray cylinder. Hatched lines indicate the ~108 RII repeats that are not shown in the figure. The linker regions between RIII_5/RIV (94 residues) and RIV/RV (112 residues) are indicated by wavy lines.CC BY-NC · PubMed Central
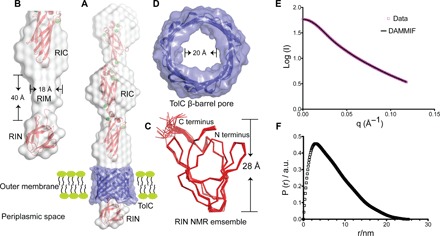
Fig. 2 Detailed structural features of the OM anchoring RI. (A) The NMR structure of RIN (bottom) and the 2 Å crystal structure of RIC (top) are colored red and fitted into the gray solution structure of the whole RI construct determined by SAXS. The RI solution envelope is fitted through the purple TolC pore homology model embedded in the OM. (B) Close-up view of the cylindrical RIM (gray) determined by SAXS without showing the TolC pore. Dimensions of RIM are indicated. (C) Top-down view of the TolC OM pore model. The internal diameter is indicated. (D) The 20-member NMR structural ensemble of RIN is colored red and shown in ribbon representation. The N and C termini and the height of the protein are marked. (E and F) SAXS data were collected from MpIBP_RI at a concentration of 7 mg/ml. (E) Experimental scattering data of MpIBP_RI (magenta symbols) and fit result of ab initio modeling (DAMMIF, black line). (F) Radial distribution function obtained after Indirect Fourier Transform (IFT) analysis of the scattering data, with data points starting from the first Guinier regime at low q up to the Porod regime at high q values (0.013 Å−1 ≤ q ≤ 0.12 Å−1). a.u., arbitrary units.
Fig. 2 Detailed structural features of the OM anchoring RI. (A) The NMR structure of RIN (bottom) and the 2 Å crystal structure of RIC (top) are colored red and fitted into the gray solution structure of the whole RI construct determined by SAXS. The RI solution envelope is fitted through the purple TolC pore homology model embedded in the OM. (B) Close-up view of the cylindrical RIM (gray) determined by SAXS without showing the TolC pore. Dimensions of RIM are indicated. (C) Top-down view of the TolC OM pore model. The internal diameter is indicated. (D) The 20-member NMR structural ensemble of RIN is colored red and shown in ribbon representation. The N and C termini and the height of the protein are marked. (E and F) SAXS data were collected from MpIBP_RI at a concentration of 7 mg/ml. (E) Experimental scattering data of MpIBP_RI (magenta symbols) and fit result of ab initio modeling (DAMMIF, black line). (F) Radial distribution function obtained after Indirect Fourier Transform (IFT) analysis of the scattering data, with data points starting from the first Guinier regime at low q up to the Porod regime at high q values (0.013 Å−1 ≤ q ≤ 0.12 Å−1). a.u., arbitrary units.CC BY-NC · PubMed Central
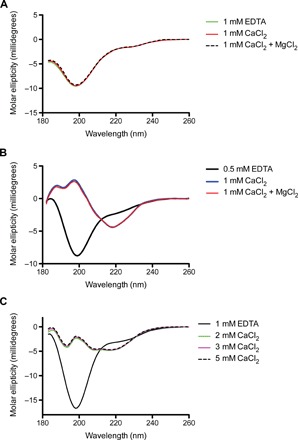
Fig. 3 CD spectra of RINM, RIII_5, and RV measured in EDTA and different concentrations of CaCl2 or MgCl2. (A) The far-UV CD spectra of RINM were plotted as molar ellipticity versus wavelength. The spectra in the presence of 1 mM EDTA (green line), 1 mM CaCl2 (red line), and both 1 mM CaCl2 and MgCl2 (broken black line) are coincident. (B) The far-UV CD spectra of RIII_5. Spectra in the presence of 0.5 mM EDTA, 1 mM CaCl2, and both 1 mM CaCl2 and MgCl2 are indicated by black, blue, and red lines, respectively. (C) The far-UV CD spectra of RV. Spectra in the presence of 1 mM EDTA or 2, 3, and 5 mM CaCl2 are indicated by black, green, magenta, and broken black lines, respectively.
Fig. 3 CD spectra of RINM, RIII_5, and RV measured in EDTA and different concentrations of CaCl2 or MgCl2. (A) The far-UV CD spectra of RINM were plotted as molar ellipticity versus wavelength. The spectra in the presence of 1 mM EDTA (green line), 1 mM CaCl2 (red line), and both 1 mM CaCl2 and MgCl2 (broken black line) are coincident. (B) The far-UV CD spectra of RIII_5. Spectra in the presence of 0.5 mM EDTA, 1 mM CaCl2, and both 1 mM CaCl2 and MgCl2 are indicated by black, blue, and red lines, respectively. (C) The far-UV CD spectra of RV. Spectra in the presence of 1 mM EDTA or 2, 3, and 5 mM CaCl2 are indicated by black, green, magenta, and broken black lines, respectively.CC BY-NC · PubMed Central
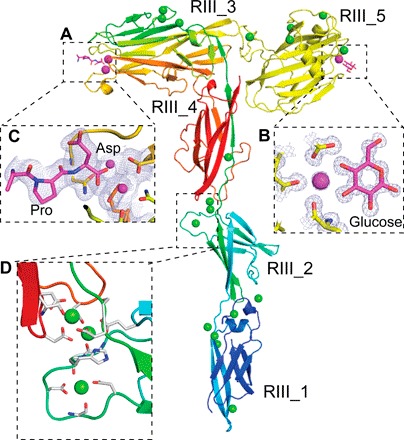
Fig. 4 Detailed structural features of the MpIBP_RIII ligand-binding domains. (A) RIII_1–4 is colored in rainbow representation, whereas the RIII_5 construct is colored yellow. Calcium ions in the ligand-binding sites are shown as magenta spheres, whereas the other Ca2+ are shown as green spheres. (B) Enlarged view of the sugar-binding site of the RIII_5 structure, showing the 1 Å 2Fo − Fc map and the carbon atoms of the glucose molecule colored magenta. Oxygen atoms are red, and nitrogen atoms are blue. (C) Enlarged view of the ligand-binding cavity of RIII_3 is shown with the 2.1 Å resolution 2Fo − Fc map contoured at 1 σ [as in (B)]. Ca2+ coordination by the C-terminal Pro and Asp residues from a symmetry-related molecule are shown in stick representations. (D) Enlarged view of the Ca2+-stiffened linker region between RIII_2 and RIII_4. Ca2+ coordinating residues are shown in stick representation.
Fig. 4 Detailed structural features of the MpIBP_RIII ligand-binding domains. (A) RIII_1–4 is colored in rainbow representation, whereas the RIII_5 construct is colored yellow. Calcium ions in the ligand-binding sites are shown as magenta spheres, whereas the other Ca2+ are shown as green spheres. (B) Enlarged view of the sugar-binding site of the RIII_5 structure, showing the 1 Å 2Fo − Fc map and the carbon atoms of the glucose molecule colored magenta. Oxygen atoms are red, and nitrogen atoms are blue. (C) Enlarged view of the ligand-binding cavity of RIII_3 is shown with the 2.1 Å resolution 2Fo − Fc map contoured at 1 σ [as in (B)]. Ca2+ coordination by the C-terminal Pro and Asp residues from a symmetry-related molecule are shown in stick representations. (D) Enlarged view of the Ca2+-stiffened linker region between RIII_2 and RIII_4. Ca2+ coordinating residues are shown in stick representation.CC BY-NC · PubMed Central
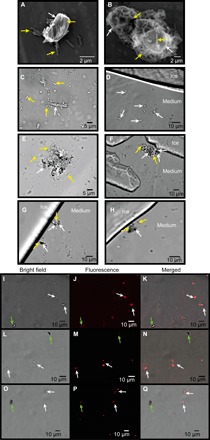
Fig. 5 M. primoryensis selectively binds the diatom C. neogracile. SEM images of (A) single or (B) multiple C. neogracile (indicated by white arrows) bound by M. primoryensis (indicated by yellow arrows). Representative bright-field microscopy images of C. neogracile (marked by white arrows) in the presence of (C) M. primoryensis (yellow arrows) or (D) ice. Bright-field microscopy images of M. primoryensis + C. neogracile microcolonies with (F, G, and H) or without (E) ice. Light (I, L, and O) and fluorescence microscopy images (J, M, and P) of a mixture of diatoms, C. neogracile (white arrows), and F. cylindrus (green arrows), incubated with TRITC-labeled RIII_1–5. Slight shifts in the merged images (K, N, and Q) between the fluorescence and bright-field images are due to drifting of the cells between image capture.
Fig. 5 M. primoryensis selectively binds the diatom C. neogracile. SEM images of (A) single or (B) multiple C. neogracile (indicated by white arrows) bound by M. primoryensis (indicated by yellow arrows). Representative bright-field microscopy images of C. neogracile (marked by white arrows) in the presence of (C) M. primoryensis (yellow arrows) or (D) ice. Bright-field microscopy images of M. primoryensis + C. neogracile microcolonies with (F, G, and H) or without (E) ice. Light (I, L, and O) and fluorescence microscopy images (J, M, and P) of a mixture of diatoms, C. neogracile (white arrows), and F. cylindrus (green arrows), incubated with TRITC-labeled RIII_1–5. Slight shifts in the merged images (K, N, and Q) between the fluorescence and bright-field images are due to drifting of the cells between image capture.CC BY-NC · PubMed Central
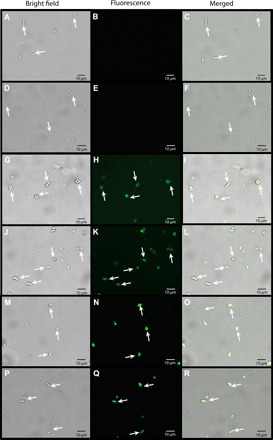
Fig. 6 RIII_5 sugar-binding and RIII_3 peptide-binding domains are responsible for binding to C. neogracile. Light (A, D, G, J, M, and P), fluorescence (B, E, H, K, N, and Q), and merged (C, F, I, L, O, and R) images of diatom C. neogracile (white arrows) incubated with green fluorescent protein–tagged MpIBP domains: RII (A to F), RIII_5 (G to L), and RIII_3 (M to R). All images were captured with the same length of exposure.
Fig. 6 RIII_5 sugar-binding and RIII_3 peptide-binding domains are responsible for binding to C. neogracile. Light (A, D, G, J, M, and P), fluorescence (B, E, H, K, N, and Q), and merged (C, F, I, L, O, and R) images of diatom C. neogracile (white arrows) incubated with green fluorescent protein–tagged MpIBP domains: RII (A to F), RIII_5 (G to L), and RIII_3 (M to R). All images were captured with the same length of exposure.CC BY-NC · PubMed Central
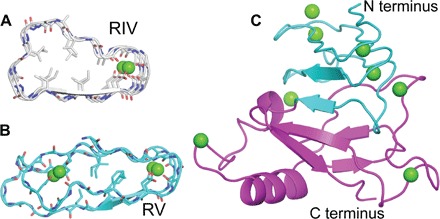
Fig. 7 Structural comparison between the RIV and RV of MpIBP. (A) Cross section of the RTX repeats of RIV (gray). (B) Cross section of the RTX repeats of RV (cyan). (C) The 1.45 Å structure of RV. The N-terminal moiety is colored green, whereas the C-terminal moiety is colored magenta.
Fig. 7 Structural comparison between the RIV and RV of MpIBP. (A) Cross section of the RTX repeats of RIV (gray). (B) Cross section of the RTX repeats of RV (cyan). (C) The 1.45 Å structure of RV. The N-terminal moiety is colored green, whereas the C-terminal moiety is colored magenta.CC BY-NC · PubMed Central
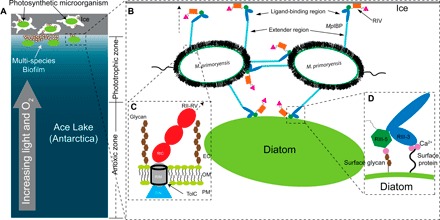
Fig. 8 Model of M. primoryensis collectively binding with diatoms to ice. (A) Ice/snow that covers the surface of Ace Lake to a depth of 1 to 2 m is represented by a gray rectangle with three internal brine channels of irregular shape. Lake water is colored blue with a light to dark gradient from top to bottom signifying the increased availability of light and oxygen toward the top of the water column as indicated by the gray arrow. Bacteria and photosynthetic microorganisms such as diatoms within the brine pits and underneath the ice are drawn as small white ovals and large green ovals, respectively. The phototrophic and anoxic zones are indicated on the right. (B) Expanded view of (A) showing two linked bacterial cells bound to ice and a diatom. Cell-surface proteins and carbohydrates are drawn as fuzzy black hairs, and the polar flagella are drawn as squiggles. MpIBPs protrude from cell surfaces. RII, RIII_1–4, RIII_5, RIV, and RV are drawn as cyan rods, blue ovals, dark green hexagons, orange rectangles, and magenta triangles, respectively. (C) Expanded view of the cell surface–anchoring domains of MpIBP near the OM. OM is drawn the same way as in Fig. 2A. Surface glycans are drawn as connected brown hexagons. RIN, RIM, and RIC are drawn as a blue triangle, a gray cylinder, and red ovals, respectively. The hollow TolC OM pore is outlined in black. The arrow with a broken line indicates the protein continues to RII to RV. (D) Enlarged view of MpIBP_RIII interacting with the peptide and sugar molecules on the cell surface of a diatom. Ligand-binding Ca2+ are drawn as magenta spheres. Surface protein is indicated by a wavy line from the cell surface.
Fig. 8 Model of M. primoryensis collectively binding with diatoms to ice. (A) Ice/snow that covers the surface of Ace Lake to a depth of 1 to 2 m is represented by a gray rectangle with three internal brine channels of irregular shape. Lake water is colored blue with a light to dark gradient from top to bottom signifying the increased availability of light and oxygen toward the top of the water column as indicated by the gray arrow. Bacteria and photosynthetic microorganisms such as diatoms within the brine pits and underneath the ice are drawn as small white ovals and large green ovals, respectively. The phototrophic and anoxic zones are indicated on the right. (B) Expanded view of (A) showing two linked bacterial cells bound to ice and a diatom. Cell-surface proteins and carbohydrates are drawn as fuzzy black hairs, and the polar flagella are drawn as squiggles. MpIBPs protrude from cell surfaces. RII, RIII_1–4, RIII_5, RIV, and RV are drawn as cyan rods, blue ovals, dark green hexagons, orange rectangles, and magenta triangles, respectively. (C) Expanded view of the cell surface–anchoring domains of MpIBP near the OM. OM is drawn the same way as in Fig. 2A. Surface glycans are drawn as connected brown hexagons. RIN, RIM, and RIC are drawn as a blue triangle, a gray cylinder, and red ovals, respectively. The hollow TolC OM pore is outlined in black. The arrow with a broken line indicates the protein continues to RII to RV. (D) Enlarged view of MpIBP_RIII interacting with the peptide and sugar molecules on the cell surface of a diatom. Ligand-binding Ca2+ are drawn as magenta spheres. Surface protein is indicated by a wavy line from the cell surface.CC BY-NC · PubMed Central

Verification

Claims the paper makes

The claims and statistics of this paper haven’t been checked yet.

Run the check — free, no account needed. It reads the open-access text and checks the sources it cites.

A few free checks a day · papers already verified open instantly · results are public

Claims other papers make about this one

Each is checked against this paper’s own text: does it say what the citing paper says it does?

Self-check

Percentages, sums and reported differences re-computed from the paper’s own numbers.

The self-check needs the paper’s full text.

Citations

Cites

Show all 55 references

Research works printed but not linked: 2

  1. M. D. Winn, C. C. Ballard, K. D. Cowtan, E. J. Dodson, P. Emsley, P. R. Evans, R. M. Keegan, E. B. Krissinel, A. G. W. Leslie, A. McCoy, S. J. McNicholas, G. N. Murshudov, N. S. Pannu, E. A. Potterton, H. R. Powell, R. J. Read, A. Vagin, K. S. Wilson, Overview of the CCP4 suite and current developments. Acta Cryst. 67, 235–242 (2011).
  2. A. A. Vagin, R. A. Steiner, A. A. Lebedev, L. Potterton, S. McNicholas, F. Long, G. N. Murshudov, REFMAC5 dictionary: Organization of prior chemical knowledge and guidelines for its use. Acta Cryst. 60, 2184–2195 (2004).

Cited by

See all 107

Metadata

Authors
Guo, S., Stevens, C. A., Vance, T. D. R., Olijve, L. L. C., Graham, L. A., Campbell, R. L., Yazdi, S. R., Escobedo, C., Bar-Dolev, M., Yashunsky, V., Braslavsky, I., Langelaan, D. N., Smith, S. P., Allingham, J. S., Voets, I. K., & Davies, P. L.
Affiliations
  • Protein Function Discovery Group and Department of Biomedical and Molecular Sciences, Queen’s University, Kingston, Ontario K7L 3N6, Canada.
  • Institute for Complex Molecular Systems, Eindhoven University of Technology, 5600 MD Eindhoven, Netherlands.
  • Faculty of Engineering and Applied Science and Department of Chemical Engineering, Queen’s University, Kingston, Ontario K7L 3N6, Canada.
  • Institute of Biochemistry, Food Science and Nutrition, Robert H. Smith Faculty of Agriculture, Food and Environment, Hebrew University of Jerusalem, Rehovot 7610001, Israel.
Venue
Science Advances
Published
2017-08-04
Volume
3
Issue
8
ISSN
2375-2548
Cited by
107
References
55
Language
en
Funders
  • Canadian Institutes of Health Research (award330435)
  • Natural Sciences and Engineering Research Council of Canada (award330436, award330438, award330439, award330441)
  • European Research Council (award330440, award330437)

About these checks

Registry, retraction, Cites and statistics results are computed, not judged, with one exception: a printed reference that no index lists is read once by a model before it counts as a citation error. Claims are extracted by a model and kept only when their quote appears verbatim in the text; each cited source is then checked, with a model’s help, for whether it says what the claim relies on. Those verdicts can be wrong — read the claim’s quote and the cited source before relying on one.

Statistics and arithmetic are recomputed, not judged.

Confidence bands are shown only for fields calibrated on our annotated test set. None is calibrated yet, so no band is shown.

What counts as a claim ›How we measure confidence ›How we check this ›

Are you an author, or do you see a problem with this page? Request a review

How to cite

Cite CoChat for the checks on this page, and the paper for its own findings.

This page
CoChat. (2026). Citation check: Structure of a 1.5-MDa adhesin that binds its Antarctic bacterium to diatoms and ice. https://app.cochat.ai/papers/10.1126/sciadv.1701440
The paper
Guo, S., Stevens, C. A., Vance, T. D. R., Olijve, L. L. C., Graham, L. A., Campbell, R. L., Yazdi, S. R., Escobedo, C., Bar-Dolev, M., Yashunsky, V., Braslavsky, I., Langelaan, D. N., Smith, S. P., Allingham, J. S., Voets, I. K., & Davies, P. L. (2017). Structure of a 1.5-MDa adhesin that binds its Antarctic bacterium to diatoms and ice. Science Advances. https://doi.org/10.1126/sciadv.1701440

Data sources

Bibliographic data: Semantic Scholar, OpenAlex, Crossref.

Contains information from the Semantic Scholar Academic Graph Datasets, made available under the ODC Attribution License (ODC-BY 1.0).

Semantic Scholar’s data is described in: Kinney, R., et al. (2023). The Semantic Scholar Open Data Platform. arXiv:2301.10140.