Cited by 228Interstitial Lung Diseases and Idiopathic Pulmonary FibrosisSystemic Sclerosis and Related DiseasesOccupational and environmental lung diseases

The DOI matches its Crossref record; 55 of the 55 references it cites were found in a registry or an index.

MBD2 serves as a viable target against pulmonary fibrosis by inhibiting macrophage M2 program

Open access

Abstract

Liposomes carrying MBD2 siRNA protect mice against BLM-induced lung injury and fibrosis by targeting macrophage M2 program.

Overview

The claims and statistics of this paper haven’t been checked yet.

Run the check — free, no account needed. It reads the open-access text and checks the sources it cites.

A few free checks a day · papers already verified open instantly · results are public

Integrity signals

Registry

Crossref · 10.1126/sciadv.abb6075

Cites

55 of 55 references verified0 citation errors · 0 not checkable

Statistics

Figures

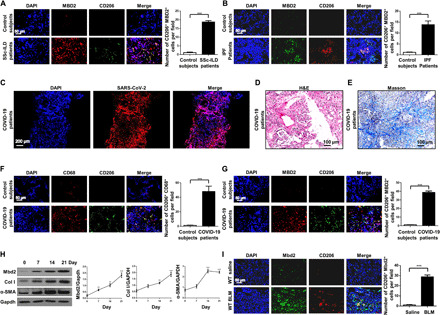
Fig. 1 Analysis of MBD2 expression in patients with PF and mice with BLM induction. (A and B) Representative results for coimmunostaining of MBD2 and CD206 in the lung sections from patients with SSc-ILD (A) and IPF (B). DAPI, 4′,6-diamidino-2-phenylindole. (C) Representative results for immunostaining of severe acute respiratory syndrome coronavirus 2 (SARS-CoV-2) in the lung sections from patients with COVID-19. The images were taken under original magnification of ×100. (D) Histological analysis [hematoxylin and eosin (H&E)] of the lung sections from patients with COVID-19. The images were taken under original magnification of ×200. (E) Histological analysis (Masson) of the lung sections from patients with COVID-19. The images were taken under original magnification of ×200. (F) Representative results for coimmunostaining of CD68 (a macrophage marker) and CD206 (an M2 marker) in the lung sections from patients with COVID-19. (G) Representative results for coimmunostaining of MBD2 and CD206 in the lung sections from patients with COVID-19. (H) Western blot analysis of Mbd2 and collagen I and α-SMA expression in the lungs of mice following BLM induction. Gapdh, glyceraldehyde-3-phosphate dehydrogenase. (I) Results for coimmunostaining of Mbd2 and CD206 in BLM-induced lung sections. The nuclei were stained blue by DAPI, and the images were taken under original magnification of ×400. A total of two patients with COVID-19, three patients with SSc-ILD, eight patients with IPF, and six control subjects were analyzed. Five mice were analyzed in each group. Col I, collagen I. The data are represented as the means ± SD. **P < 0.01 and ***P < 0.001.
Fig. 1 Analysis of MBD2 expression in patients with PF and mice with BLM induction. (A and B) Representative results for coimmunostaining of MBD2 and CD206 in the lung sections from patients with SSc-ILD (A) and IPF (B). DAPI, 4′,6-diamidino-2-phenylindole. (C) Representative results for immunostaining of severe acute respiratory syndrome coronavirus 2 (SARS-CoV-2) in the lung sections from patients with COVID-19. The images were taken under original magnification of ×100. (D) Histological analysis [hematoxylin and eosin (H&E)] of the lung sections from patients with COVID-19. The images were taken under original magnification of ×200. (E) Histological analysis (Masson) of the lung sections from patients with COVID-19. The images were taken under original magnification of ×200. (F) Representative results for coimmunostaining of CD68 (a macrophage marker) and CD206 (an M2 marker) in the lung sections from patients with COVID-19. (G) Representative results for coimmunostaining of MBD2 and CD206 in the lung sections from patients with COVID-19. (H) Western blot analysis of Mbd2 and collagen I and α-SMA expression in the lungs of mice following BLM induction. Gapdh, glyceraldehyde-3-phosphate dehydrogenase. (I) Results for coimmunostaining of Mbd2 and CD206 in BLM-induced lung sections. The nuclei were stained blue by DAPI, and the images were taken under original magnification of ×400. A total of two patients with COVID-19, three patients with SSc-ILD, eight patients with IPF, and six control subjects were analyzed. Five mice were analyzed in each group. Col I, collagen I. The data are represented as the means ± SD. **P < 0.01 and ***P < 0.001.CC BY-NC · PubMed Central
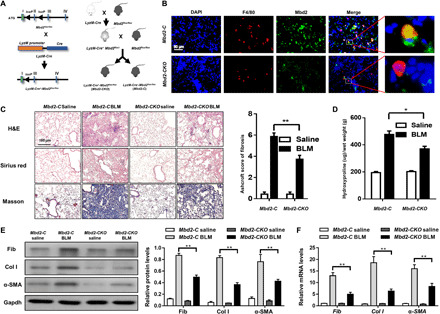
Fig. 2 Comparison of the severity of lung fibrosis between Mbd2-C and Mbd2-CKO mice after BLM induction. (A) Mbd2flox/flox mice were generated by inserting two loxP sequences in the same direction into the introns flanked with the exon 2 of MBD2 based on the CRISPR-Cas9 system, which could produce a nonfunctional MBD2 protein by generating a stop codon in exon 3 after Cre-mediated gene deletion. Mbd2flox/flox was then crossed with the LyzM-Cre transgenic mice to get the macrophage-specific Mbd2-knockout mice, which were named as LyzM-Cre+-Mbd2flox/flox. (B) Representative results for coimmunostaining of F4/80 and Mbd2 in the lung sections from Mbd2-C and Mbd2-CKO mice. Nuclei were stained blue by DAPI, and the images were taken at an original magnification of ×400. (C) Histological analysis of the severity of lung fibrosis in mice after BLM induction. Left: representative images for H&E (top), Sirius red (middle), and Masson staining (bottom). Right: a bar graph figure showing the quantitative mean score of the severity of fibrosis. Images were captured at ×200 magnification. (D) Quantification of hydroxyproline contents in Mbd2-C and Mbd2-CKO mice after BLM challenge. (E) Western blot analysis of fibronectin, collagen I, and α-SMA. (F) RT-PCR analysis of fibronectin, collagen I, and α-SMA. Seven mice were included in each study group. BLM, bleomycin; Col I, collagen I; Fib, fibronectin. The data are represented as the means ± SD. *P < 0.05 and **P < 0.01.
Fig. 2 Comparison of the severity of lung fibrosis between Mbd2-C and Mbd2-CKO mice after BLM induction. (A) Mbd2flox/flox mice were generated by inserting two loxP sequences in the same direction into the introns flanked with the exon 2 of MBD2 based on the CRISPR-Cas9 system, which could produce a nonfunctional MBD2 protein by generating a stop codon in exon 3 after Cre-mediated gene deletion. Mbd2flox/flox was then crossed with the LyzM-Cre transgenic mice to get the macrophage-specific Mbd2-knockout mice, which were named as LyzM-Cre+-Mbd2flox/flox. (B) Representative results for coimmunostaining of F4/80 and Mbd2 in the lung sections from Mbd2-C and Mbd2-CKO mice. Nuclei were stained blue by DAPI, and the images were taken at an original magnification of ×400. (C) Histological analysis of the severity of lung fibrosis in mice after BLM induction. Left: representative images for H&E (top), Sirius red (middle), and Masson staining (bottom). Right: a bar graph figure showing the quantitative mean score of the severity of fibrosis. Images were captured at ×200 magnification. (D) Quantification of hydroxyproline contents in Mbd2-C and Mbd2-CKO mice after BLM challenge. (E) Western blot analysis of fibronectin, collagen I, and α-SMA. (F) RT-PCR analysis of fibronectin, collagen I, and α-SMA. Seven mice were included in each study group. BLM, bleomycin; Col I, collagen I; Fib, fibronectin. The data are represented as the means ± SD. *P < 0.05 and **P < 0.01.CC BY-NC · PubMed Central
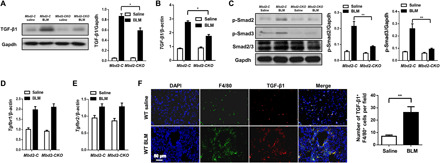
Fig. 3 Mbd2 deficiency repressed TGF-β/Smad signaling after BLM induction. (A) Western blot analysis of TGF-β1 expression in the lung homogenates. (B) Real-time PCR results for TGF-β1 expression in the lungs after BLM induction. (C) Western blot analysis of p-Smad2, p-Smad3, and Smad2/3 expression. Real-time PCR results for Tgfr1 (D) and Tgfr2 (E) expression in the lungs after BLM induction. (F) Coimmunostaining of TGF-β1 and F4/80 in the lung sections of WT mice. The images were taken under original magnification of ×400. Each bar represents the means ± SD of seven mice studied. *P < 0.05 and **P < 0.01.
Fig. 3 Mbd2 deficiency repressed TGF-β/Smad signaling after BLM induction. (A) Western blot analysis of TGF-β1 expression in the lung homogenates. (B) Real-time PCR results for TGF-β1 expression in the lungs after BLM induction. (C) Western blot analysis of p-Smad2, p-Smad3, and Smad2/3 expression. Real-time PCR results for Tgfr1 (D) and Tgfr2 (E) expression in the lungs after BLM induction. (F) Coimmunostaining of TGF-β1 and F4/80 in the lung sections of WT mice. The images were taken under original magnification of ×400. Each bar represents the means ± SD of seven mice studied. *P < 0.05 and **P < 0.01.CC BY-NC · PubMed Central
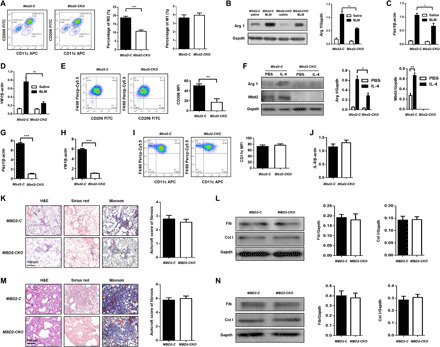
Fig. 4 Mbd2 was overexpressed by the infiltrated M2 macrophages in the lung following BLM induction. (A) Flow cytometry analysis of macrophages derived from lung tissues of Mbd2-C and Mbd2-CKO mice after BLM induction. FITC, fluorescein isothiocyanate. (B) Results for Arg 1 expression in the lung homogenates. Real-time PCR results for analysis of Fizz1 (C) and YM1 (D) expression in the lung. (E) Flow cytometry analysis of CD206 expression in BMDMs following IL-4 stimulation. (F) Results for Arg 1 and Mbd2 expression in the BMDMs after IL-4 induction. PBS, phosphate-buffered saline. Real-time PCR for analysis of Fizz1 (G) and YM1 (H) expression in the BMDMs after IL-4 induction. (I) Flow cytometry analysis of CD11c expression in BMDMs. (J) Real-time PCR analysis of IL-6 expression. (K) The severity of PF in Mbd2-C and Mbd2-CKO mice after depletion of macrophages. Left: representative results for H&E, Sirius red, and Masson staining. Right: a bar graph figure showing the semiquantitative Ashcroft scores for the severity of fibrosis. (L) Levels of fibronectin and collagen I in the lungs of macrophage-depleted Mbd2-C and Mbd2-CKO mice after BLM induction. (M) Results for adoptive transfer of WT macrophages into Mbd2-C and Mbd2-CKO mice following BLM induction. Left: representative results for H&E, Sirius red, and Masson staining. Right: the semiquantitative Ashcroft scores relevant to the severity of fibrosis. (N) Western blotting for analysis of collagen I and fibronectin expression. All images were captured at ×200 magnification, and seven mice were included in each study group. Arg 1, arginase 1; BMDMs, bone marrow–derived macrophages; Fizz1, found in inflammatory zone 1; YM1, chitinase 3–like 3; Col I, collagen I; Fib, fibronectin; MFI, mean fluorescence intensity. The data are represented as the means ± SD. *P < 0.05, **P < 0.01, and ***P < 0.001.
Fig. 4 Mbd2 was overexpressed by the infiltrated M2 macrophages in the lung following BLM induction. (A) Flow cytometry analysis of macrophages derived from lung tissues of Mbd2-C and Mbd2-CKO mice after BLM induction. FITC, fluorescein isothiocyanate. (B) Results for Arg 1 expression in the lung homogenates. Real-time PCR results for analysis of Fizz1 (C) and YM1 (D) expression in the lung. (E) Flow cytometry analysis of CD206 expression in BMDMs following IL-4 stimulation. (F) Results for Arg 1 and Mbd2 expression in the BMDMs after IL-4 induction. PBS, phosphate-buffered saline. Real-time PCR for analysis of Fizz1 (G) and YM1 (H) expression in the BMDMs after IL-4 induction. (I) Flow cytometry analysis of CD11c expression in BMDMs. (J) Real-time PCR analysis of IL-6 expression. (K) The severity of PF in Mbd2-C and Mbd2-CKO mice after depletion of macrophages. Left: representative results for H&E, Sirius red, and Masson staining. Right: a bar graph figure showing the semiquantitative Ashcroft scores for the severity of fibrosis. (L) Levels of fibronectin and collagen I in the lungs of macrophage-depleted Mbd2-C and Mbd2-CKO mice after BLM induction. (M) Results for adoptive transfer of WT macrophages into Mbd2-C and Mbd2-CKO mice following BLM induction. Left: representative results for H&E, Sirius red, and Masson staining. Right: the semiquantitative Ashcroft scores relevant to the severity of fibrosis. (N) Western blotting for analysis of collagen I and fibronectin expression. All images were captured at ×200 magnification, and seven mice were included in each study group. Arg 1, arginase 1; BMDMs, bone marrow–derived macrophages; Fizz1, found in inflammatory zone 1; YM1, chitinase 3–like 3; Col I, collagen I; Fib, fibronectin; MFI, mean fluorescence intensity. The data are represented as the means ± SD. *P < 0.05, **P < 0.01, and ***P < 0.001.CC BY-NC · PubMed Central
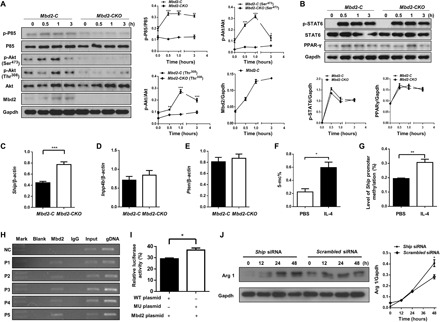
Fig. 5 Loss of Mbd2 attenuated IL-4–induced PI3K/Akt signaling in macrophages. (A) Analysis of IL-4–induced PI3K/Akt signaling in macrophages. (B) Results for time course Western blot analysis of STAT6, p-STAT6, and PPAR-γ expression in BMDM following IL-4 stimulation. Real-time PCR for analysis of Ship (C), Inpp4b (D), and Pten (E) expression in IL4-induced BMDMs. (F) Global DNA methylation rate in BMDMs after IL-4 treatment. (G) Results for the bisulfite DNA sequencing analysis of the Ship promoter. (H) ChIP results for the analysis of Mbd2 binding activity to the Ship promoter. The distal region of Ship promoter [−1770 to −1540 base pairs (bp)] was served as a negative control. gDNA, guide DNA; MU, mutant. (I) Relative luciferase activity in BMDMs. (J) Results for a time course Western blot analysis of Arg 1 expression in IL-4–induced Mbd2-CKO BMDMs transfected with Scrambled or Ship siRNA. Ship, SH2-containing inositol 5′-phosphatase; Arg 1, arginase 1; NC, negative control. The data are represented as the means ± SEM. *P < 0.05, **P < 0.01, and ***P < 0.001.
Fig. 5 Loss of Mbd2 attenuated IL-4–induced PI3K/Akt signaling in macrophages. (A) Analysis of IL-4–induced PI3K/Akt signaling in macrophages. (B) Results for time course Western blot analysis of STAT6, p-STAT6, and PPAR-γ expression in BMDM following IL-4 stimulation. Real-time PCR for analysis of Ship (C), Inpp4b (D), and Pten (E) expression in IL4-induced BMDMs. (F) Global DNA methylation rate in BMDMs after IL-4 treatment. (G) Results for the bisulfite DNA sequencing analysis of the Ship promoter. (H) ChIP results for the analysis of Mbd2 binding activity to the Ship promoter. The distal region of Ship promoter [−1770 to −1540 base pairs (bp)] was served as a negative control. gDNA, guide DNA; MU, mutant. (I) Relative luciferase activity in BMDMs. (J) Results for a time course Western blot analysis of Arg 1 expression in IL-4–induced Mbd2-CKO BMDMs transfected with Scrambled or Ship siRNA. Ship, SH2-containing inositol 5′-phosphatase; Arg 1, arginase 1; NC, negative control. The data are represented as the means ± SEM. *P < 0.05, **P < 0.01, and ***P < 0.001.CC BY-NC · PubMed Central
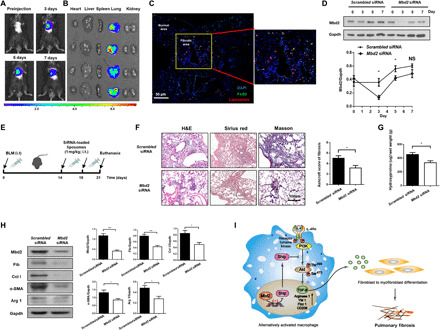
Fig. 6 Intratracheal administration of Mbd2 siRNA–loaded liposomes protected mice from BLM-induced lung injury and fibrosis. (A) Representative IVIS images of the mouse administrated with DiR-labeled liposomes. (B) Ex vivo fluorescence images of major organs from mice. (C) Confocal immunofluorescence image for the biodistribution of liposomes in lungs from BLM-induced mice. Images were captured at ×200 magnification. (D) Temporal Mbd2 expression changes in the lungs from liposome administered mice, and four mice were included in each study group. (E) Schematic for experimental design and time line of BLM-treated WT mice administered with either Scrambled or Mbd2 siRNA–loaded liposomes. (F) Intratracheal administration of Mbd2 siRNA–loaded liposomes provided protection for mice against BLM-induced lung injury and fibrosis. Left: representative results for H&E, Sirius red, and Masson staining. Right: the semiquantitative Ashcroft scores relevant to the severity of fibrosis. Images were captured at ×200 magnification. (G) Quantification of hydroxyproline contents in mice after BLM challenge. Six mice were included in each study group. (H) Western blot analysis of Mbd2, fibronectin, collagen I, α-SMA, and Arg 1 expression in the lungs. (I) Mbd2 selectively bound to the Ship promoter in macrophages, by which it repressed Ship expression and enhanced PI3K/Akt signaling to promote macrophage M2 program. Upon activation, M2 macrophages secreted high levels of TGF-β1 into the milieu of lung fibroblasts, which then induced the progression of PF. i.t., intratracheal injection; Col I, collagen I; Fib, fibronectin; Arg 1, arginase 1. The data are represented as the means ± SD. *P < 0.05 and ***P < 0.001.
Fig. 6 Intratracheal administration of Mbd2 siRNA–loaded liposomes protected mice from BLM-induced lung injury and fibrosis. (A) Representative IVIS images of the mouse administrated with DiR-labeled liposomes. (B) Ex vivo fluorescence images of major organs from mice. (C) Confocal immunofluorescence image for the biodistribution of liposomes in lungs from BLM-induced mice. Images were captured at ×200 magnification. (D) Temporal Mbd2 expression changes in the lungs from liposome administered mice, and four mice were included in each study group. (E) Schematic for experimental design and time line of BLM-treated WT mice administered with either Scrambled or Mbd2 siRNA–loaded liposomes. (F) Intratracheal administration of Mbd2 siRNA–loaded liposomes provided protection for mice against BLM-induced lung injury and fibrosis. Left: representative results for H&E, Sirius red, and Masson staining. Right: the semiquantitative Ashcroft scores relevant to the severity of fibrosis. Images were captured at ×200 magnification. (G) Quantification of hydroxyproline contents in mice after BLM challenge. Six mice were included in each study group. (H) Western blot analysis of Mbd2, fibronectin, collagen I, α-SMA, and Arg 1 expression in the lungs. (I) Mbd2 selectively bound to the Ship promoter in macrophages, by which it repressed Ship expression and enhanced PI3K/Akt signaling to promote macrophage M2 program. Upon activation, M2 macrophages secreted high levels of TGF-β1 into the milieu of lung fibroblasts, which then induced the progression of PF. i.t., intratracheal injection; Col I, collagen I; Fib, fibronectin; Arg 1, arginase 1. The data are represented as the means ± SD. *P < 0.05 and ***P < 0.001.CC BY-NC · PubMed Central

Verification

Claims the paper makes

The claims and statistics of this paper haven’t been checked yet.

Run the check — free, no account needed. It reads the open-access text and checks the sources it cites.

A few free checks a day · papers already verified open instantly · results are public

Claims other papers make about this one

Each is checked against this paper’s own text: does it say what the citing paper says it does?

Self-check

Percentages, sums and reported differences re-computed from the paper’s own numbers.

The self-check needs the paper’s full text.

Citations

Cites

Show all 55 references

Cited by

Sorted by citations

See all 228

Metadata

Authors
Wang, Y., Zhang, L., Wu, G.-R., Zhou, Q., Yue, H., Rao, L.-Z., Yuan, T., Mo, B., Wang, F.-X., Chen, L.-M., Sun, F., Song, J., Xiong, F., Zhang, S., Yu, Q., Yang, P., Xu, Y., Zhao, J., Zhang, H., Xiong, W., & Wang, C.-Y.
Affiliations
  • Tongji Hospital (CN)
  • The Center for Biomedical Research, NHC Key Laboratory of Respiratory Diseases, Department of Respiratory and Critical Care Medicine, Tongji Hospital, Tongji Medical College, Huazhong University of Sciences and Technology, 1095 Jiefang Ave., Wuhan 430030, China.
  • Guilin Medical University (CN)
  • Shanghai Jiao Tong University (CN)
Corresponding author
  • Zhang, Huilan
  • Xiong, Weining
  • Wang, Cong-Yi
Venue
Science Advances
Published
2021-01
Volume
7
Issue
1
ISSN
2375-2548 (ISSN-L)
OpenAlex
W3107456091
Cited by
227
References
55
Citations by year
2026: 32 · 2025: 49 · 2024: 49 · 2023: 37 · 2022: 39 · 2021: 19
FWCI
23.54
Type
journal article
Language
en
Open access
Locations
  • Science Advances (publishedVersion, cc-by-nc)
  • Europe PMC (PubMed Central) (publishedVersion, cc-by-nc)
  • PubMed Central (publishedVersion, cc-by-nc)
  • PubMed (publishedVersion)
Funders
  • Ministry of Science and Technology (2016YFC1305002 and 2017YFC1309603)
  • National Natural Science Foundation of China (81530024, 9174920038, 81800068, 81920108009, 81770823 and 81670729)
  • NHC Drug Discovery Program (2017ZX09304022-07)
  • the Department of Science and Technology of Hubei Province (2017ACA096)
Topics
  • Health Sciences › Medicine › Pulmonary and Respiratory Medicine › Interstitial Lung Diseases and Idiopathic Pulmonary Fibrosis
  • Health Sciences › Medicine › Rheumatology › Systemic Sclerosis and Related Diseases
  • Health Sciences › Medicine › Pulmonary and Respiratory Medicine › Occupational and environmental lung diseases
Keywords
MBD2, pulmonary fibrosis, M2 macrophages, macrophage polarization, siRNA, therapeutic target
MeSH terms
COVID-19, Animals, Bleomycin, Carcinoma, Non-Small-Cell Lung, DNA-Binding Proteins, Fibrosis, Gene Expression Regulation, Humans, Liposomes, Lung Neoplasms, Macrophages, Male, Mice, Inbred C57BL, Pulmonary Fibrosis, Scleroderma, Systemic, Signal Transduction, Lung Diseases, Interstitial, Mice, Knockout, Gene Expression Profiling, RNA, Small Interfering, Mice, Transforming Growth Factor beta1

About these checks

Registry, retraction, Cites and statistics results are computed, not judged, with one exception: a printed reference that no index lists is read once by a model before it counts as a citation error. Claims are extracted by a model and kept only when their quote appears verbatim in the text; each cited source is then checked, with a model’s help, for whether it says what the claim relies on. Those verdicts can be wrong — read the claim’s quote and the cited source before relying on one.

Statistics and arithmetic are recomputed, not judged.

Confidence bands are shown only for fields calibrated on our annotated test set. None is calibrated yet, so no band is shown.

What counts as a claim ›How we measure confidence ›How we check this ›

Are you an author, or do you see a problem with this page? Request a review