Cited by 47

The DOI matches its Crossref record; 4 of the 4 references it cites were found in a registry or an index.

Patient-derived exosomes facilitate therapeutic targeting of oncogenic MET in advanced gastric cancer

Hyung, Sujin, Ko, Jihoon, Heo, You Jeong, Blum, Steven M., Kim, Seung Tae, Park, Se Hoon, Park, Joon Oh, Kang, Won Ki, Lim, Ho Yeong, Klempner, Samuel J., Lee, Jeeyun·2023·Science Advances

Abstract

Gastric cancer (GC) with peritoneal metastases and malignant ascites continues to have poor prognosis. Exosomes mediate intercellular communication during cancer progression and promote therapeutic resistance. Here, we report the significance of exosomes derived from malignant ascites (EXO Ascites ) in cancer progression and use modified exosomes as resources for cancer therapy. EXO Ascites from patients with GC stimulated invasiveness and angiogenesis in an ex vivo three-dimensional autologous tumor spheroid microfluidic system. EXO Ascites concentration increased invasiveness, and blockade of their secretion suppressed tumor progression. In MET -amplified GC, EXO Ascites contain abundant MET; their selective delivery to tumor cells enhanced angiogenesis and invasiveness. Exosomal MET depletion substantially reduced invasiveness; an additive therapeutic effect was induced when combined with MET and/or VEGFR2 inhibition in a patient-derived MET -amplified GC model. Allogeneic MET-harboring exosome delivery induced invasion and angiogenesis in a MET non-amplified GC model. MET -amplified patient tissues showed higher exosome concentration than their adjacent normal tissues. Manipulating exosome content and production may be a promising complementary strategy against GC.

Overview

The claims and statistics of this paper haven’t been checked yet.

Run the check — free, no account needed. It reads the open-access text and checks the sources it cites.

A few free checks a day · papers already verified open instantly · results are public

Integrity signals

Registry

Crossref · 10.1126/sciadv.adk1098

Cites

4 of 4 references verified0 citation errors · 0 not checkable

Statistics

Figures

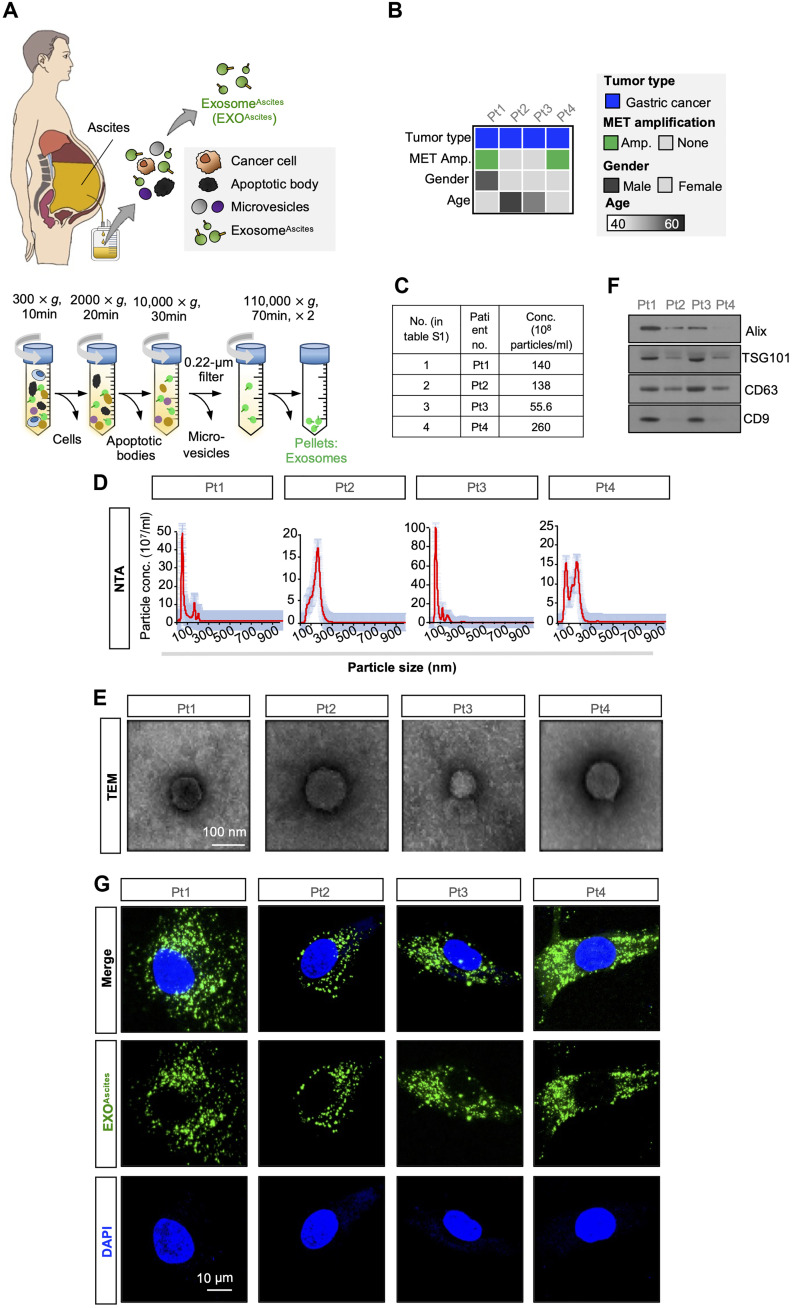
Fig. 1. Characterization of exosomes isolated from ascites of patients with cancer. (A) Schematics of a patient ascites collection, including exosomes and cancer cells (top). To isolate pure exosomes from ascites, an ultracentrifugation method (see Materials and Methods) was performed to isolate exosome pellets from each patient (EXOAscites), and the EXOAscites concentration was then measured through NTA. (B) Clinical information of each cancer patient, including cancer type, MET amplification status, gender, and age. (C) Table of the exosome concentrations. (D) Size distributions of isolated particles from ascites. (E) Representative TEM images demonstrating a round, cup-shaped morphology of EXOAscites. Scale bar, 100 μm. (F) Western blot analysis of purified EXOAscites showing MVB biogenesis proteins (e.g., Alix and TSG101) and tetraspanins (e.g., CD63 and CD9), which are frequently identified in exosomes. (G) Representative confocal microscopy images showing EXOAscites uptake into each patient-derived cancer cell (PDC). EXOAscites labeled with PKH67 (green) and nuclei are stained with 4′,6-diamidino-2-phenylindole (“DAPI”; blue). Scale bar, 10 μm.
Fig. 1. Characterization of exosomes isolated from ascites of patients with cancer. (A) Schematics of a patient ascites collection, including exosomes and cancer cells (top). To isolate pure exosomes from ascites, an ultracentrifugation method (see Materials and Methods) was performed to isolate exosome pellets from each patient (EXOAscites), and the EXOAscites concentration was then measured through NTA. (B) Clinical information of each cancer patient, including cancer type, MET amplification status, gender, and age. (C) Table of the exosome concentrations. (D) Size distributions of isolated particles from ascites. (E) Representative TEM images demonstrating a round, cup-shaped morphology of EXOAscites. Scale bar, 100 μm. (F) Western blot analysis of purified EXOAscites showing MVB biogenesis proteins (e.g., Alix and TSG101) and tetraspanins (e.g., CD63 and CD9), which are frequently identified in exosomes. (G) Representative confocal microscopy images showing EXOAscites uptake into each patient-derived cancer cell (PDC). EXOAscites labeled with PKH67 (green) and nuclei are stained with 4′,6-diamidino-2-phenylindole (“DAPI”; blue). Scale bar, 10 μm.CC BY-NC · PubMed Central
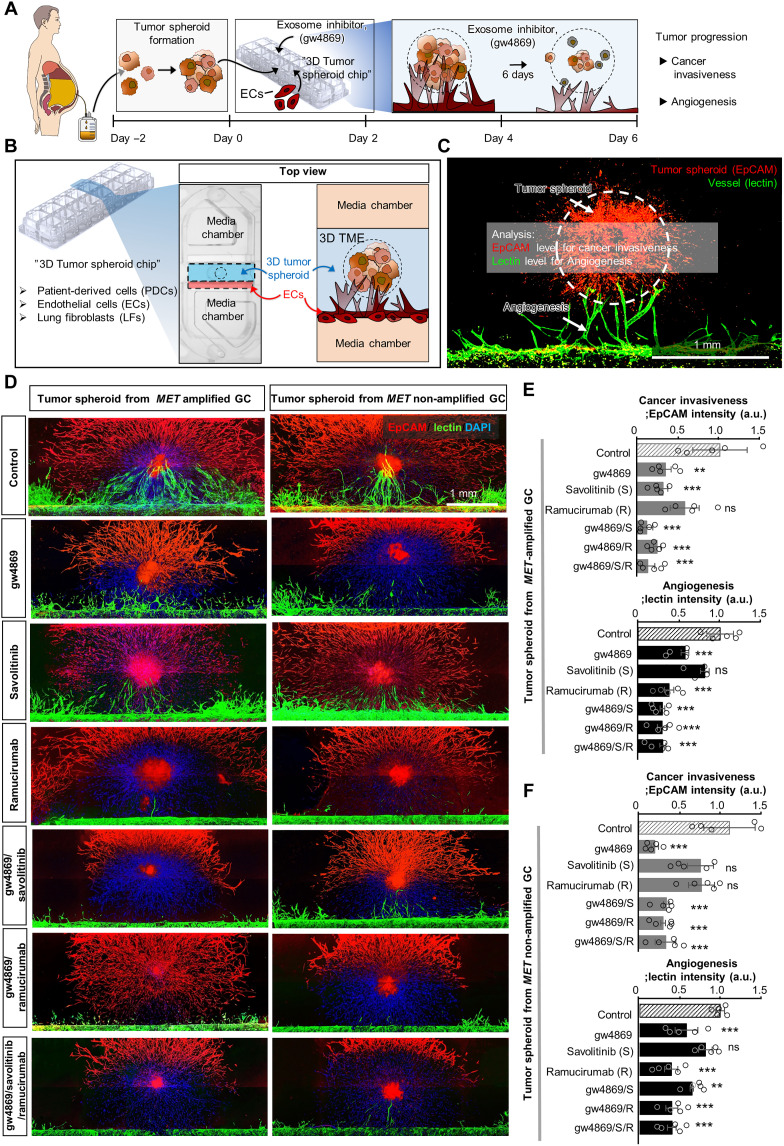
Fig. 2. Reduced cancer invasiveness via the blockade of exosome secretion with gw4869. To examine the effect of exosomes on cancer invasiveness in our 3D spheroid system, the effects of targeted therapies and gw4869, which depletes exosome formation, were explored. Schematic illustration of the process used to verify the effect of exosome depletion on cancer progression (A) and the 3D tumor spheroid angiogenesis model on a chip. To test this, we used 10 μM gw4869, 1 μM savolitinib, and/or 1 μM ramucirumab. (B) Top view of one well showing the 3D tumor spheroid culture zone and extracellular matrix (sky blue), EC zone (red), and two “media chamber” zones (orange) in (B). The ECs gradually moved toward the 3D tumor spheroids. Fixed samples were immunostained with antibodies against EpCAM (for cancer; red) and lectin (for ECs; green) and counterstained with DAPI (blue) on day 6. (C) Representative 3D tumor spheroid angiogenesis images were acquired after staining tumor spheroids (EpCAM; red) and vessels (lectin; green). Scale bar, 1 mm. (D) Representative confocal images of tumor spheroids (EpCAM; red) and vessels (lectin; green) counterstained with DAPI (blue). Scale bar, 1 mm. Quantification of cancer invasiveness and angiogenesis based on images of tumor spheroids from MET-amplified GC (E) and non-MET-amplified GC models, shown in (D) and (F). n = 5; **P < 0.01 and ***P < 0.001 compared with the control [analysis of variance (ANOVA) with Tukey’s multiple comparisons test]. ns, respectively, indicating no significant differences. a.u., arbitrary units.
Fig. 2. Reduced cancer invasiveness via the blockade of exosome secretion with gw4869. To examine the effect of exosomes on cancer invasiveness in our 3D spheroid system, the effects of targeted therapies and gw4869, which depletes exosome formation, were explored. Schematic illustration of the process used to verify the effect of exosome depletion on cancer progression (A) and the 3D tumor spheroid angiogenesis model on a chip. To test this, we used 10 μM gw4869, 1 μM savolitinib, and/or 1 μM ramucirumab. (B) Top view of one well showing the 3D tumor spheroid culture zone and extracellular matrix (sky blue), EC zone (red), and two “media chamber” zones (orange) in (B). The ECs gradually moved toward the 3D tumor spheroids. Fixed samples were immunostained with antibodies against EpCAM (for cancer; red) and lectin (for ECs; green) and counterstained with DAPI (blue) on day 6. (C) Representative 3D tumor spheroid angiogenesis images were acquired after staining tumor spheroids (EpCAM; red) and vessels (lectin; green). Scale bar, 1 mm. (D) Representative confocal images of tumor spheroids (EpCAM; red) and vessels (lectin; green) counterstained with DAPI (blue). Scale bar, 1 mm. Quantification of cancer invasiveness and angiogenesis based on images of tumor spheroids from MET-amplified GC (E) and non-MET-amplified GC models, shown in (D) and (F). n = 5; **P < 0.01 and ***P < 0.001 compared with the control [analysis of variance (ANOVA) with Tukey’s multiple comparisons test]. ns, respectively, indicating no significant differences. a.u., arbitrary units.CC BY-NC · PubMed Central
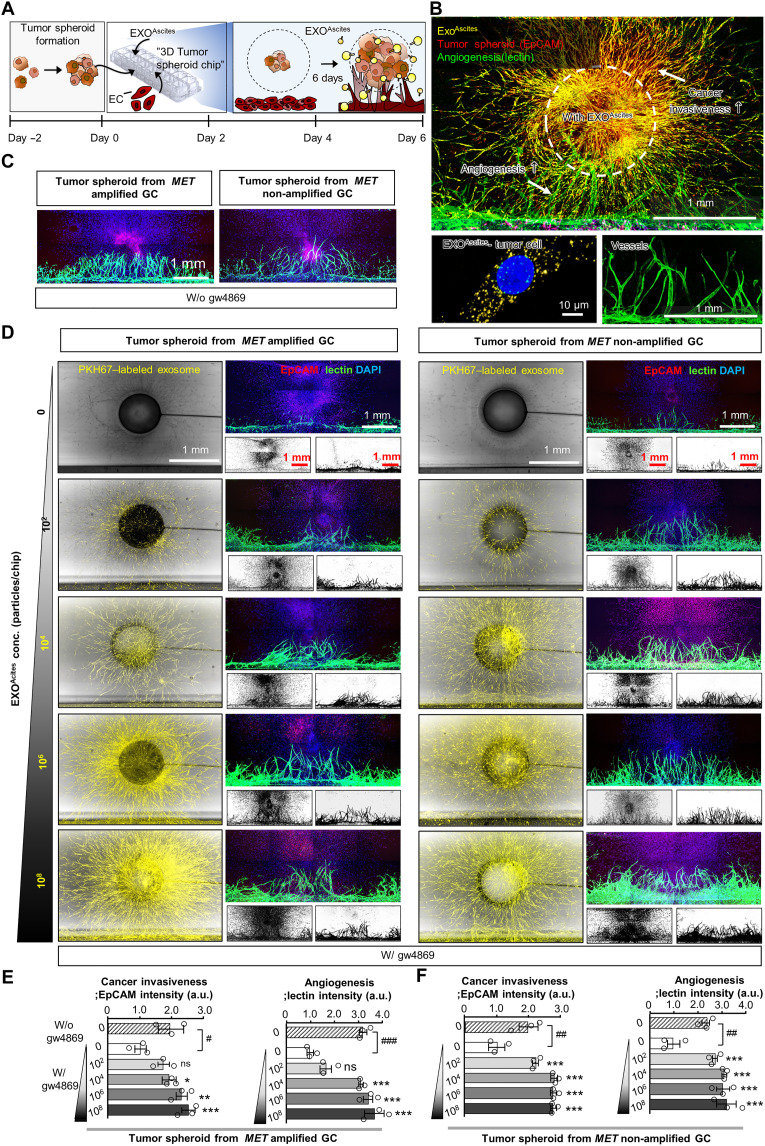
Fig. 3. Gradual enhancement of cancer invasiveness and angiogenesis by EXOAscites. To measure the role of EXOAscites in cancer invasion, EXOAscites from four patients were examined using our 3D tumor spheroid chip model with the addition of EXOAscites and gw4869. (A) Schematic showing the role of EXOAscites in cancer progression based on a tumor spheroid angiogenesis model. Cancer invasiveness and angiogenesis in the 3D models for all patients treated with EXOAscites (at concentrations of 0, 102, 104, 106, and 108, as indicated) were measured by immunocytochemistry on day 6. Fixed samples were immunostained with antibodies against EpCAM (for cancer, red) and lectin (for EC, green) and counterstained with DAPI (blue). (B) Representative 3D tumor spheroid angiogenesis images by staining with PKH67-EXOAscites (yellow), tumor spheroid (EpCAM, red), and vessels (lectin, green); enlarged images depict PKH67-labeled EXOAscites into the tumor cell (left) and vessels (right). Scale bars, 1 mm and 10 μm. (C and D) Representative images of the coculture showing changes in cancer invasion and angiogenesis among concentrations of EXOAscites (as indicated above) in the tumor spheroid from a MET-amplified and a MET non-amplified GC model; PKH67-labeled EXOAscites with bright-field imaging of the chip is shown in the left, immunolabeled confocal images with EpCAM, lectin, and DAPI are shown on the top of right, and inverted microscope image of coculture shown on the bottom of right in (D). Quantification of cancer invasiveness (E) and angiogenesis (F) for the images shown in (C) and (D). n = 3 ± SEM. Scale bar, 1 mm. #P < 0.05, ##P < 0.01, and ###P < 0.001 compared with 10 μM gw4869. *P < 0.05, **P < 0.01, and ***P < 0.001 compared with each value at 0 particles/ml EXOAscites. Notably, the EXOAscites of all patients (n = 4) induced cancer invasion. Scale bar, 1 mm.
Fig. 3. Gradual enhancement of cancer invasiveness and angiogenesis by EXOAscites. To measure the role of EXOAscites in cancer invasion, EXOAscites from four patients were examined using our 3D tumor spheroid chip model with the addition of EXOAscites and gw4869. (A) Schematic showing the role of EXOAscites in cancer progression based on a tumor spheroid angiogenesis model. Cancer invasiveness and angiogenesis in the 3D models for all patients treated with EXOAscites (at concentrations of 0, 102, 104, 106, and 108, as indicated) were measured by immunocytochemistry on day 6. Fixed samples were immunostained with antibodies against EpCAM (for cancer, red) and lectin (for EC, green) and counterstained with DAPI (blue). (B) Representative 3D tumor spheroid angiogenesis images by staining with PKH67-EXOAscites (yellow), tumor spheroid (EpCAM, red), and vessels (lectin, green); enlarged images depict PKH67-labeled EXOAscites into the tumor cell (left) and vessels (right). Scale bars, 1 mm and 10 μm. (C and D) Representative images of the coculture showing changes in cancer invasion and angiogenesis among concentrations of EXOAscites (as indicated above) in the tumor spheroid from a MET-amplified and a MET non-amplified GC model; PKH67-labeled EXOAscites with bright-field imaging of the chip is shown in the left, immunolabeled confocal images with EpCAM, lectin, and DAPI are shown on the top of right, and inverted microscope image of coculture shown on the bottom of right in (D). Quantification of cancer invasiveness (E) and angiogenesis (F) for the images shown in (C) and (D). n = 3 ± SEM. Scale bar, 1 mm. #P < 0.05, ##P < 0.01, and ###P < 0.001 compared with 10 μM gw4869. *P < 0.05, **P < 0.01, and ***P < 0.001 compared with each value at 0 particles/ml EXOAscites. Notably, the EXOAscites of all patients (n = 4) induced cancer invasion. Scale bar, 1 mm.CC BY-NC · PubMed Central
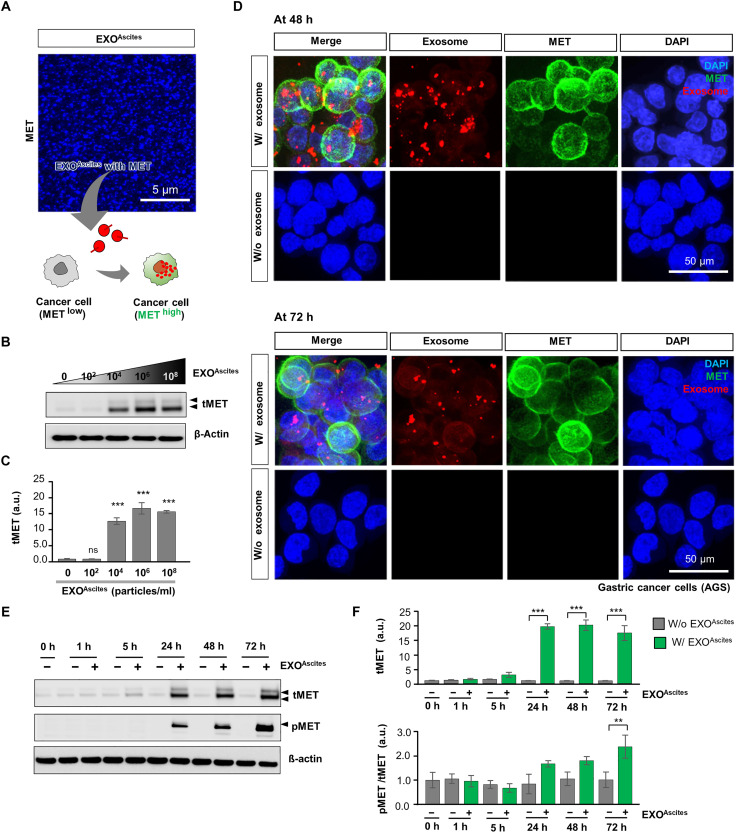
Fig. 4. Efficient intracellular delivery of EXOAscites harboring MET into MET low GC. (A) Representative confocal images showing EXOAscites capturing MET through ExoView R100 imaging platform (top) and schematic illustration of the transformation of MET low GC cells into MET high cancer cells by EXOAscites harboring MET. Scale bar, 5 μm. (B and C) Representative immunoblots and quantification of tMET level by EXOAscites (at concentrations of 0, 102, 104, 106, and 108 particles/ml, as indicated). β-Actin was used as a loading control. ***P < 0.001 compared with each value at 0 particles/ml EXOAscites. (D) Representative confocal fluorescence images of MET low-expressed cancer cells with and without EXOAscites (106 particles/ml, red) capturing MET (green) at 48 (top) and 72 hours (bottom). Scale bars, 50 μm. (E and F) Immunoblots and quantifications of tMET and pMET with or without EXOAscites capturing MET (at 0, 1, 5, 24, 48, and 72 hours). pMET/tMET level is shown in (F) (bottom). Samples were treated with EXOAscites (106 particles/ml). β-Actin was used as a loading control. n = 3 ± SEM. **P < 0.01 and ***P < 0.001 compared with each value at 0 hours. Note that the potential uptake of EXOAscites with MET into the MET low expressed-GC (AGS) induces the promotion of MET expression.
Fig. 4. Efficient intracellular delivery of EXOAscites harboring MET into MET low GC. (A) Representative confocal images showing EXOAscites capturing MET through ExoView R100 imaging platform (top) and schematic illustration of the transformation of MET low GC cells into MET high cancer cells by EXOAscites harboring MET. Scale bar, 5 μm. (B and C) Representative immunoblots and quantification of tMET level by EXOAscites (at concentrations of 0, 102, 104, 106, and 108 particles/ml, as indicated). β-Actin was used as a loading control. ***P < 0.001 compared with each value at 0 particles/ml EXOAscites. (D) Representative confocal fluorescence images of MET low-expressed cancer cells with and without EXOAscites (106 particles/ml, red) capturing MET (green) at 48 (top) and 72 hours (bottom). Scale bars, 50 μm. (E and F) Immunoblots and quantifications of tMET and pMET with or without EXOAscites capturing MET (at 0, 1, 5, 24, 48, and 72 hours). pMET/tMET level is shown in (F) (bottom). Samples were treated with EXOAscites (106 particles/ml). β-Actin was used as a loading control. n = 3 ± SEM. **P < 0.01 and ***P < 0.001 compared with each value at 0 hours. Note that the potential uptake of EXOAscites with MET into the MET low expressed-GC (AGS) induces the promotion of MET expression.CC BY-NC · PubMed Central
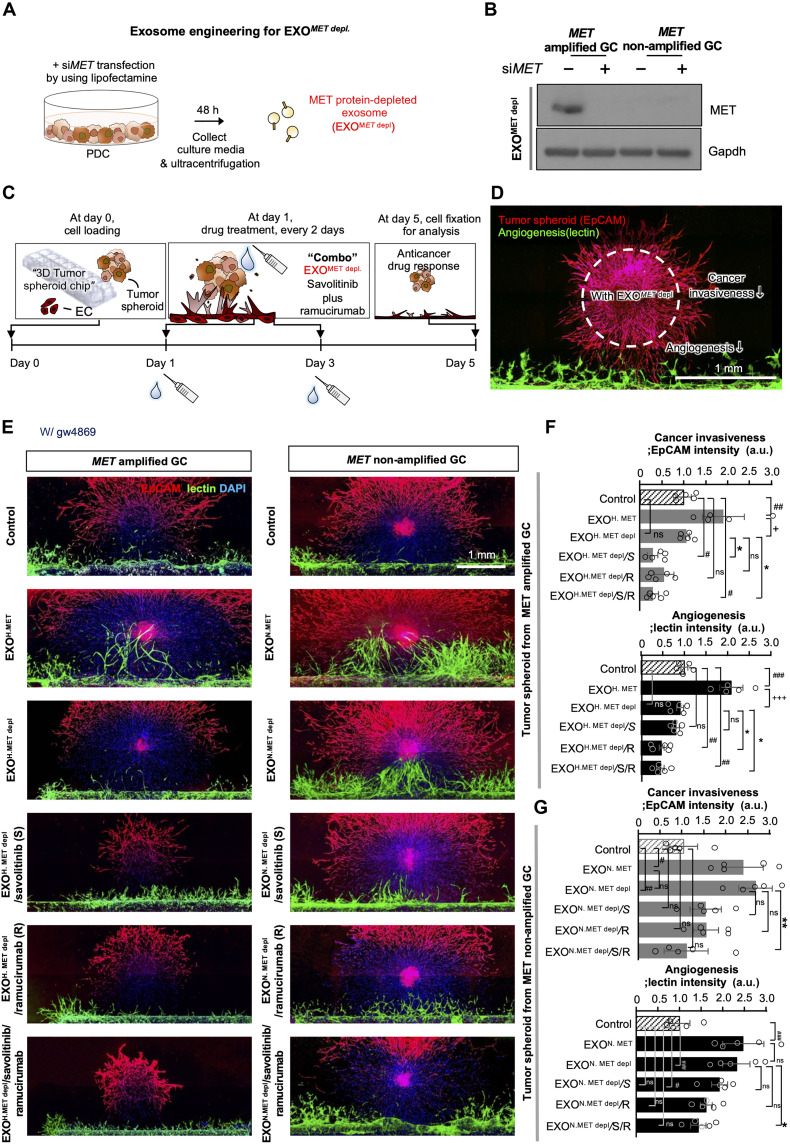
Fig. 5. Therapeutic effect of engineered EXOMET depl in the MET-amplified GC model. (A) siMET (10 nM) was transfected on cultured PDCs using Lipofectamine and incubated for 48 hours before collecting conditioned media. EXOMET depl were isolated by ultracentrifugation. (B) Representative immunoblots of MET in exosomes treated with or without siMET on MET-amplified GC or MET non-amplified GC. To construct the engineered EXOMET depletion, siMET (10 nM) was transfected into cultured MET-amplified GC and MET non-amplified GC. We referred to EXOAscites harboring MET as “EXOH. MET,” MET depletion from MET amp PDCs as “EXOH. MET depl,” EXOAscites null MET as “EXON. MET,” and MET depletion from MET non-amp PDCs as “EXON. MET depl.” Gapdh was used as the loading control. Note that MET was completely depleted only in the MET-amplified GC model. (C) Schematic illustration of the therapeutic effect of EXOMET depl in the 3D tumor spheroid angiogenesis model. (D) Representative 3D tumor spheroid angiogenesis images were acquired after staining the tumor spheroids (EpCAM; red) and vessels (lectin; green). Scale bar, 1 mm. (E) Representative confocal images demonstrating tumor spheroids (EpCAM; red) and vessels (lectin; green) counterstained with DAPI (blue) in the tumor spheroid MET-amplified and non-MET-amplified GC models. A total of 106 particles per chip of EXOAscites or EXOMET depl were treated in this medium and maintained during culture. Quantification of cancer invasiveness and angiogenesis based on the images of tumor spheroids from the MET-amplified (F) and non-MET-amplified (G) GC models in (E). n = 5, #P < 0.05, ##P < 0.01, ###P < 0.001, +P < 0.05, +++P < 0.001, *P < 0.05, and **P < 0.01 compared to the control, EXOAscites (EXOH. MET or EXON. MET), or EXOMET depl (EXOH. MET depl or EXON. MET depl) (ANOVA with Tukey’s multiple comparisons test). gw4869-treated samples served as the control. Scale bar, 1 mm.
Fig. 5. Therapeutic effect of engineered EXOMET depl in the MET-amplified GC model. (A) siMET (10 nM) was transfected on cultured PDCs using Lipofectamine and incubated for 48 hours before collecting conditioned media. EXOMET depl were isolated by ultracentrifugation. (B) Representative immunoblots of MET in exosomes treated with or without siMET on MET-amplified GC or MET non-amplified GC. To construct the engineered EXOMET depletion, siMET (10 nM) was transfected into cultured MET-amplified GC and MET non-amplified GC. We referred to EXOAscites harboring MET as “EXOH. MET,” MET depletion from MET amp PDCs as “EXOH. MET depl,” EXOAscites null MET as “EXON. MET,” and MET depletion from MET non-amp PDCs as “EXON. MET depl.” Gapdh was used as the loading control. Note that MET was completely depleted only in the MET-amplified GC model. (C) Schematic illustration of the therapeutic effect of EXOMET depl in the 3D tumor spheroid angiogenesis model. (D) Representative 3D tumor spheroid angiogenesis images were acquired after staining the tumor spheroids (EpCAM; red) and vessels (lectin; green). Scale bar, 1 mm. (E) Representative confocal images demonstrating tumor spheroids (EpCAM; red) and vessels (lectin; green) counterstained with DAPI (blue) in the tumor spheroid MET-amplified and non-MET-amplified GC models. A total of 106 particles per chip of EXOAscites or EXOMET depl were treated in this medium and maintained during culture. Quantification of cancer invasiveness and angiogenesis based on the images of tumor spheroids from the MET-amplified (F) and non-MET-amplified (G) GC models in (E). n = 5, #P < 0.05, ##P < 0.01, ###P < 0.001, +P < 0.05, +++P < 0.001, *P < 0.05, and **P < 0.01 compared to the control, EXOAscites (EXOH. MET or EXON. MET), or EXOMET depl (EXOH. MET depl or EXON. MET depl) (ANOVA with Tukey’s multiple comparisons test). gw4869-treated samples served as the control. Scale bar, 1 mm.CC BY-NC · PubMed Central
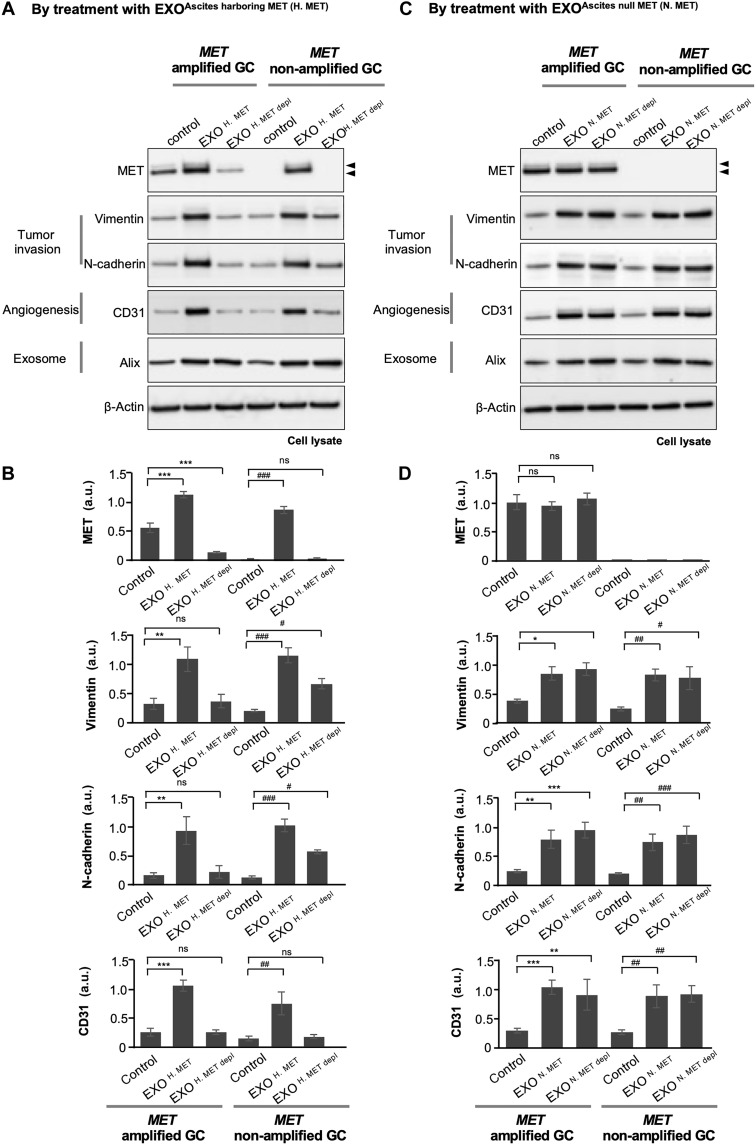
Fig. 6. Autologous and allogenic delivery of EXOAscites harboring MET in a GC model with MET amplification and non-amplification. Cocultures of MET-amplified GC or MET non-amplified GC were treated with exosome to analyze the delivery of exosomes harboring EXOH. MET, engineered EXOH. MET depl, EXON. MET, or engineered EXON. MET depl. 3D cancer-angiogenesis models were treated with 106 particles per chip of EXOAscites (EXOH. MET and EXON. MET) or EXOMET depl (EXOH. MET depl and EXON. MET depl) on day 1 and was maintained during the culture. Lysed samples were collected on day 5. The protein levels of MET, vimentin, N-cadherin (cancer invasiveness), CD31 (angiogenesis), and Alix (exosomes) were analyzed by Western blotting. Immunoblots and MET, vimentin, N-cadherin, CD31, and Alix levels were measured using EXOH. MET, and engineered EXOH. MET depl are shown (A) and quantified (B), or EXON. MET and engineered EXON. MET depl (C and D) are shown. β-Actin was used as a loading control. n = 3 ± SEM *,#P < 0.05, **,##P < 0.01, and ***,###P < 0.001 compared to the control.
Fig. 6. Autologous and allogenic delivery of EXOAscites harboring MET in a GC model with MET amplification and non-amplification. Cocultures of MET-amplified GC or MET non-amplified GC were treated with exosome to analyze the delivery of exosomes harboring EXOH. MET, engineered EXOH. MET depl, EXON. MET, or engineered EXON. MET depl. 3D cancer-angiogenesis models were treated with 106 particles per chip of EXOAscites (EXOH. MET and EXON. MET) or EXOMET depl (EXOH. MET depl and EXON. MET depl) on day 1 and was maintained during the culture. Lysed samples were collected on day 5. The protein levels of MET, vimentin, N-cadherin (cancer invasiveness), CD31 (angiogenesis), and Alix (exosomes) were analyzed by Western blotting. Immunoblots and MET, vimentin, N-cadherin, CD31, and Alix levels were measured using EXOH. MET, and engineered EXOH. MET depl are shown (A) and quantified (B), or EXON. MET and engineered EXON. MET depl (C and D) are shown. β-Actin was used as a loading control. n = 3 ± SEM *,#P < 0.05, **,##P < 0.01, and ***,###P < 0.001 compared to the control.CC BY-NC · PubMed Central
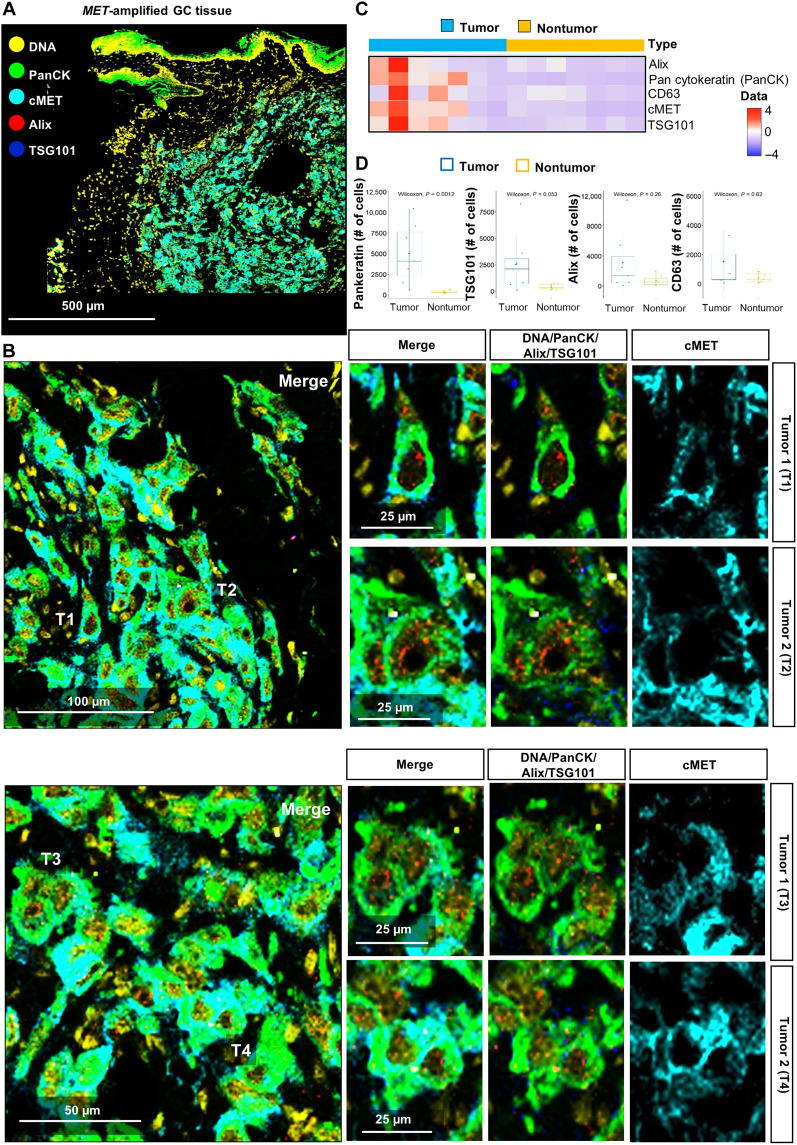
Fig. 7. Distribution of EXOAscites in MET-amplified GC tissue. The cytometric analysis detected several exosome markers in MET+ primary tumor tissues to examine exosome distribution in primary tumor tissues. (A) Representative images of tumor tissues showing exosome distribution in the pan-cytokeratin (PanCK)+-MET+ tumor region. Tumor tissues were stained for DNA (red for all cells), PanCK (green for tumor cells), cMET (sky blue), Alix (red for exosomes), and TSG101 (blue for exosomes). Scale bar, 500 μm. (B) Enlarged images of the tumor regions (T1 to T4). PanCK+-MET+ tumor cells contain several exosomes in their plasma membranes. Scale bars, 100, 50, or 25 μm, as indicated. (C) Heatmap of Alix, PanCK, CD63, cMET, and TSG101 expression levels in tumor and nontumor regions. (D) Numbers of PanCK, TSG101, Alix, and CD63+ tumor cells in MET-amplified GC tissues’ tumor and nontumor regions (n = 7).
Fig. 7. Distribution of EXOAscites in MET-amplified GC tissue. The cytometric analysis detected several exosome markers in MET+ primary tumor tissues to examine exosome distribution in primary tumor tissues. (A) Representative images of tumor tissues showing exosome distribution in the pan-cytokeratin (PanCK)+-MET+ tumor region. Tumor tissues were stained for DNA (red for all cells), PanCK (green for tumor cells), cMET (sky blue), Alix (red for exosomes), and TSG101 (blue for exosomes). Scale bar, 500 μm. (B) Enlarged images of the tumor regions (T1 to T4). PanCK+-MET+ tumor cells contain several exosomes in their plasma membranes. Scale bars, 100, 50, or 25 μm, as indicated. (C) Heatmap of Alix, PanCK, CD63, cMET, and TSG101 expression levels in tumor and nontumor regions. (D) Numbers of PanCK, TSG101, Alix, and CD63+ tumor cells in MET-amplified GC tissues’ tumor and nontumor regions (n = 7).CC BY-NC · PubMed Central
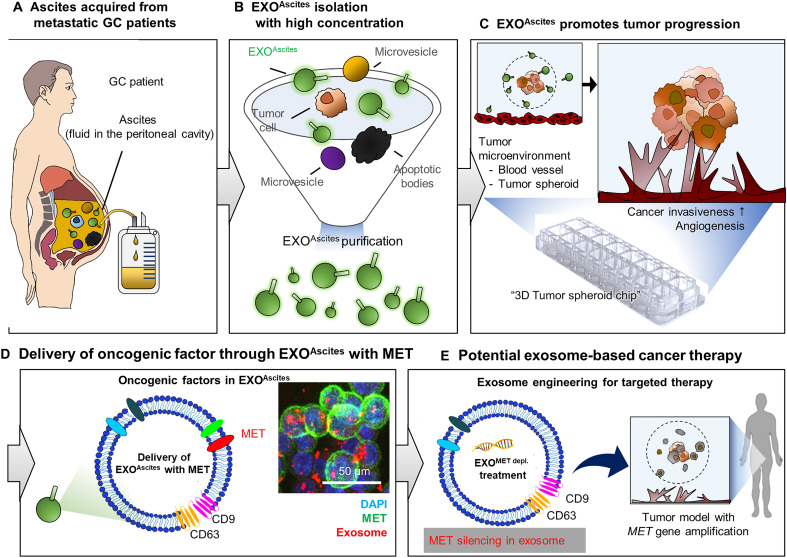
Fig. 8. Conceptual use of exosome therapy as personalized medicine in GC. Schematic showing the potential of exosomes as biomarkers and for predicting the response to therapy. EXOAscites isolated from the ascites of patients with cancer (A and B) induced cancer invasion and angiogenesis (C). Scale bars, 500, 100, 50, and 25 μm. Specifically, MET contained in EXOAscites from MET-amplified cancer cells was a dose-dependent driver of tumor invasiveness and angiogenesis in both MET-amplified and non-amplified cells (D). Thus, MET in EXOAscites can be used as a biomarker for GC diagnosis and prognosis (D). A therapeutic strategy based on engineered exosomes to deplete MET or other therapeutically relevant proteins represents a promising avenue for precision medicine in GC (E).
Fig. 8. Conceptual use of exosome therapy as personalized medicine in GC. Schematic showing the potential of exosomes as biomarkers and for predicting the response to therapy. EXOAscites isolated from the ascites of patients with cancer (A and B) induced cancer invasion and angiogenesis (C). Scale bars, 500, 100, 50, and 25 μm. Specifically, MET contained in EXOAscites from MET-amplified cancer cells was a dose-dependent driver of tumor invasiveness and angiogenesis in both MET-amplified and non-amplified cells (D). Thus, MET in EXOAscites can be used as a biomarker for GC diagnosis and prognosis (D). A therapeutic strategy based on engineered exosomes to deplete MET or other therapeutically relevant proteins represents a promising avenue for precision medicine in GC (E).CC BY-NC · PubMed Central

Verification

Claims the paper makes

The claims and statistics of this paper haven’t been checked yet.

Run the check — free, no account needed. It reads the open-access text and checks the sources it cites.

A few free checks a day · papers already verified open instantly · results are public

Claims other papers make about this one

Each is checked against this paper’s own text: does it say what the citing paper says it does?

Self-check

Percentages, sums and reported differences re-computed from the paper’s own numbers.

The self-check needs the paper’s full text.

Citations

Cites

Show all 4 references

Research works printed but not linked: 78

  1. 10.1038/s10038-021-00960-8 · DOI
  2. 10.1016/j.eclinm.2022.101404 · DOI
  3. 10.3322/caac.21660 · DOI · Paper page
  4. 10.1038/s41572-021-00326-6 · DOI
  5. 10.1016/j.soc.2021.02.003 · DOI
  6. 10.1038/ncomms9683 · DOI
  7. 10.1038/s41467-020-20429-0 · DOI
  8. 10.1038/s43018-021-00240-6 · DOI
  9. 10.1136/jitc-2021-004001 · DOI · Paper page
  10. 10.1158/1055-9965.EPI-10-1080 · DOI
  11. 10.1158/2159-8290.CD-19-1446 · DOI
  12. 10.4251/wjgo.v7.i11.317 · DOI
  13. 10.3389/pore.2022.1610697 · DOI
  14. 10.1038/nrd2530 · DOI
  15. 10.1038/nature15756 · DOI · Paper page
  16. 10.1126/science.aau6977 · DOI · Paper page
  17. 10.1038/s41556-018-0250-9 · DOI
  18. 10.1016/j.canlet.2020.01.033 · DOI
  19. 10.1126/sciadv.abj7002 · DOI
  20. 10.1126/sciadv.aba5714 · DOI
  21. 10.1126/scitranslmed.abb6981 · DOI · Paper page
  22. 10.1038/aps.2018.17 · DOI
  23. 10.1186/s13045-022-01305-4 · DOI
  24. 10.1186/s12943-019-1001-7 · DOI
  25. 10.1186/s12943-019-0967-5 · DOI
  26. 10.3748/wjg.v21.i39.10936 · DOI
  27. 10.1038/s41525-021-00212-w · DOI
  28. 10.1007/s10120-015-0523-y · DOI
  29. 10.1038/ncomms15016 · DOI
  30. 10.1038/nm.2753 · DOI · Paper page
  31. 10.1038/s41467-018-03224-w · DOI
  32. 10.1093/carcin/bgy115 · DOI
  33. 10.1016/j.ajpath.2015.10.020 · DOI
  34. 10.1016/j.canlet.2020.05.004 · DOI
  35. 10.3390/pathogens9070522 · DOI
  36. N. A. Yousafzai, H. Wang, Z. Wang, Y. Zhu, L. Zhu, H. Jin, X. Wang, Exosome mediated multidrug resistance in cancer. Am. J. Cancer Res. 8, 2210–2226 (2018).
  37. 10.1073/pnas.1310501111 · DOI
  38. K.-B. Kim, C. T. Dunn, K.-T. Park, Recent progress in mapping the emerging landscape of the small-cell lung cancer genome. Exp. Mol. Med. 51, 1–13 (2019). · DOI
  39. 10.1038/s41389-018-0049-3 · DOI
  40. 10.1080/14756366.2020.1754814 · DOI
  41. 10.1038/s41598-020-71573-y · DOI
  42. 10.1016/j.omtn.2022.05.034 · DOI
  43. 10.1016/j.actbio.2019.10.022 · DOI
  44. 10.1038/s41929-019-0333-4 · DOI
  45. 10.2217/nnm-2019-0231 · DOI
  46. 10.1126/scitranslmed.aat5690 · DOI
  47. 10.1038/s41467-017-01433-3 · DOI
  48. 10.1038/s41388-020-01555-x · DOI
  49. 10.1038/onc.2017.134 · DOI
  50. 10.2147/OTT.S231257 · DOI
  51. 10.3389/fphar.2012.00164 · DOI
  52. 10.1093/annonc/mdx134 · DOI
  53. 10.1038/s41416-022-02047-3 · DOI
  54. 10.1186/s12885-022-09681-3 · DOI
  55. 10.1093/carcin/bgv081 · DOI
  56. 10.3390/ijms20133305 · DOI
  57. 10.1002/pmic.201200562 · DOI
  58. 10.1158/1078-0432.CCR-17-2664 · DOI · Paper page
  59. 10.1038/s41422-018-0060-4 · DOI
  60. 10.1126/sciadv.aaz2083 · DOI
  61. 10.1186/s12951-020-0573-0 · DOI
  62. 10.7150/thno.39434 · DOI · Paper page
  63. 10.1038/s41571-018-0036-9 · DOI
  64. 10.2147/IJN.S231214 · DOI
  65. 10.1016/j.canlet.2020.05.036 · DOI
  66. 10.1080/2162402X.2017.1319044 · DOI
  67. T. Karasaki, J. Nakajima, K. Kakimi, Neoantigens and Whole-Exome Sequencing. Gan To Kagaku Ryoho 43, 791–797 (2016).
  68. 10.3402/jev.v4.27031 · DOI
  69. 10.1007/978-1-4939-7253-1_3 · DOI
  70. 10.1002/cam4.4259 · DOI
  71. 10.1002/ijc.31304 · DOI
  72. 10.1186/s12885-016-2058-y · DOI
  73. 10.1073/pnas.0508776103 · DOI
  74. 10.1039/C9LC00140A · DOI
  75. 10.1021/acsmedchemlett.9b00276 · DOI
  76. 10.18632/oncotarget.10859 · DOI
  77. 10.1038/modpathol.2013.108 · DOI
  78. 10.1002/jev2.12143 · DOI

Cited by

Sorted by citations

Metadata

Authors
Hyung, S., Ko, J., Heo, Y. J., Blum, S. M., Kim, S. T., Park, S. H., Park, J. O., Kang, W. K., Lim, H. Y., Klempner, S. J., & Lee, J.
Venue
Science Advances
Published
2023-11-24
Volume
9
Issue
47
ISSN
2375-2548
Cited by
47
References
4
Language
en

About these checks

Registry, retraction, Cites and statistics results are computed, not judged, with one exception: a printed reference that no index lists is read once by a model before it counts as a citation error. Claims are extracted by a model and kept only when their quote appears verbatim in the text; each cited source is then checked, with a model’s help, for whether it says what the claim relies on. Those verdicts can be wrong — read the claim’s quote and the cited source before relying on one.

Statistics and arithmetic are recomputed, not judged.

Confidence bands are shown only for fields calibrated on our annotated test set. None is calibrated yet, so no band is shown.

What counts as a claim ›How we measure confidence ›How we check this ›

Are you an author, or do you see a problem with this page? Request a review