

The DOI matches its Crossref record; 55 of the 55 references it cites were found in a registry or an index.
SIP2 is the master transcription factor of Plasmodium merozoite formation
Open accessPublished version of a preprint
Abstract
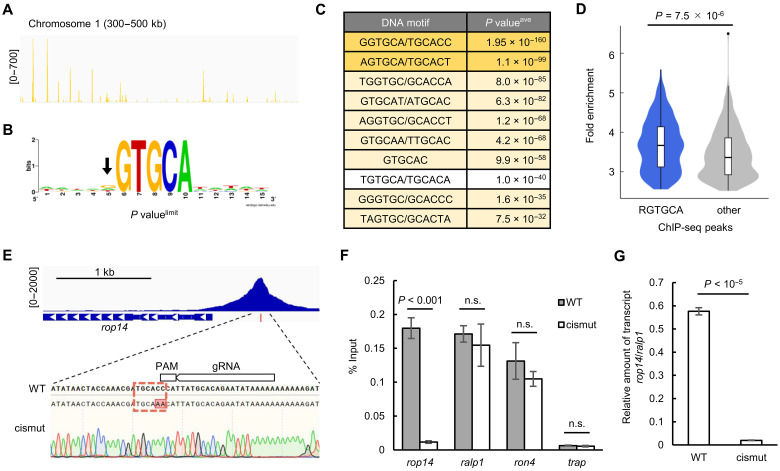
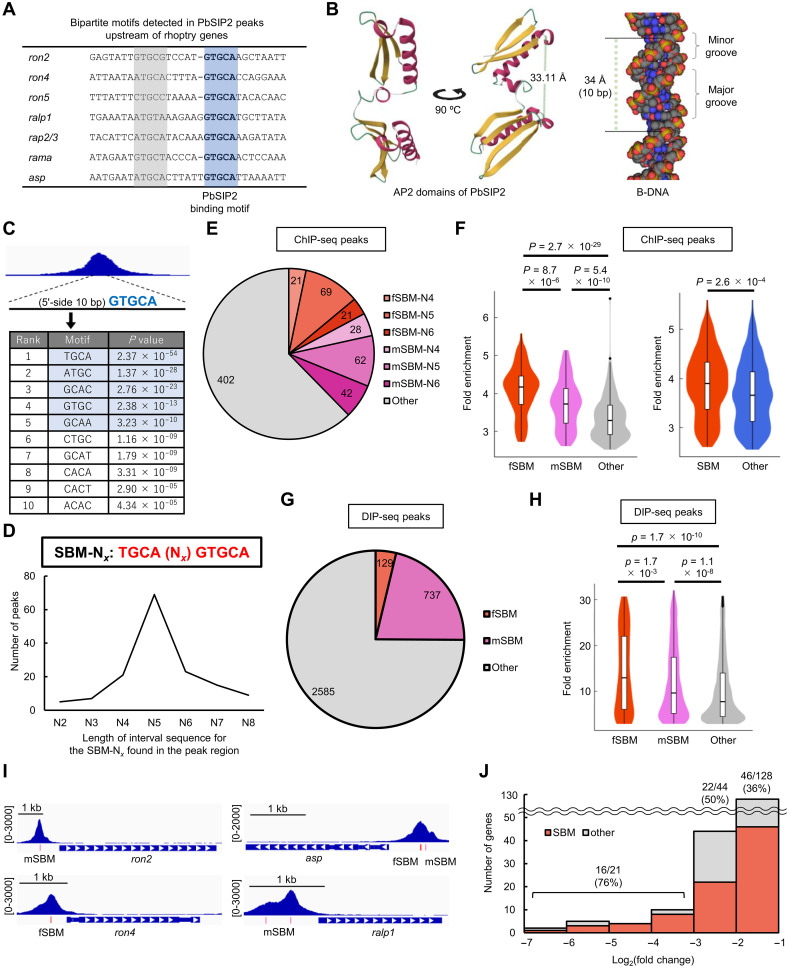
Malaria, one of the most serious infectious diseases worldwide, is caused by the proliferation of Plasmodium parasites through repeated cycles of intraerythrocytic development. The parasite replicates via schizogony in host erythrocytes, producing multiple progeny merozoites that invade new erythrocytes. Although merozoite formation is the most crucial step in malaria pathogenesis, its molecular mechanism remains unclear. SIP2 is an AP2 transcription factor expressed during schizogony and is particularly conserved among erythrocyte-infecting apicomplexan parasites. Here, we reveal that SIP2 in Plasmodium berghei (PbSIP2) functions as the master transcription factor for merozoite formation. Conditional disruption of pbsip2 resulted in developmental arrest before merozoite formation and notable down-regulation of merozoite-related genes. ChIP-seq showed that PbSIP2 comprehensively activated merozoite-related genes by binding to previously reported cis-regulatory elements of merozoite invasion-related genes, including the bipartite motif (TGCAN 4–6 GTGCA). Collectively, our results indicate that SIP2 is a transcription factor that establishes erythrocyte infectivity and may have an evolutionary origin from the common ancestor of erythrocyte-infecting apicomplexan parasites.
Overview
The claims and statistics of this paper haven’t been checked yet.
Run the check — free, no account needed. It reads the open-access text and checks the sources it cites.
Integrity signals
Registry
Cites
Statistics
Figures
Verification
Claims the paper makes
The claims and statistics of this paper haven’t been checked yet.
Run the check — free, no account needed. It reads the open-access text and checks the sources it cites.
Self-check
Percentages, sums and reported differences re-computed from the paper’s own numbers.
The self-check needs the paper’s full text.
Citations
Cites
Highly accurate protein structure prediction with AlphaFold
Jumper, J., Evans, R., Pritzel, A., Green, T., Figurnov, M., Ronneberger, O., Tunyasuvunakool, K., Bates, R., Žídek, A., Potapenko, A., et al. (2021) · Nature · doi:10.1038/s41586-021-03819-2 · Cited by 43,764
The Transcriptome of the Intraerythrocytic Developmental Cycle of Plasmodium falciparum
Bozdech, Z., Llinás, M., Pulliam, B. L., Wong, E. D., Zhu, J., & DeRisi, J. L. (2003) · PLoS Biology · doi:10.1371/journal.pbio.0000005 · Cited by 1,728
Antibiotic Modulation of Capsular Exopolysaccharide and Virulence in Acinetobacter baumannii
Geisinger, E., & Isberg, R. R. (2015) · PLOS Pathogens · doi:10.1371/journal.ppat.1004691 · Cited by 548
Xi, Z., Gavotte, L., Xie, Y., & Dobson, S. L. (2008) · BMC Genomics · doi:10.1186/1471-2164-9-1 · Cited by 531
Balaji, S. (2005) · Nucleic Acids Research · doi:10.1093/nar/gki709 · Cited by 520
Allen, M. D., Yamasaki, K., Ohme-Takagi, M., Tateno, M., & Suzuki, M. (1998) · The EMBO Journal · doi:10.1093/emboj/17.18.5484 · Cited by 492
Identifying critical state of complex diseases by single-sample Kullback–Leibler divergence
Zhong, J., Liu, R., & Chen, P. (2020) · BMC Genomics · doi:10.1186/s12864-020-6490-7 · Cited by 472
A cascade of DNA-binding proteins for sexual commitment and development in Plasmodium
Sinha, A., Hughes, K. R., Modrzynska, K. K., Otto, T. D., Pfander, C., Dickens, N. J., Religa, A. A., Bushell, E., Graham, A. L., Cameron, R., et al. (2014) · Nature · doi:10.1038/nature12970 · Cited by 438
Malaria Parasites and Other Haemosporidia
Brown, H. W. (1967) · JAMA: The Journal of the American Medical Association · doi:10.1001/jama.1967.03130050070044 · Cited by 398
David, P. H., Hommel, M., Miller, L. H., Udeinya, I. J., & Oligino, L. D. (1983) · Proceedings of the National Academy of Sciences · doi:10.1073/pnas.80.16.5075 · Cited by 344
Franke-Fayard, B., Janse, C. J., Cunha-Rodrigues, M., Ramesar, J., Büscher, P., Que, I., Löwik, C., Voshol, P. J., den Boer, M. A. M., van Duinen, S. G., et al. (2005) · Proceedings of the National Academy of Sciences · doi:10.1073/pnas.0503386102 · Cited by 332
Campbell, T. L., De Silva, E. K., Olszewski, K. L., Elemento, O., & Llinás, M. (2010) · PLoS Pathogens · doi:10.1371/journal.ppat.1001165 · Cited by 275
Identification of a transcription factor in the mosquito‐invasive stage of malaria parasites
Yuda, M., Iwanaga, S., Shigenobu, S., Mair, G. R., Janse, C. J., Waters, A. P., Kato, T., & Kaneko, I. (2009) · Molecular Microbiology · doi:10.1111/j.1365-2958.2009.06609.x · Cited by 219
Self-citationToenhake, C. G., Fraschka, S. A. K., Vijayabaskar, M. S., Westhead, D. R., van Heeringen, S., & Bártfai, R. (2018) · Cell Host & Microbe · doi:10.1016/j.chom.2018.03.007 · Cited by 208
A Major Role for the Plasmodium falciparum ApiAP2 Protein PfSIP2 in Chromosome End Biology
Flueck, C., Bártfai, R., Niederwieser, I., Witmer, K., Alako, B., Moes, S., Bozdech, Z., Jenoe, P., Stunnenberg, H. G., & Voss, T. S. (2010) · PLoS Pathogens · doi:10.1371/journal.ppat.1000784 · Cited by 198
Regulation of Cre recombinase by ligand-induced complementation of inactive fragments
Jullien, N. (2003) · Nucleic Acids Research · doi:10.1093/nar/gng131 · Cited by 177
Asynchronous nuclear cycles in multinucleated Plasmodium falciparum facilitate rapid proliferation
Klaus, S., Binder, P., Kim, J., Machado, M., Funaya, C., Schaaf, V., Klaschka, D., Kudulyte, A., Cyrklaff, M., Laketa, V., et al. (2022) · Science Advances · doi:10.1126/sciadv.abj5362 · Cited by 177
Dissecting the role of PfAP2-G in malaria gametocytogenesis
Josling, G. A., Russell, T. J., Venezia, J., Orchard, L., van Biljon, R., Painter, H. J., & Llinás, M. (2020) · Nature Communications · doi:10.1038/s41467-020-15026-0 · Cited by 173
Nutrient sensing modulates malaria parasite virulence
Mancio-Silva, L., Slavic, K., Grilo Ruivo, M. T., Grosso, A. R., Modrzynska, K. K., Vera, I. M., Sales-Dias, J., Gomes, A. R., MacPherson, C. R., Crozet, P., et al. (2017) · Nature · doi:10.1038/nature23009 · Cited by 169
Red Blood Cell Invasion by the Malaria Parasite Is Coordinated by the PfAP2-I Transcription Factor
Santos, J., Josling, G. A., Ross, P., Joshi, P., Orchard, L., Campbell, T., Schieler, A., Cristea, I. M., & Llinás, M. (2017) · Cell Host & Microbe · doi:10.1016/j.chom.2017.05.006 · Cited by 161
Arnot, D. E., Ronander, E., & Bengtsson, D. C. (2010) · International Journal for Parasitology · doi:10.1016/j.ijpara.2010.07.012 · Cited by 158
Chen, L., Lopaticki, S., Riglar, D. T., Dekiwadia, C. D., Uboldi, A. D., Tham, W., O’Neill, M. T., Richard, D., Baum, J., Ralph, S. A., et al. (2011) · PLoS Pathogens · doi:10.1371/journal.ppat.1002199 · Cited by 155
Painter, H. J., Chung, N. C., Sebastian, A., Albert, I. U., Storey, J. D., & Llinás, M. (2018) · Nature Communications · doi:10.1038/s41467-018-04966-3 · Cited by 142
The Complexity of Piroplasms Life Cycles
Jalovecká, M., Hajdušek, O., Sojka, D., Kopáček, P., & Malandrin, L. (2018) · Frontiers in Cellular and Infection Microbiology · doi:10.3389/fcimb.2018.00248 · Cited by 139
In silico discovery of transcription regulatory elements in Plasmodium falciparum
Young, J. A., Johnson, J. R., Benner, C. W., Yan, S. F., Chen, K., Roch, K. G. L., Zhou, Y., & Winzeler, E. A. (2008) · BMC Genomics · doi:10.1186/1471-2164-9-70 · Cited by 126
Kaneko, I., Iwanaga, S., Kato, T., Kobayashi, I., & Yuda, M. (2015) · PLoS Pathogens · doi:10.1371/journal.ppat.1004905 · Cited by 118
Self-citationVoss, T. S., Kaestli, M., Vogel, D., Bopp, S. E. R., & Beck, H. (2003) · Molecular Microbiology · doi:10.1046/j.1365-2958.2003.03528.x · Cited by 117
Half of resources in threatened species conservation plans are allocated to research and monitoring
Buxton, R. T., Avery‐Gomm, S., Lin, H.-Y., Smith, P. A., Cooke, S. J., & Bennett, J. (2020) · Nature Communications · doi:10.1038/s41467-020-18486-6 · Cited by 112
Read, M., Sherwin, T., Holloway, S. P., Keith Gull, B., & Hyde, J. E. (1993) · Parasitology · doi:10.1017/s0031182000075041 · Cited by 111
Three-dimensional ultrastructure of Plasmodium falciparum throughout cytokinesis
Rudlaff, R. M., Kräemer, S., Marshman, J., & Dvorin, J. D. (2020) · PLoS Pathogens · doi:10.1371/journal.ppat.1008587 · Cited by 107
Chappell, L., Ross, P., Orchard, L., Russell, T. J., Otto, T. D., Berriman, M., Rayner, J. C., & Llinás, M. (2020) · BMC Genomics · doi:10.1186/s12864-020-06787-5 · Cited by 96
Kent, R. S., Modrzynska, K., Cameron, R., Philip, N., Billker, O., & Waters, A. P. (2018) · Nature Microbiology · doi:10.1038/s41564-018-0223-6 · Cited by 91
Centrins, Cell Cycle Regulation Proteins in Human Malaria Parasite Plasmodium falciparum
Mahajan, B., Selvapandiyan, A., Gerald, N. J., Majam, V., Zheng, H., Wickramarachchi, T., Tiwari, J. L., Fujioka, H., Moch, J. K., Kumar, N., et al. (2008) · Journal of Biological Chemistry · doi:10.1074/jbc.m800028200 · Cited by 85
Lu, X. M., Batugedara, G., Lee, M., Prudhomme, J. G., Bunnik, E. M., & Roch, K. G. L. (2017) · Nucleic Acids Research · doi:10.1093/nar/gkx464 · Cited by 69
Female‐specific gene regulation in malaria parasites by an AP2‐family transcription factor
Yuda, M., Kaneko, I., Iwanaga, S., Murata, Y., & Kato, T. (2019) · Molecular Microbiology · doi:10.1111/mmi.14334 · Cited by 66
Self-citationPlasmodium schizogony, a chronology of the parasite’s cell cycle in the blood stage
Voß, Y., Klaus, S., Guizetti, J., & Ganter, M. (2023) · PLoS Pathogens · doi:10.1371/journal.ppat.1011157 · Cited by 61
Zuccala, E., Gout, A., Dekiwadia, C., Marapana, D. S., Angrisano, F., Turnbull, L., Riglar, D. T., Rogers, K., Whitchurch, C., Ralph, S. A., et al. (2012) · PLoS ONE · doi:10.1371/journal.pone.0046160 · Cited by 53
Martins, R. M., MacPherson, C. R., Claës, A., Scheidig‐Benatar, C., Sakamoto, H., Yam, X. Y., Preiser, P. R., Goel, S., Wahlgren, M., Sismeiro, O., et al. (2017) · Scientific Reports · doi:10.1038/s41598-017-12578-y · Cited by 53
DNA-binding protein PfAP2-P regulates parasite pathogenesis during malaria parasite blood stages
Subudhi, A. K., Green, J. L., Satyam, R., Salunke, R. P., Lenz, T., Shuaib, M., Isaioglou, I., Abel, S., Gupta, M. K., Esau, L. E., et al. (2023) · Nature Microbiology · doi:10.1038/s41564-023-01497-6 · Cited by 48
Sierra-Miranda, M., Vembar, S. S., Delgadillo-Álvarez, D. M., Ávila-López, P. A., Herrera‐Solorio, A. M., Lozano-Amado, D., Vargas, M. A., & Hernández‐Rivas, R. (2017) · Cellular Microbiology · doi:10.1111/cmi.12742 · Cited by 47
Absalon, S., Robbins, J. A., & Dvorin, J. D. (2016) · Nature Communications · doi:10.1038/ncomms11449 · Cited by 45
Shinzawa, N., Nishi, T., Hiyoshi, F., Motooka, D., Yuda, M., & Iwanaga, S. (2020) · Communications Biology · doi:10.1038/s42003-020-01138-2 · Cited by 44
Self-citationLiffner, B., Frölich, S., Heinemann, G. K., Liu, B., Ralph, S. A., Dixon, M. W. A., Gilberger, T., & Wilson, D. W. (2020) · Nature Communications · doi:10.1038/s41467-020-15127-w · Cited by 41
Easy DNA Modeling and More with GraphiteLifeExplorer
Hornus, S., Bruno Lévy, B., Larivière, D., & Fourmentin, E. (2013) · PLoS ONE · doi:10.1371/journal.pone.0053609 · Cited by 37
Morillo, R. C., Tong, X., Xie, W., Abel, S. M., Orchard, L., Daher, W., Patel, D. J., Llinás, M., Roch, K. G. L., & Kafsack, B. F. C. (2022) · Nature Microbiology · doi:10.1038/s41564-021-01045-0 · Cited by 36
Mechanisms of triggering malaria gametocytogenesis by AP2-G
Yuda, M., Kaneko, I., Murata, Y., Iwanaga, S., & Nishi, T. (2021) · Parasitology International · doi:10.1016/j.parint.2021.102403 · Cited by 34
Self-citationNishi, T., Kaneko, I., Iwanaga, S., & Yuda, M. (2022) · PLoS Pathogens · doi:10.1371/journal.ppat.1010510 · Cited by 29
Self-citationLiffner, B., Balbin, J. M., Shami, G. J., Siddiqui, G., Strauss, J., Frölich, S., Heinemann, G. K., Edwards, E. M., Alder, A., Wichers-Misterek, J. S., et al. (2022) · Communications Biology · doi:10.1038/s42003-022-03020-9 · Cited by 19
Yuda, M., Kaneko, I., Murata, Y., Iwanaga, S., & Nishi, T. (2023) · mBio · doi:10.1128/mbio.02516-22 · Cited by 19
Self-citationJacobs, R. L., & Warren, M. (1967) · Transactions of the Royal Society of Tropical Medicine and Hygiene · doi:10.1016/0035-9203(67)90170-8 · Cited by 17
Cubillos, E. F. G., Prata, I. O., Fotoran, W. L., Ranford-Cartwright, L. C., & Wunderlich, G. (2021) · Frontiers in Cellular and Infection Microbiology · doi:10.3389/fcimb.2021.669088 · Cited by 14
Clements, R. L., Morano, A. A., Navarro, F. M., McGee, J. P., Du, E. W., Streva, V. A., Lindner, S. E., & Dvorin, J. D. (2022) · Proceedings of the National Academy of Sciences · doi:10.1073/pnas.2204167119 · Cited by 14
DNA Immunoprecipitation (DIP) for the Determination of DNA-Binding SpecificityPreprint
Gossett, A. J., & Lieb, J. D. (2008) · Cold Spring Harbor Protocols · doi:10.1101/pdb.prot4972 · Cited by 13
Murata, Y., Nishi, T., Kaneko, I., Iwanaga, S., & Yuda, M. (2023) · eLife · doi:10.7554/elife.88317 · Cited by 9
Self-citationFreeman, B. S. (1967) · JAMA · doi:10.1001/jama.1967.03130050070043 · Cited by 1
Metadata
- Authors
- Nishi, T., Kaneko, I., & Yuda, M.
- Affiliations
- Mie University (JP)
- Corresponding author
- Yuda, Masao
- Venue
- Science Advances
- Published
- 2025-03-21
- Volume
- 11
- Issue
- 12
- Pages
- eads5458-eads5458
- ISSN
- 2375-2548 (ISSN-L)
- PMC
- PMC11927625
- OpenAlex
- W4408718230
- Cited by
- 5
- References
- 55
- Citations by year
- 2026: 3 · 2025: 2
- FWCI
- 4.53
- Type
- journal article
- Language
- en
- Open access
- gold
- doi.org
- Licence
- cc-by
- Locations
- Science Advances (publishedVersion, cc-by)
- bioRxiv (Cold Spring Harbor Laboratory) (acceptedVersion, cc-by)
- PubMed Central (publishedVersion, cc-by)
- PubMed (publishedVersion)
- Funders
- Japan Society for the Promotion of Science (24K10187, 23K27400)
- Topics
- Health Sciences › Medicine › Public Health, Environmental and Occupational Health › Malaria Research and Control
- Life Sciences › Immunology and Microbiology › Parasitology › Toxoplasma gondii Research Studies
- Life Sciences › Immunology and Microbiology › Parasitology › Bird parasitology and diseases
- Keywords
- SiP2, Plasmodium berghei, schizogony, AP2 transcription factor, erythrocyte invasion, transcriptional regulation, cis-regulatory elements, conditional gene disruption, malaria pathogenesis
- MeSH terms
- Animals, Erythrocytes, Gene Expression Regulation, Malaria, Plasmodium berghei, Transcription Factors, Protozoan Proteins, Mice, Merozoites
About these checks
Registry, retraction, Cites and statistics results are computed, not judged, with one exception: a printed reference that no index lists is read once by a model before it counts as a citation error. Claims are extracted by a model and kept only when their quote appears verbatim in the text; each cited source is then checked, with a model’s help, for whether it says what the claim relies on. Those verdicts can be wrong — read the claim’s quote and the cited source before relying on one.
Statistics and arithmetic are recomputed, not judged.
Confidence bands are shown only for fields calibrated on our annotated test set. None is calibrated yet, so no band is shown.
What counts as a claim ›How we measure confidence ›How we check this ›
Are you an author, or do you see a problem with this page? Request a review
Data sources
Bibliographic data: Semantic Scholar, OpenAlex, Crossref.
Contains information from the Semantic Scholar Academic Graph Datasets, made available under the ODC Attribution License (ODC-BY 1.0).
Semantic Scholar’s data is described in: Kinney, R., et al. (2023). The Semantic Scholar Open Data Platform. arXiv:2301.10140.
