

The DOI matches its Crossref record; 56 of the 56 references it cites were found in a registry or an index.
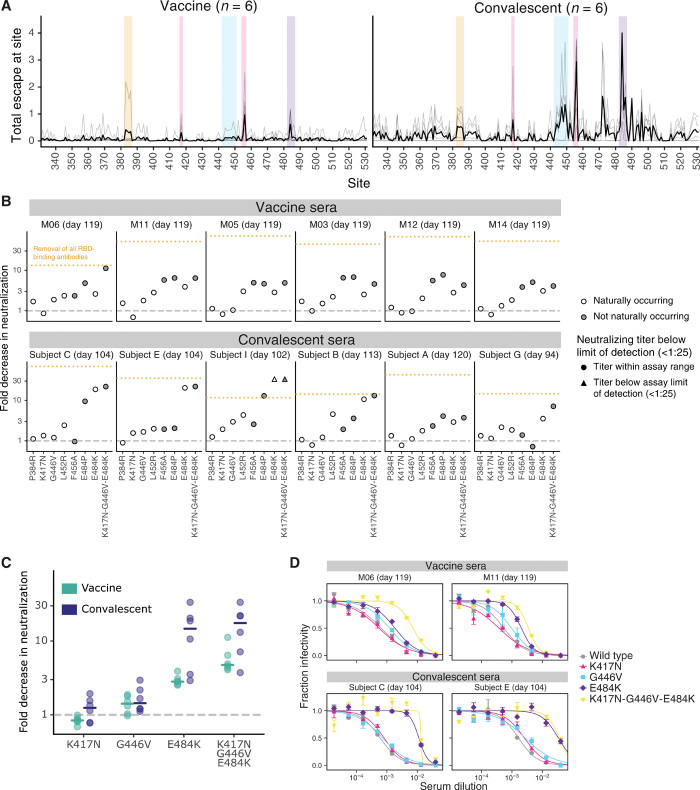
Antibodies elicited by mRNA-1273 vaccination bind more broadly to the receptor binding domain than do those from SARS-CoV-2 infection
Open accessPublished version of a preprint
Abstract
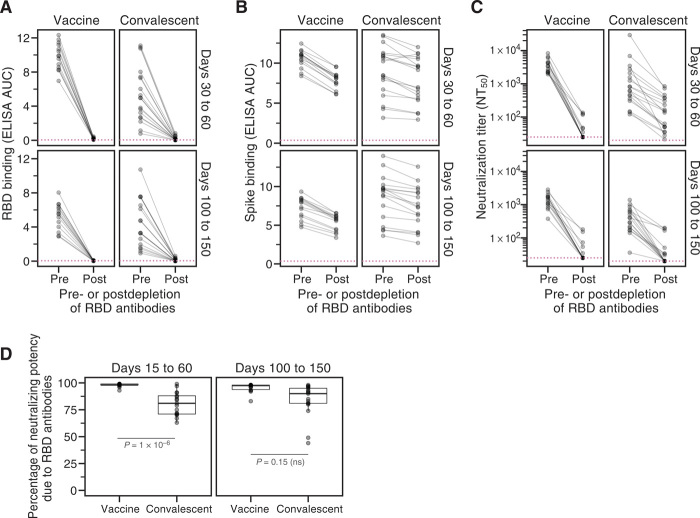
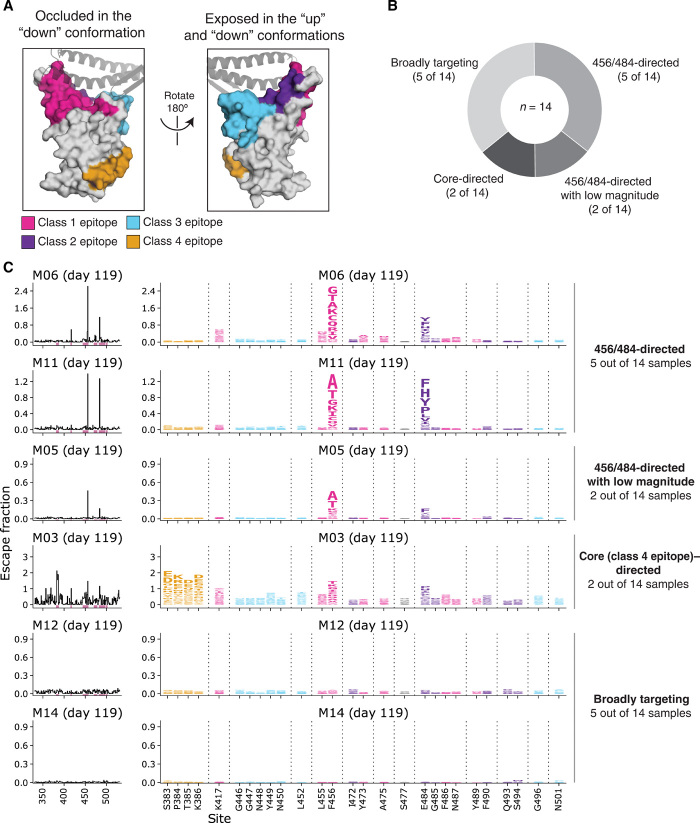
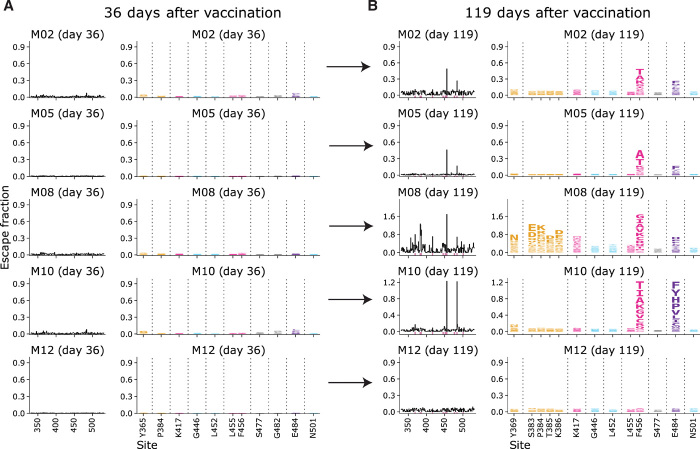
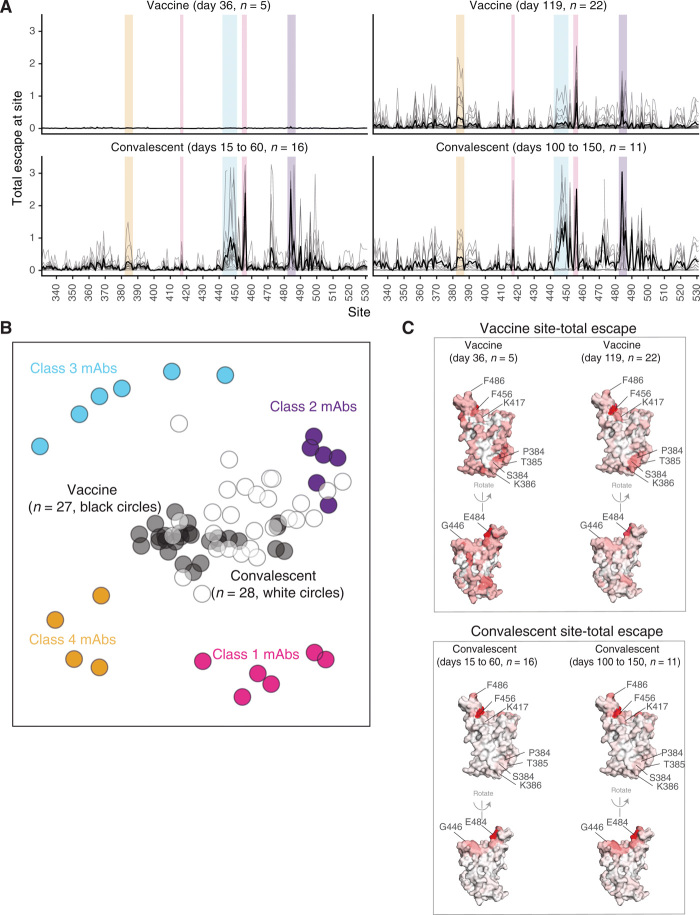
Deep mutational scanning shows that the mRNA-1273 RBD-binding antibody response is less affected by single viral mutations than the infection response.
Overview
The claims and statistics of this paper haven’t been checked yet.
Run the check — free, no account needed. It reads the open-access text and checks the sources it cites.
Integrity signals
Registry
Cites
Statistics
Figures
Verification
Claims the paper makes
The claims and statistics of this paper haven’t been checked yet.
Run the check — free, no account needed. It reads the open-access text and checks the sources it cites.
Claims other papers make about this one
Each is checked against this paper’s own text: does it say what the citing paper says it does?
The source backs part of the claim, not all of it — or backs it for a different population, condition or comparison.
In the citing paper
“Furthermore, mRNA vaccines have recently been successfully used against COVID-19, validating the platform and showing that mRNA vaccines can prevent infectious diseases in the future (Greaney et al., 2021).”
From A novel Toxoplasma gondii TGGT1_316290 mRNA-LNP vaccine elicits protective immune response against toxoplasmosis in mice (2023) · cites this paper as Greaney et al., 2021
Experimental — accuracy not yet measuredIn the citing paper
“L452R has resulted in 3-fold to 10-fold reduced susceptibility to about one third of convalescent and vaccinee plasma samples”
From The biological and clinical significance of emerging SARS-CoV-2 variants (2021) · cites this paper as [164]
In the citing paper
“The levels of neutralizing mAbs elicited by the mRNA vaccines has been high and in most persons are likely to be maintained for many months above the levels required for protection against even the most resistant circulating variants 164,239,240 .”
From The biological and clinical significance of emerging SARS-CoV-2 variants (2021) · cites this paper as [164]
Self-check
Percentages, sums and reported differences re-computed from the paper’s own numbers.
The self-check needs the paper’s full text.
Citations
Cites
Structure of the SARS-CoV-2 spike receptor-binding domain bound to the ACE2 receptor
Lan, J., Ge, J., Yu, J., Shan, S., Zhou, H., Fan, S., Zhang, Q., Shi, X., Wang, Q., Zhang, L., et al. (2020) · Nature · doi:10.1038/s41586-020-2180-5 · Cited by 5,983
mRNA vaccines — a new era in vaccinology
Pardi, N., Hogan, M. J., Porter, F. W., & Weissman, D. (2018) · Nature Reviews Drug Discovery · doi:10.1038/nrd.2017.243 · Cited by 4,667
Korber, B., Fischer, W. M., Gnanakaran, S., Yoon, H., Theiler, J., Abfalterer, W., Hengartner, N., Giorgi, E. E., Bhattacharya, T., Foley, B., et al. (2020) · Cell · doi:10.1016/j.cell.2020.06.043 · Cited by 4,281
An mRNA Vaccine against SARS-CoV-2 — Preliminary Report
Jackson, L. A., Anderson, E. J., Rouphael, N. G., Roberts, P. C., Makhene, M., Coler, R. N., McCullough, M. P., Chappell, J. D., Denison, M. R., Stevens, L. J., et al. (2020) · New England Journal of Medicine · doi:10.1056/nejmoa2022483 · Cited by 3,237
Detection of a SARS-CoV-2 variant of concern in South Africa
Tegally, H., Wilkinson, E., Giovanetti, M., Iranzadeh, A., Fonseca, V., Giandhari, J., Doolabh, D., Pillay, S., San, E. J., Msomi, N., et al. (2021) · Nature · doi:10.1038/s41586-021-03402-9 · Cited by 2,510
Antibody resistance of SARS-CoV-2 variants B.1.351 and B.1.1.7
Wang, P., Nair, M. S., Liu, L., Iketani, S., Luo, Y., Guo, Y., Wang, M., Yu, J., Zhang, B., Kwong, P. D., et al. (2021) · Nature · doi:10.1038/s41586-021-03398-2 · Cited by 2,312
Starr, T. N., Greaney, A. J., Hilton, S. K., Ellis, D., Crawford, K. H. D., Dingens, A. S., Navarro, M. J., Bowen, J. E., Tortorici, M. A., Walls, A. C., et al. (2020) · Cell · doi:10.1016/j.cell.2020.08.012 · Cited by 1,956
Self-citationConvergent Antibody Responses to SARS-CoV-2 in Convalescent Individuals
Robbiani, D. F., Gaebler, C., Muecksch, F., Lorenzi, J. C. C., Wang, Z., Cho, A., Agudelo, M., Barnes, C. O., Gazumyan, A., Finkin, S., et al. (2020) · Nature · doi:10.1038/s41586-020-2456-9 · Cited by 1,853
Evolution of antibody immunity to SARS-CoV-2
Gaebler, C., Wang, Z., Lorenzi, J. C. C., Muecksch, F., Finkin, S., Tokuyama, M., Cho, A., Jankovic, M., Schaefer-Babajew, D., Oliveira, T. Y., et al. (2021) · Nature · doi:10.1038/s41586-021-03207-w · Cited by 1,674
SARS-CoV-2 mRNA Vaccine Design Enabled by Prototype Pathogen Preparedness
Corbett, K. S., Edwards, D. K., Leist, S. R., Abiona, O. M., Boyoglu-Barnum, S., Gillespie, R. A., Himansu, S., Schäfer, A., Ziwawo, C. T., DiPiazza, A. T., et al. (2020) · Nature · doi:10.1038/s41586-020-2622-0 · Cited by 1,615
Research works printed but not linked: 3
- Pfizer and BioNTech confirm high efficacy and no serious safety concerns through up to six months following second dose in updated topline analysis of landmark COVID-19 vaccine study; www.pfizer.com/news/press-release/press-release-detail/pfizer-and-biontech-confirm-high-efficacy-and-no-serious.
- A. J. Greaney, T. N. Starr, C. O. Barnes, Y. Weisblum, F. Schmidt, M. Caskey, C. Gaebler, M. Agudelo, S. Finkin, Z. Wang, D. Poston, F. Muecksch, T. Hatziioannou, P. D. Bieniasz, D. F. Robbiani, M. C. Nussenzweig, P. J. Bjorkman, J. D. Bloom, Mutational escape from the polyclonal antibody response to SARS-CoV-2 infection is largely shaped by a single class of antibodies. bioRxiv 2021.03.17.435863 (2021).
- M. K. Annavajhala, H. Mohri, J. E. Zucker, Z. Sheng, P. Wang, A. Gomez-Simmonds, D. D. Ho, A.-C. Uhlemann, A novel SARS-CoV-2 variant of concern, B.1.526, identified in New York. medRxiv 2021.02.23.21252259 (2021).
Cited by
Sorted by citations
SARS-CoV-2 variants, spike mutations and immune escape
Harvey, W. T., Carabelli, A. M., Jackson, B., Gupta, R. K., Thomson, E. C., Harrison, E. M., Ludden, C., Reeve, R., Rambaut, A., COVID-19 Genomics UK (COG-UK) Consortium, et al. (2021) · Nature Reviews Microbiology · doi:10.1038/s41579-021-00573-0 · Cited by 3,528
The biological and clinical significance of emerging SARS-CoV-2 variants
Tao, K., Tzou, P. L., Nouhin, J., Gupta, R. K., de Oliveira, T., Kosakovsky Pond, S. L., Fera, D., & Shafer, R. W. (2021) · Nature Reviews Genetics · doi:10.1038/s41576-021-00408-x · Cited by 1,009
Naturally enhanced neutralizing breadth against SARS-CoV-2 one year after infection
Wang, Z., Muecksch, F., Schaefer-Babajew, D., Finkin, S., Viant, C., Gaebler, C., Hoffmann, H. H., Barnes, C. O., Cipolla, M., Ramos, V., et al. (2021) · Nature · doi:10.1038/s41586-021-03696-9 · Cited by 721
Structural basis of SARS-CoV-2 Omicron immune evasion and receptor engagement
McCallum, M., Czudnochowski, N., Rosen, L. E., Zepeda, S. K., Bowen, J. E., Walls, A. C., Hauser, K., Joshi, A., Stewart, C., Dillen, J. R., et al. (2022) · Science · doi:10.1126/science.abn8652 · Cited by 535
Röltgen, K., Nielsen, S. C. A., Silva, O., Younes, S. F., Zaslavsky, M., Costales, C., Yang, F., Wirz, O. F., Solis, D., Hoh, R. A., et al. (2022) · Cell · doi:10.1016/j.cell.2022.01.018 · Cited by 475
Metadata
- Authors
- Greaney, A. J., Loes, A. N., Gentles, L. E., Crawford, K. H. D., Starr, T. N., Malone, K. D., Chu, H. Y., & Bloom, J. D.
- Affiliations
- University of Washington (US)
- Howard Hughes Medical Institute (US)
- Fred Hutch Cancer Center (US)
- Corresponding author
- Bloom, Jesse D.
- ORCID
- Venue
- Science Translational Medicine
- Published
- 2021-06-30
- Volume
- 13
- Issue
- 600
- ISSN
- 1946-6234 (ISSN-L)
- 1946-6242
- PMC
- PMC8369496
- OpenAlex
- W3169651048
- Cited by
- 244
- References
- 53
- Citations by year
- 2026: 11 · 2025: 23 · 2024: 29 · 2023: 52 · 2022: 79 · 2021: 49
- FWCI
- 16.63
- Type
- journal article
- Language
- en
- Open access
- hybrid
- doi.org
- Licence
- Locations
- Science Translational Medicine (publishedVersion, cc-by)
- bioRxiv (Cold Spring Harbor Laboratory) (acceptedVersion, cc-by)
- PubMed Central (publishedVersion, cc-by)
- PubMed (publishedVersion)
- PubMed Central (submittedVersion, cc-by)
- Funders
- National Institutes of Health (UM1AI148373, UM1AI148576, UM1AI148684, NIH P51 OD011132, AI149644, R01AI127893, S10OD028685, T32AI083203, F30AI149928)
- National Institute of Allergy and Infectious Diseases (UM1AI148373, R01AI141707, R01AI127893, T32AI083203, F30AI149928, UM1AI148576, UM1AI148684, NIH AID AI149644)
- Howard Hughes Medical Institute
- ASCRS Research Foundation (R01AI141707, R01AI127893, T32AI083203, F30AI149928, INV-004949, INV-016575, S10OD028685, DRG-2381-19, RNA-1273, UM1AI148373, UM1AI148576, UM1AI148684, NIH P51 OD011132, NIH AID AI149644, HHSN272201500002C)
- Bill and Melinda Gates Foundation (INV-004949, INV-016575)
- Gates Foundation (INV-004949, INV-016575)
- Damon Runyon Cancer Research Foundation (DRG-2381-19)
- Department of Health and Human Services (HHSN272201500002C)
- Topics
- Health Sciences › Medicine › Infectious Diseases › SARS-CoV-2 and COVID-19 Research
- Life Sciences › Biochemistry, Genetics and Molecular Biology › Molecular Biology › vaccines and immunoinformatics approaches
- Life Sciences › Agricultural and Biological Sciences › Animal Science and Zoology › Animal Virus Infections Studies
- Keywords
- SARS-CoV-2, mRNA-1273 vaccine, COVID-19 vaccination, natural infection, receptor binding domain, spike protein, neutralizing antibodies, epitope specificity, viral evolution, antigenic drift, deep mutational scanning, convalescent sera
About these checks
Registry, retraction, Cites and statistics results are computed, not judged, with one exception: a printed reference that no index lists is read once by a model before it counts as a citation error. Claims are extracted by a model and kept only when their quote appears verbatim in the text; each cited source is then checked, with a model’s help, for whether it says what the claim relies on. Those verdicts can be wrong — read the claim’s quote and the cited source before relying on one.
Statistics and arithmetic are recomputed, not judged.
Confidence bands are shown only for fields calibrated on our annotated test set. None is calibrated yet, so no band is shown.
What counts as a claim ›How we measure confidence ›How we check this ›
Are you an author, or do you see a problem with this page? Request a review
