

The DOI matches its Crossref record; 2 of the 2 references it cites were found in a registry or an index.
Diverse bacteriohemerythrin genes of Methylomonas denitrificans FJG1 provide insight into the survival and activity of methanotrophs in low oxygen ecosystems
Open accessPublished version of a preprint
Abstract
Proteobacterial methanotrophs are dependent on the oxidation of methane for ATP production and assimilation of carbon into biomass. Interestingly, some types of gammaproteobacterial methanotrophs thrive in oxygen-depleted zones of lakes and other aquatic ecosystems despite their reliance on oxygen to support methane oxidation. The model gammaproteobacterial methanotroph, Methylomonas denitrificans FJG1, oxidizes methane coupled to nitrate reduction under hypoxia and highly upregulates its expression of bacteriohemerythrin (Bhr). Bhr is a homolog of eukaryotic hemerythrin, which is a protein associated with oxygen binding. Ten bhr homologs were identified in the genome of M. denitrificans FJG1, requiring phylogenetic and gene expression analyses to pinpoint which homolog is likely responsible for delivering oxygen to support methane oxidation under low oxygen conditions. This study examined the prevalence and phylogeny of the 10 bhr homologs from M. denitrificans FJG1 in the genomes of other methanotrophs and across the Bacteria. The homolog denoted “ bhr- 00” was specific to methanotroph genomes, was highly expressed in M. denitrificans FJG1 under hypoxia, and its predicted structure was nearly identical to a purified oxygen-scavenging hemerythrin protein from Methylococcus capsulatus Bath. Other bhr homologs upregulated from denitrifying cultures of M. denitrificans FJG1 included those with gene neighborhoods related to oxygen sensing, denitrification, and chemotaxis. Together, this study uncovered potential multifunctional roles of bacteriohemerythrin genes of M. denitrificans FJG1 under low oxygen conditions and identified the bhr homolog that most likely enables and supports oxygen delivery to methane monooxygenase enzymes in anoxic ecosystems. IMPORTANCE: Aerobic gammaproteobacterial methanotrophs can survive and grow in anoxic lakes, but mechanisms that provide them with oxygen to support methane oxidation remain uncharacterized. Methylomonas denitrificans FJG1 encodes 10 copies of bacteriohemerthyrin ( bhr ), of which seven are expressed at the mRNA level under low oxygen conditions. Comparing the 10 bhr homologs from M. denitrificans FJG1 with those from other methanotrophs and bacterial genomes shows that two are specific to methanotrophs. Gene neighborhoods surrounding conserved bhr genes in methanotrophs suggest a range of potential functions, including oxygen respiration, oxygen sensing, chemotaxis, and nitrate reduction. The results from this study illuminate a previously undescribed diversity of structures and potential functions of bhr homologs in M. denitrificans FJG1 and related methanotrophic bacteria. The results pinpoint a methanotroph-specific homolog, bhr -00, that is likely responsible for oxygen binding and delivery to methane monooxygenase enzymes to promote methane oxidation in low oxygen ecosystems.
Overview
The claims and statistics of this paper haven’t been checked yet.
Run the check — free, no account needed. It reads the open-access text and checks the sources it cites.
Integrity signals
Registry
Cites
Statistics
Figures
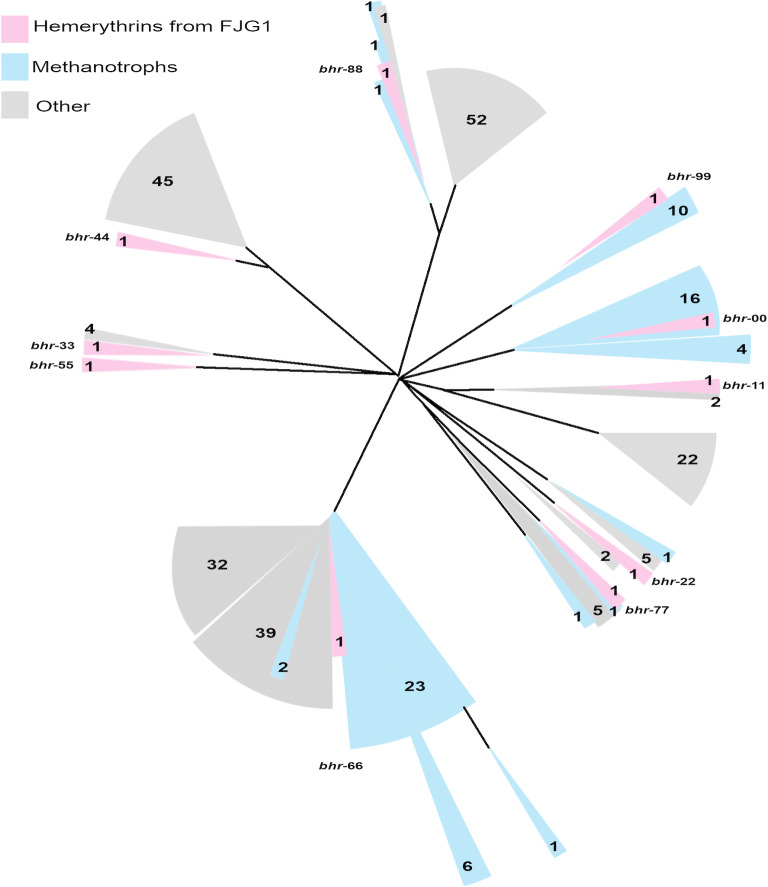
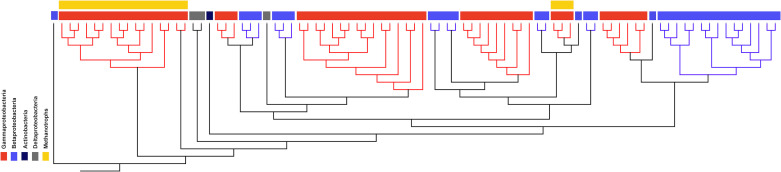
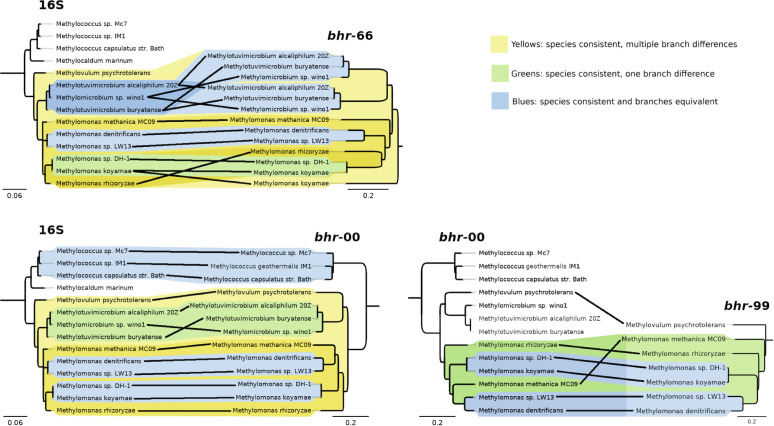
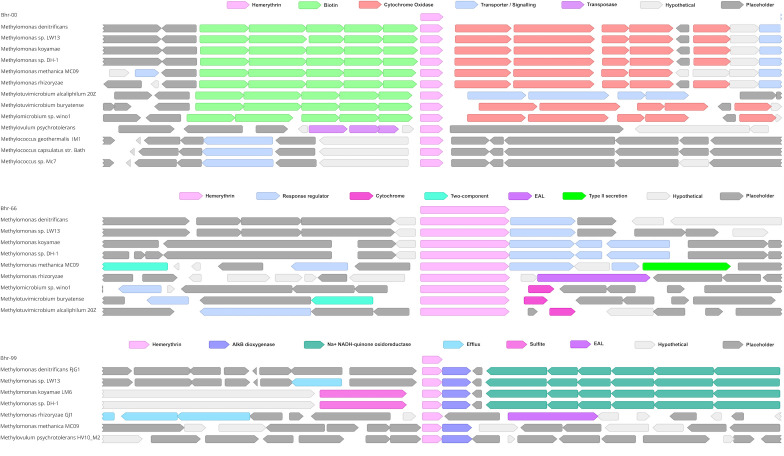
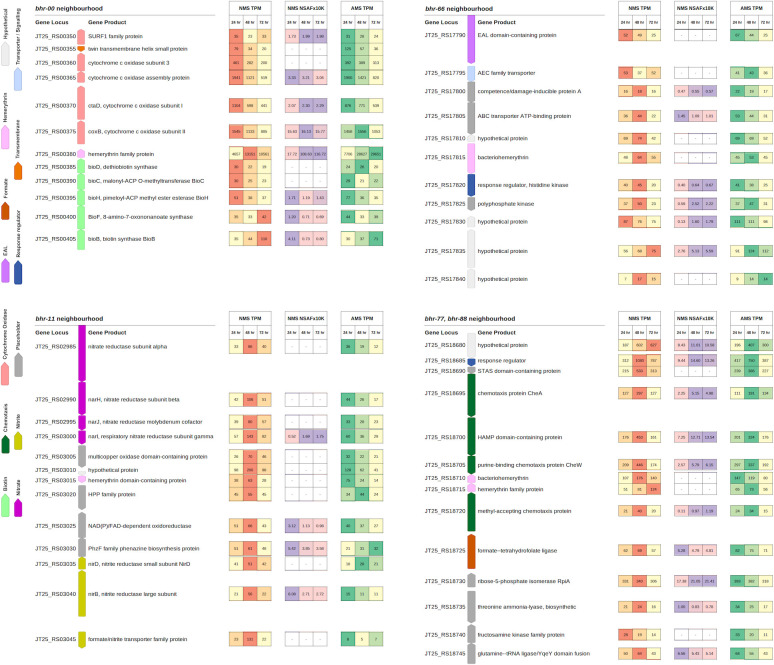
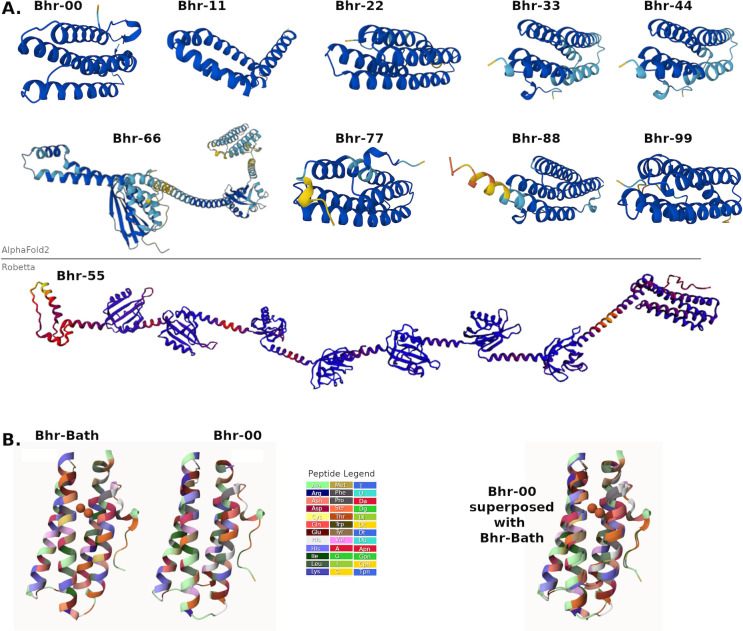
Verification
Claims the paper makes
The claims and statistics of this paper haven’t been checked yet.
Run the check — free, no account needed. It reads the open-access text and checks the sources it cites.
Self-check
Percentages, sums and reported differences re-computed from the paper’s own numbers.
The self-check needs the paper’s full text.
Citations
Cites
Highly accurate protein structure prediction with AlphaFold
Jumper, J., Evans, R., Pritzel, A., Green, T., Figurnov, M., Ronneberger, O., Tunyasuvunakool, K., Bates, R., Žídek, A., Potapenko, A., et al. (2021) · Nature · doi:10.1038/s41586-021-03819-2 · Cited by 43,764
Varadi, M., Bertoni, D., Magana, P., Paramval, U., Pidruchna, I., Radhakrishnan, M., Tsenkov, M., Nair, S., Mirdita, M., Yeo, J., et al. (2024) · Nucleic Acids Research · doi:10.1093/nar/gkad1011 · Cited by 2,052
Research works printed but not linked: 39
- 10.1002/pro.3374 · DOI
- 10.1186/s12862-017-0933-z · DOI
- 10.1111/j.1432-1033.1992.tb17321.x · DOI
- 10.1111/1462-2920.12341 · DOI
- 10.1111/j.1432-1033.1993.tb18230.x · DOI
- 10.1021/bi992796o · DOI
- 10.1111/j.1574-6968.2007.01011.x · DOI
- 10.1016/j.genrep.2018.04.008 · DOI
- 10.1016/j.jinorgbio.2012.02.019 · DOI
- 10.1016/j.jinorgbio.2008.02.008 · DOI
- 10.1016/j.jinorgbio.2015.04.001 · DOI
- 10.1093/femsle/fnaa003 · DOI
- 10.7717/peerj.3945 · DOI
- 10.1093/ismejo/wrae060 · DOI
- 10.1128/mSystems.00770-19 · DOI
- 10.1111/1462-2920.12772 · DOI
- 10.3389/fmicb.2015.01072 · DOI
- 10.1016/j.watres.2023.119833 · DOI
- 10.1038/ncomms3785 · DOI
- 10.3389/fmolb.2022.967059 · DOI
- 10.1007/s10863-014-9565-9 · DOI
- 10.1111/j.1574-6968.2009.01674.x · DOI
- 10.1371/journal.pone.0157904 · DOI
- 10.1128/MMBR.63.2.479-506.1999 · DOI · Paper page
- 10.1016/j.str.2009.07.016 · DOI
- 10.1073/pnas.82.3.713 · DOI
- 10.3390/microorganisms11122865 · DOI
- 10.1093/ismejo/wrae041 · DOI
- 10.1016/j.tim.2020.01.006 · DOI
- 10.1038/s41467-024-49602-5 · DOI
- 10.1038/nmeth.1322 · DOI · Paper page
- 10.1021/pr8010099 · DOI
- 10.1021/pr801109k · DOI
- 10.1021/pr100594k · DOI
- 10.1016/j.ymeth.2006.07.028 · DOI
- 10.1186/1471-2105-13-S16-S12 · DOI
- 10.1093/nar/gky1004 · DOI
- 10.1093/nar/gkab314 · DOI · Paper page
- 10.1038/nbt.2839 · DOI
Cited by
Sorted by citations
Methane to bioproducts: unraveling the potential of methanotrophs for biomanufacturing.
Tan, J., Ratra, K., Singer, S. W., Simmons, B. A., Goswami, S., & Awasthi, D. (2024) · Current Opinion in Biotechnology · doi:10.1016/j.copbio.2024.103210 · Cited by 21
Carbon Reallocation Driven by Aerobic-Anoxic Alternation during Methanotrophic Metabolism.
Li, X., Mohamadnia, S., Jensen, P. R., Meier, S., Lin, F., Lu, Y.-Z., Zhu, G.-C., & Angelidaki, I. (2026) · Environmental Science and Technology · doi:10.1021/acs.est.5c07417 · Cited by 3
Umezawa, K., Tsuji, J., Tani, Y., Nohara, S., Amann, R., & Fukui, M. (2025) · bioRxiv · doi:10.64898/2025.12.18.695142 · Cited by 1
“…genes encoding a caa 3-type cytochrome c [56, 57], the majority of “ Ca. Allocrenothrix” members (including AF98 and MI19235) encode at least five homologs of bacteriohemerythrin, a non-heme-based O 2 binding protein implicated in O 2 storage in gammaproteobacterial methanotrophs [58–62] (Fig.”
Wutkowska, M., Nweze, J. A., Tláskal, V., Nweze, J. E., & Daebeler, A. (2025) · bioRxiv · doi:10.1093/femsec/fiaf127 · Cited by 1
ter Horst, P. A. G., Marshall, I. P. G., Egas, R. A., Klomp, R., Schutgens, M. A. W., van Alen, T. V., Jetten, M. S. M., Slomp, C., & Welte, C. U. (2026) · FEMS Microbiology Ecology · doi:10.1093/femsec/fiag067
“…to bind and buffer oxygen and thereby stabilize aerobic metabolism under hypoxic and fluctuating oxygen conditions (Ra-halkar Bahulikar 2018 , Weiblen et al. 2025 ) Importantly, these low-oxygen adaptations do not directly explain CH 4 -linked current generation per se, as electrons derived…”
Metadata
- Authors
- Weiblen, C., Kits, K. D., Kleiner, M., Sauvageau, D., & Stein, L. Y.
- Affiliations
- University of Alberta (CA)
- North Carolina State University (US)
- Corresponding author
- Stein, Lisa Y.
- Venue
- mBio
- Publisher
- American Society for Microbiology
- Published
- 2025-11-12
- Volume
- 16
- Issue
- 11
- Pages
- e0153325-e0153325
- ISSN
- 2150-7511 (ISSN-L)
- PMC
- PMC12607906
- OpenAlex
- W4414510811
- Cited by
- 8
- References
- 43
- Citations by year
- 2026: 4 · 2025: 3
- FWCI
- 2.07
- Type
- journal article
- Language
- en
- Open access
- gold
- doi.org
- Licence
- Locations
- mBio (publishedVersion, cc-by)
- bioRxiv (Cold Spring Harbor Laboratory) (acceptedVersion)
- Europe PMC (PubMed Central) (publishedVersion, cc-by)
- PubMed (publishedVersion)
- DOAJ (DOAJ: Directory of Open Access Journals) (submittedVersion, cc-by-sa)
- Funders
- Canada First Research Excellence Fund (FES)
- Natural Sciences and Engineering Research Council of Canada (Discovery, Banting)
- Mitacs (Accelerate)
- Topics
- Life Sciences › Biochemistry, Genetics and Molecular Biology › Molecular Biology › Microbial metabolism and enzyme function
- Physical Sciences › Environmental Science › Environmental Chemistry › Methane Hydrates and Related Phenomena
- Physical Sciences › Chemistry › Inorganic Chemistry › Metal-Catalyzed Oxygenation Mechanisms
- Keywords
- methanotrophic bacteria, methane oxidation, hypoxia, oxygen delivery, methane monooxygenase, denitrification, gene expression, oxygen sensing, anoxic lakes, Gammaproteobacteria, Methylococcus capsulatus, phylogenetic analysis
- MeSH terms
- Bacterial Proteins, Hemerythrin, Methane, Oxidation-Reduction, Oxygen, Phylogeny, Ecosystem, Methylomonas
About these checks
Registry, retraction, Cites and statistics results are computed, not judged, with one exception: a printed reference that no index lists is read once by a model before it counts as a citation error. Claims are extracted by a model and kept only when their quote appears verbatim in the text; each cited source is then checked, with a model’s help, for whether it says what the claim relies on. Those verdicts can be wrong — read the claim’s quote and the cited source before relying on one.
Statistics and arithmetic are recomputed, not judged.
Confidence bands are shown only for fields calibrated on our annotated test set. None is calibrated yet, so no band is shown.
What counts as a claim ›How we measure confidence ›How we check this ›
Are you an author, or do you see a problem with this page? Request a review
