Cited by 109Extracellular vesicles in diseaseHIV Research and TreatmentCellular transport and secretion

The DOI matches its Crossref record; 85 of the 85 references it cites were found in a registry or an index.

Nef Secretion into Extracellular Vesicles or Exosomes Is Conserved across Human and Simian Immunodeficiency Viruses

Open access

Abstract

Extracellular vesicles (EVs) or exosomes have been implicated in the pathophysiology of infections and cancer. The negative regulatory factor (Nef) encoded by simian immunodeficiency virus (SIV) and human immunodeficiency virus (HIV) plays a critical role in the progression to AIDS and impairs endosomal trafficking. Whether HIV-1 Nef can be loaded into EVs has been the subject of controversy, and nothing is known about the connection between SIV Nef and EVs. We find that both SIV and HIV-1 Nef proteins are present in affinity-purified EVs derived from cultured cells, as well as in EVs from SIV-infected macaques. Nef-positive EVs were functional, i.e., capable of membrane fusion and depositing their content into recipient cells. The EVs were able to transfer Nef into recipient cells. This suggests that Nef readily enters the exosome biogenesis pathway, whereas HIV virions are assembled at the plasma membrane. It suggests a novel mechanism by which lentiviruses can influence uninfected and uninfectable, i.e., CD4-negative, cells. IMPORTANCE Extracellular vesicles (EVs) transfer biologically active materials from one cell to another, either within the adjacent microenvironment or further removed. EVs also package viral RNAs, microRNAs, and proteins, which contributes to the pathophysiology of infection. In this report, we show that both human immunodeficiency virus (HIV) and simian immunodeficiency virus (SIV) incorporate the virus-encoded Nef protein into EVs, including EVs circulating in the blood of SIV-infected macaques and that this presents a novel mechanism of Nef transfer to naive and even otherwise non-infectable cells. Nef is dispensable for viral replication but essential for AIDS progression in vivo . Demonstrating that Nef incorporation into EVs is conserved across species implicates EVs as novel mediators of the pathophysiology of HIV. It could help explain the biological effects that HIV has on CD4-negative cells and EVs could become biomarkers of disease progression.

Overview

The claims and statistics of this paper haven’t been checked yet.

Run the check — free, no account needed. It reads the open-access text and checks the sources it cites.

A few free checks a day · papers already verified open instantly · results are public

Integrity signals

Registry

Crossref · 10.1128/mbio.02344-17

Cites

85 of 85 references verified0 citation errors · 0 not checkable

Statistics

Figures

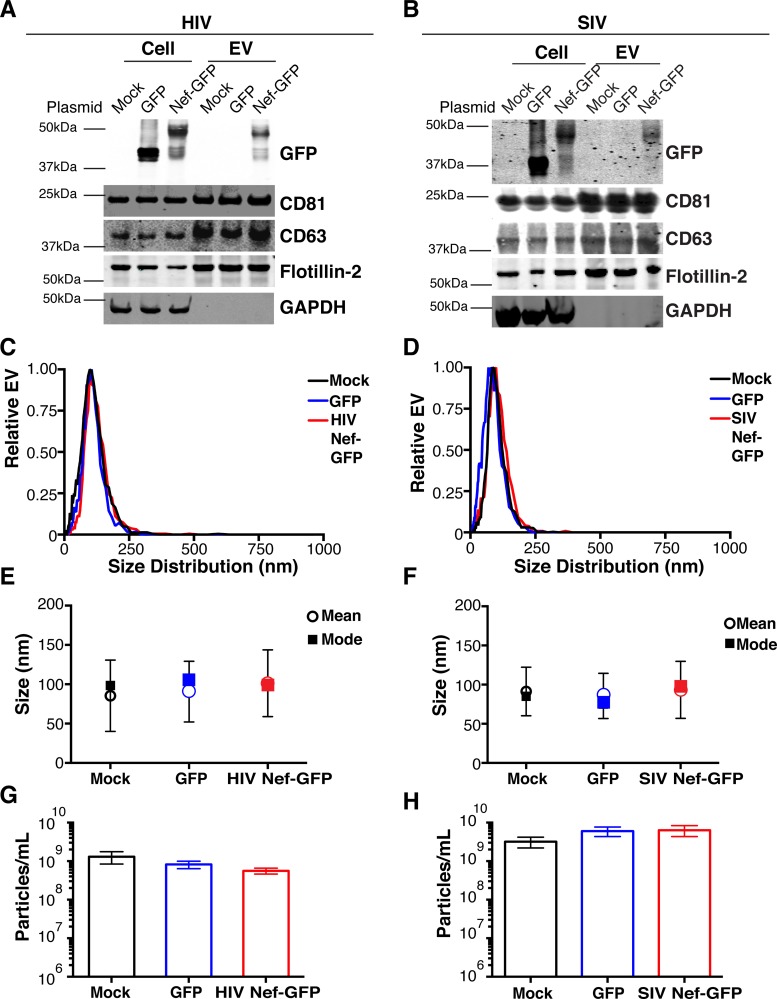
FIG 1 HIV and SIV Nef proteins are present in cell culture-derived EVs. (A) HEK-293 cells were mock transfected or transiently transfected with GFP or HIV nef-GFP. Cell pellets were run with equivalent total protein input amounts as determined by GAPDH levels. EV pellets were run with equivalent total numbers of EV particles, as determined by NTA. The EV markers CD81, CD63, and flotillin 2 were used to identify the presence of EVs, and GAPDH was used as an intracellular marker not incorporated into EVs. GFP was used to track both GFP and HIV Nef-GFP. (B) HEK-293 cells were mock transfected or transiently transfected with GFP or SIV nef-GFP. Cell pellets were run with equivalent total protein input amounts, as determined by GAPDH levels. EV pellets were run with equivalent total numbers of EV particles, as determined by NTA. The EV markers CD81, CD63, and flotillin 2 were used to identify the presence of EVs, and GAPDH was used as an intracellular marker not incorporated into EVs. GFP was used to track both GFP and SIV Nef-GFP. (C) Size distribution analysis of EVs isolated from cells transfected as described for panel A by NTA with the Particle Metrix ZetaView. Videos of EV populations were taken to determine size distributions (11 measurements per group with a total of four biological replicates). The peak size was arbitrarily set to 1 for each group. (D) Size distribution analysis of EVs isolated from cells transfected as described for panel B by using the same methods as for panel C. (E) Mean and mode sizes of EVs from cells transfected as described for panel A. n = 4 per group. (F) Mean and mode sizes of EVs from cells transfected as described for panel B. n = 4 per group. (G) Total EV concentration (particles per milliliter) of cell culture supernatant from cells transfected as described for panel A. n = 4 per group. (H) Total EV concentration (particles per milliliter) of cell culture supernatant from cells transfected as described for panel B. n = 4 per group. See also Fig. S1.
FIG 1 HIV and SIV Nef proteins are present in cell culture-derived EVs. (A) HEK-293 cells were mock transfected or transiently transfected with GFP or HIV nef-GFP. Cell pellets were run with equivalent total protein input amounts as determined by GAPDH levels. EV pellets were run with equivalent total numbers of EV particles, as determined by NTA. The EV markers CD81, CD63, and flotillin 2 were used to identify the presence of EVs, and GAPDH was used as an intracellular marker not incorporated into EVs. GFP was used to track both GFP and HIV Nef-GFP. (B) HEK-293 cells were mock transfected or transiently transfected with GFP or SIV nef-GFP. Cell pellets were run with equivalent total protein input amounts, as determined by GAPDH levels. EV pellets were run with equivalent total numbers of EV particles, as determined by NTA. The EV markers CD81, CD63, and flotillin 2 were used to identify the presence of EVs, and GAPDH was used as an intracellular marker not incorporated into EVs. GFP was used to track both GFP and SIV Nef-GFP. (C) Size distribution analysis of EVs isolated from cells transfected as described for panel A by NTA with the Particle Metrix ZetaView. Videos of EV populations were taken to determine size distributions (11 measurements per group with a total of four biological replicates). The peak size was arbitrarily set to 1 for each group. (D) Size distribution analysis of EVs isolated from cells transfected as described for panel B by using the same methods as for panel C. (E) Mean and mode sizes of EVs from cells transfected as described for panel A. n = 4 per group. (F) Mean and mode sizes of EVs from cells transfected as described for panel B. n = 4 per group. (G) Total EV concentration (particles per milliliter) of cell culture supernatant from cells transfected as described for panel A. n = 4 per group. (H) Total EV concentration (particles per milliliter) of cell culture supernatant from cells transfected as described for panel B. n = 4 per group. See also Fig. S1.CC BY · PubMed Central
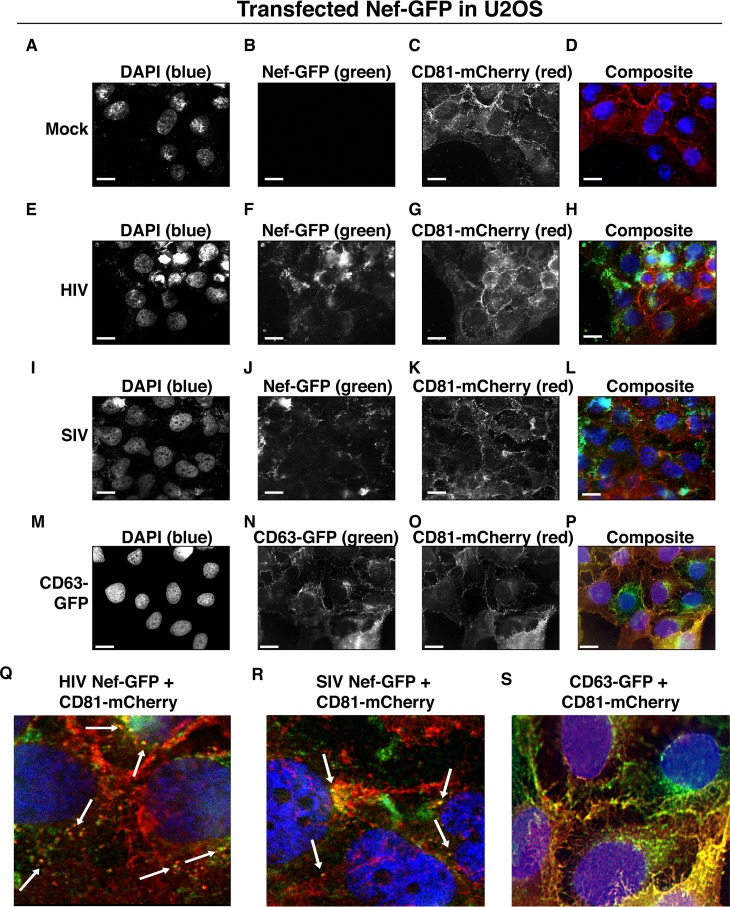
FIG 2 HIV and SIV Nef proteins colocalize in the cytoplasm with the EV marker CD81 in cells. (A to D) U2OS cells were selected to stably express the EV marker CD81-mCherry and then mock transfected (empty vector). Single-plane images from deconvoluted z-stacks were used to visualize DAPI (A), GFP (B), CD81-mCherry (C), and a composite (D). Size bars = 200 μm. (E to H) Same as panels A to D but for cells transfected with HIV nef-GFP. Single-plane images from deconvoluted z-stacks were used to visualize DAPI (E), GFP (F), CD81-mCherry (G), and a composite (H). (I to L) Same as panels A to D but for cells transfected with SIV nef-GFP. Single-plane images from deconvoluted z-stacks were used to visualize DAPI (I), GFP (J), CD81-mCherry (K), and a composite (L). (M to P) U2OS cells constitutively expressing CD63-GFP and CD81-mCherry were used as a positive control. Single-plane images from deconvoluted z-stacks were used to visualize DAPI (M), CD63-GFP (N), CD81-mCherry (O), and a composite (P). (Q to S) Selected areas from U2OS CD81-mCherry-expressing cells coexpressing HIV Nef-GFP (Q), SIV Nef-GFP (R), and CD63-GFP enlarged to show areas of colocalization events (S).
FIG 2 HIV and SIV Nef proteins colocalize in the cytoplasm with the EV marker CD81 in cells. (A to D) U2OS cells were selected to stably express the EV marker CD81-mCherry and then mock transfected (empty vector). Single-plane images from deconvoluted z-stacks were used to visualize DAPI (A), GFP (B), CD81-mCherry (C), and a composite (D). Size bars = 200 μm. (E to H) Same as panels A to D but for cells transfected with HIV nef-GFP. Single-plane images from deconvoluted z-stacks were used to visualize DAPI (E), GFP (F), CD81-mCherry (G), and a composite (H). (I to L) Same as panels A to D but for cells transfected with SIV nef-GFP. Single-plane images from deconvoluted z-stacks were used to visualize DAPI (I), GFP (J), CD81-mCherry (K), and a composite (L). (M to P) U2OS cells constitutively expressing CD63-GFP and CD81-mCherry were used as a positive control. Single-plane images from deconvoluted z-stacks were used to visualize DAPI (M), CD63-GFP (N), CD81-mCherry (O), and a composite (P). (Q to S) Selected areas from U2OS CD81-mCherry-expressing cells coexpressing HIV Nef-GFP (Q), SIV Nef-GFP (R), and CD63-GFP enlarged to show areas of colocalization events (S).CC BY · PubMed Central
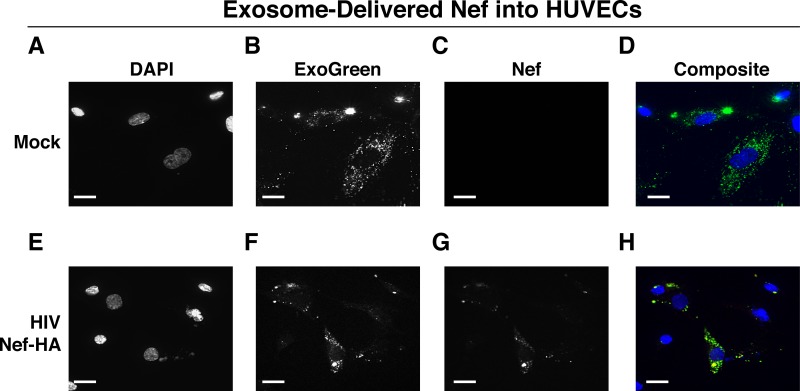
FIG 3 HIV Nef can be transferred to endothelial cells by EVs. hTERT-HUVECs were treated with ExoGreen-labeled EVs. ExoGreen is a pan-EV label used to track the uptake of EVs by cells. Scale bars = 100 μm. (A to D) Cells were given EVs taken from transiently mock-transfected HEK-293 cells. (E to H) Cells were given EVs from transiently Nef-HA-transfected HEK-293 cells. Single-plane images from deconvoluted z-stacks were used to visualize DAPI (E), ExoGreen (F), Nef-HA (G), and a composite (H). Scale bars = 200 μm.
FIG 3 HIV Nef can be transferred to endothelial cells by EVs. hTERT-HUVECs were treated with ExoGreen-labeled EVs. ExoGreen is a pan-EV label used to track the uptake of EVs by cells. Scale bars = 100 μm. (A to D) Cells were given EVs taken from transiently mock-transfected HEK-293 cells. (E to H) Cells were given EVs from transiently Nef-HA-transfected HEK-293 cells. Single-plane images from deconvoluted z-stacks were used to visualize DAPI (E), ExoGreen (F), Nef-HA (G), and a composite (H). Scale bars = 200 μm.CC BY · PubMed Central
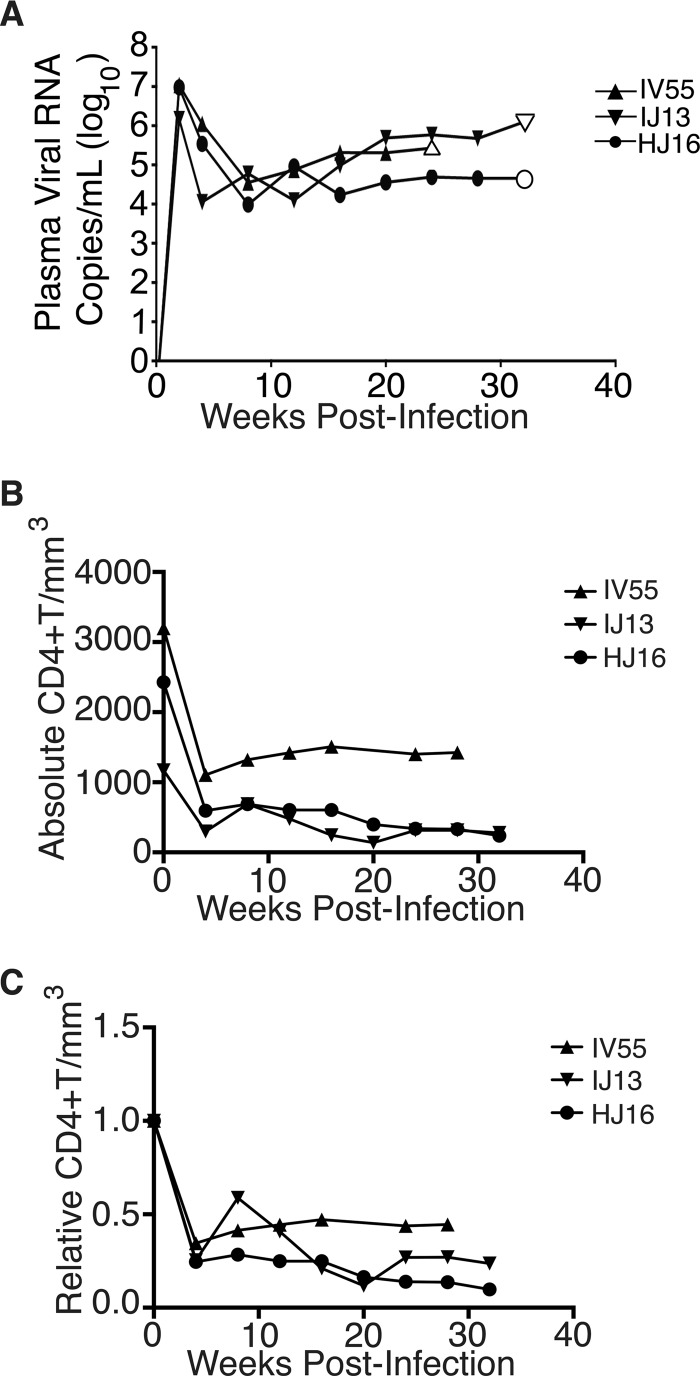
FIG 4 Time course of SIV infection in macaques. (A) Indian origin rhesus macaques maintained at the TNPRC were inoculated with SIVmac239, blood was harvested, and circulating viral RNA was quantified throughout the study. Open symbols represent the times at which animals were sacrificed. (B) Absolute CD4+ T cell counts of rhesus macaques throughout SIV infection. Blood was taken from macaques pre- and postinfection with SIV, and CD4+ T counts were determined by flow cytometry. (C) Relative CD4+ T cell counts of rhesus macaques throughout SIV infection. Blood was taken from macaques pre- and postinfection with SIV, and CD4+ T counts were standardized to day zero for each animal.
FIG 4 Time course of SIV infection in macaques. (A) Indian origin rhesus macaques maintained at the TNPRC were inoculated with SIVmac239, blood was harvested, and circulating viral RNA was quantified throughout the study. Open symbols represent the times at which animals were sacrificed. (B) Absolute CD4+ T cell counts of rhesus macaques throughout SIV infection. Blood was taken from macaques pre- and postinfection with SIV, and CD4+ T counts were determined by flow cytometry. (C) Relative CD4+ T cell counts of rhesus macaques throughout SIV infection. Blood was taken from macaques pre- and postinfection with SIV, and CD4+ T counts were standardized to day zero for each animal.CC BY · PubMed Central
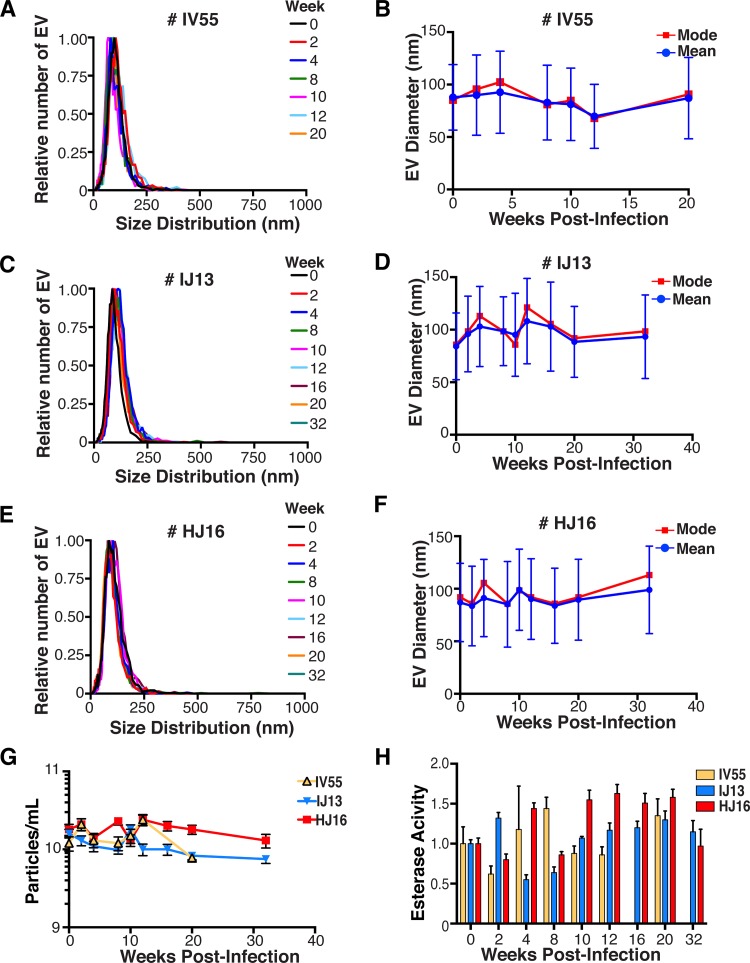
FIG 5 Quantitative analysis of the EV fraction from macaque plasma. EVs were isolated from 3 ml of plasma from macaques IV55 (A), IJ13 (C), and HJ16 (E) and analyzed with the ZetaView from Particle Metrix. Relative size distribution was analyzed by Brownian motion (85) and plotted for EVs taken from the animals preinfection (week 0) and at various time points postinfection with SIV (weeks 2 to 32). Mode (red) and mean (blue) sizes of EVs isolated from the plasma of macaques IV55 (B), IJ13 (D), and HJ16 (F) were determined from the size distribution analysis. The mode and mean sizes of the EVs are shown preinfection (week 0) and at various time points postinfection with SIV (weeks 2 to 32). (G) Total EV concentrations (particles per milliliter) in the plasma of the three animals preinfection (week 0) and at various time points postinfection with SIV (weeks 2 to 32) (11 measurements per group). (H) Esterase activity of EVs isolated from the plasma of the three animals preinfection (week 0) and at various time points postinfection with SIV (weeks 2 to 32). All values are standardized to week 0 for each animal (n = 4 for each time point for each animal).
FIG 5 Quantitative analysis of the EV fraction from macaque plasma. EVs were isolated from 3 ml of plasma from macaques IV55 (A), IJ13 (C), and HJ16 (E) and analyzed with the ZetaView from Particle Metrix. Relative size distribution was analyzed by Brownian motion (85) and plotted for EVs taken from the animals preinfection (week 0) and at various time points postinfection with SIV (weeks 2 to 32). Mode (red) and mean (blue) sizes of EVs isolated from the plasma of macaques IV55 (B), IJ13 (D), and HJ16 (F) were determined from the size distribution analysis. The mode and mean sizes of the EVs are shown preinfection (week 0) and at various time points postinfection with SIV (weeks 2 to 32). (G) Total EV concentrations (particles per milliliter) in the plasma of the three animals preinfection (week 0) and at various time points postinfection with SIV (weeks 2 to 32) (11 measurements per group). (H) Esterase activity of EVs isolated from the plasma of the three animals preinfection (week 0) and at various time points postinfection with SIV (weeks 2 to 32). All values are standardized to week 0 for each animal (n = 4 for each time point for each animal).CC BY · PubMed Central
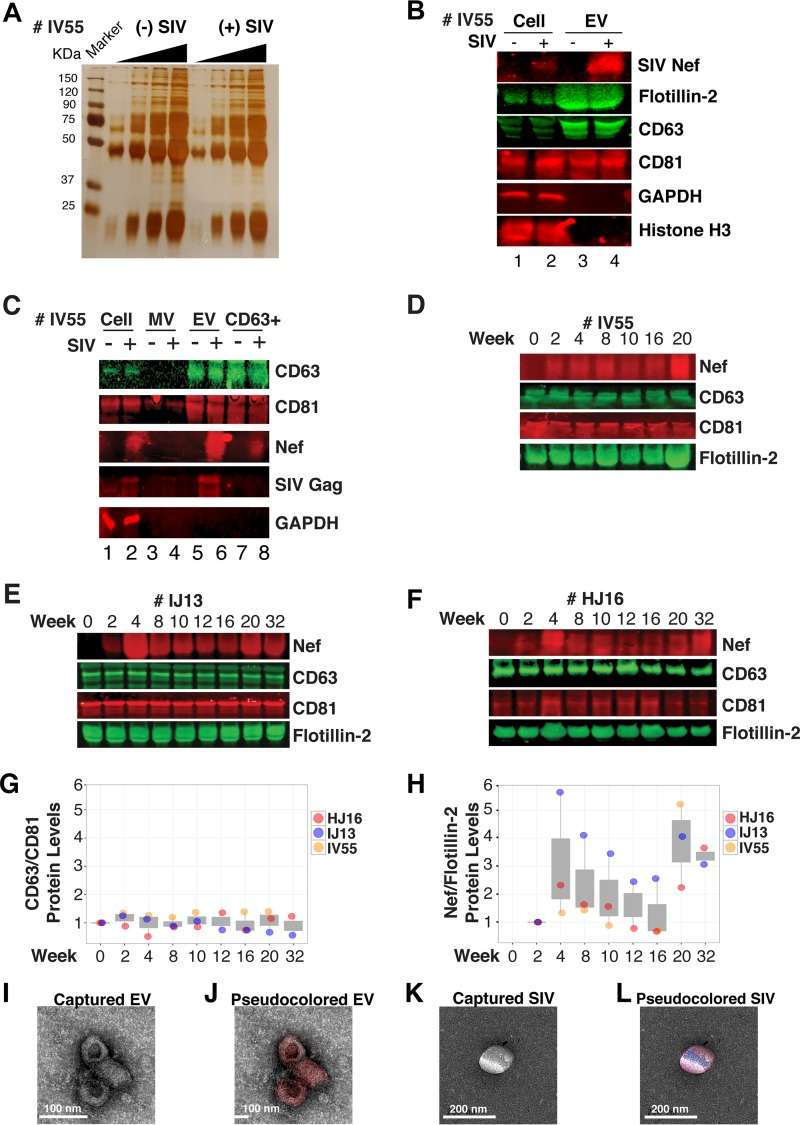
FIG 6 Nef is a constituent of CD63+ EVs in vivo. (A) Silver stain analysis of total EVs isolated from macaque IV55 pre- and postinfection with SIV. EVs were diluted to equivalent concentrations (1 × 10⁹, 2 × 10⁹, 4 × 10⁹, and 8 × 10⁹ particles/ml), and contents were run for silver stain analysis. (B) Nef is detected in the EV fraction from SIV-infected macaques. Cell pellets and EV fractions from animal IV55 pre- and postinfection with SIV were assayed for the presence of Nef. Cell pellets were run with equivalent total protein input amounts, as determined by GAPDH and histone H3 levels. EV pellets were run with equivalent total numbers of EV particles, as determined by NTA. The EV markers flotillin 2, CD63, and CD81 were used to identify the presence of EVs. The SIVmac239 Nef antibody was used to track Nef. (C) Nef is present in CD63+ affinity-purified EVs. Cell pellet, MV, total EV, and CD63/CD81 affinity-purified fractions were assayed for the presence of Nef and other protein components. (D) Nef levels in CD63+ EVs throughout the course of infection of macaque IV55. EVs were CD63+ affinity purified at various time points pre- and postinfection with SIV. (E) Same as panel D but for IJ13. (F) Same as panel D but for HJ16. (G) Quantitation of the CD63/CD81 levels of the three animals throughout infection. (H) Quantification of the Nef/flotillin 2 levels of the three animals throughout infection. (I) Representative electron micrograph of CD63+ EVs from animal IV55. Scale bar = 100 nm. (J) CD63+ EVs imaged in panel I pseudocolored red to improve contrast. Scale bar = 100 nm. (K) Representative electron micrograph of SIV particle from animal IV55. Scale bar = 200 nm. (L) SIV particle imaged in panel J pseudocolored blue and red for contrast. Scale bar = 200 nm. See also Fig. S2.
FIG 6 Nef is a constituent of CD63+ EVs in vivo. (A) Silver stain analysis of total EVs isolated from macaque IV55 pre- and postinfection with SIV. EVs were diluted to equivalent concentrations (1 × 10⁹, 2 × 10⁹, 4 × 10⁹, and 8 × 10⁹ particles/ml), and contents were run for silver stain analysis. (B) Nef is detected in the EV fraction from SIV-infected macaques. Cell pellets and EV fractions from animal IV55 pre- and postinfection with SIV were assayed for the presence of Nef. Cell pellets were run with equivalent total protein input amounts, as determined by GAPDH and histone H3 levels. EV pellets were run with equivalent total numbers of EV particles, as determined by NTA. The EV markers flotillin 2, CD63, and CD81 were used to identify the presence of EVs. The SIVmac239 Nef antibody was used to track Nef. (C) Nef is present in CD63+ affinity-purified EVs. Cell pellet, MV, total EV, and CD63/CD81 affinity-purified fractions were assayed for the presence of Nef and other protein components. (D) Nef levels in CD63+ EVs throughout the course of infection of macaque IV55. EVs were CD63+ affinity purified at various time points pre- and postinfection with SIV. (E) Same as panel D but for IJ13. (F) Same as panel D but for HJ16. (G) Quantitation of the CD63/CD81 levels of the three animals throughout infection. (H) Quantification of the Nef/flotillin 2 levels of the three animals throughout infection. (I) Representative electron micrograph of CD63+ EVs from animal IV55. Scale bar = 100 nm. (J) CD63+ EVs imaged in panel I pseudocolored red to improve contrast. Scale bar = 100 nm. (K) Representative electron micrograph of SIV particle from animal IV55. Scale bar = 200 nm. (L) SIV particle imaged in panel J pseudocolored blue and red for contrast. Scale bar = 200 nm. See also Fig. S2.CC BY · PubMed Central
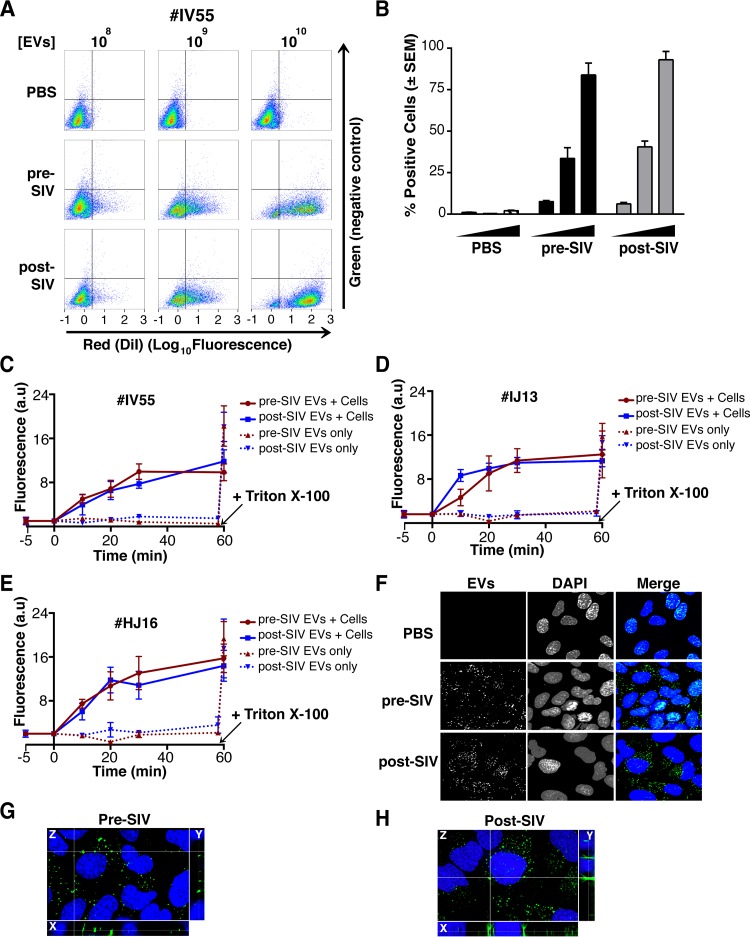
FIG 7 EVs taken from macaque plasma are competent for adsorption and deposit packaged materials into recipient cells. (A) EVs were labeled with the membrane dye DiI and added to recipient cells in a dose-dependent manner. Flow cytometry analysis of U2OS (recipient) cells shows that the fluorophore was transferred by EVs taken from animal IV55 pre- and postinfection with SIV but not by PBS (T = 8 h). (B) Plot of the percentages of positive cells gated for panel A. (C) EVs taken from IV55 are capable of membrane fusion. EVs taken pre- and postinfection with SIV were labeled with the self-quenching dye R18 and added to cells or empty wells. Fluorescence was monitored over time. As a control, Triton X-100 was added to the EVs in empty wells to disperse the fluorophore at the plateau phase. (D) Same as panel C but for EVs from IJ13. (E) Same as panel C but for EVs from HJ16. (F) EVs taken from animal IV55 pre- and postinfection with SIV were labeled with the esterase reporter ExoGlow Green, added to cells, and monitored for adsorption. Single-plane images were deconvoluted from three-dimensional Z-stacks. ExoGlow Green was added to PBS as a negative control. (G) Enlarged three-dimensional view of cells treated with EVs taken from animal IV55 preinfection with SIV. (H) Enlarged three-dimensional view of cells treated with EVs taken from animal IV55 postinfection with SIV. a.u., arbitrary units.
FIG 7 EVs taken from macaque plasma are competent for adsorption and deposit packaged materials into recipient cells. (A) EVs were labeled with the membrane dye DiI and added to recipient cells in a dose-dependent manner. Flow cytometry analysis of U2OS (recipient) cells shows that the fluorophore was transferred by EVs taken from animal IV55 pre- and postinfection with SIV but not by PBS (T = 8 h). (B) Plot of the percentages of positive cells gated for panel A. (C) EVs taken from IV55 are capable of membrane fusion. EVs taken pre- and postinfection with SIV were labeled with the self-quenching dye R18 and added to cells or empty wells. Fluorescence was monitored over time. As a control, Triton X-100 was added to the EVs in empty wells to disperse the fluorophore at the plateau phase. (D) Same as panel C but for EVs from IJ13. (E) Same as panel C but for EVs from HJ16. (F) EVs taken from animal IV55 pre- and postinfection with SIV were labeled with the esterase reporter ExoGlow Green, added to cells, and monitored for adsorption. Single-plane images were deconvoluted from three-dimensional Z-stacks. ExoGlow Green was added to PBS as a negative control. (G) Enlarged three-dimensional view of cells treated with EVs taken from animal IV55 preinfection with SIV. (H) Enlarged three-dimensional view of cells treated with EVs taken from animal IV55 postinfection with SIV. a.u., arbitrary units.CC BY · PubMed Central
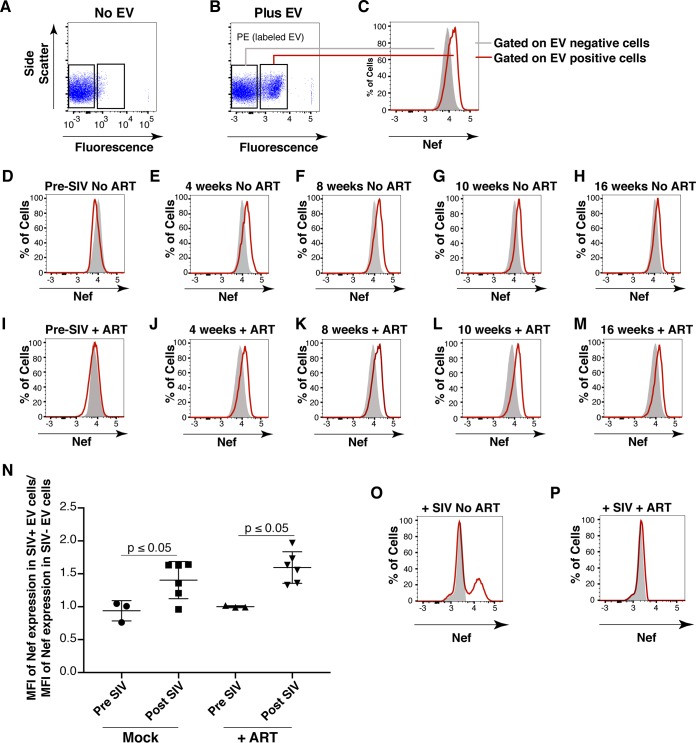
FIG 8 Detection of Nef in EV-transduced cells. (A) Primary CD4+ T cells were analyzed for intrinsic fluorescence (PE gate) and gated. (B) Primary CD4+ T cells treated with labeled EVs were gated into EV-positive and EV-negative populations on the basis of fluorescence. (C) Representative scheme for detection of Nef (FITC channel) by using the gates set up for panel B. Solid gray fill represents EV-negative cells, and a red line represents EV-positive cells. (D) EVs isolated from macaque IV55 preinfection with SIV were labeled and added to purified primary CD4+ T cells. Cells were gated as for panels B and C, and the FITC shift was absent (no Nef). EVs isolated from macaque IV55 at weeks 4 (E), 8 (F), 10 (G), and 16 (H) postinfection with SIV were added to CD4+ T cells. Cells were gated as for panels B and C, and the FITC shift (Nef) in EV-positive cells was observed. (I) EVs isolated from macaque IV55 preinfection with SIV were labeled and added to CD4+ T cells in the presence of ART drugs. Cells were gated as for panels B and C, and the FITC shift was absent (no Nef). EVs isolated from macaque IV55 at weeks 4 (J), 8 (K), 10 (L), and 16 (M) postinfection with SIV were added to CD4+ T cells in the presence of ART drugs. Cells were gated as for panels B and C, and the FITC shift (Nef) in EV-positive cells was observed. (N) Plot comparing the MFI of the Nef signals in EV+ and EV− cells compiling all time points after SIV infection in independent experiments. Each symbol represents the MFI of Nef in EV+ cells divided by the MFI of Nef in EV− cells in the same well. The ratios cluster around 1 at preinfection time points, verifying that Nef is absent from EVs isolated from animal IV55 before SIV infection. (O) Primary CD4+ T cells were mock treated (solid gray) or infected with SIVmac239 (red line), and an FITC shift (Nef) was detected only in infected cells. (P) Same as panel O but cells were treated with ART drugs to block infection.
FIG 8 Detection of Nef in EV-transduced cells. (A) Primary CD4+ T cells were analyzed for intrinsic fluorescence (PE gate) and gated. (B) Primary CD4+ T cells treated with labeled EVs were gated into EV-positive and EV-negative populations on the basis of fluorescence. (C) Representative scheme for detection of Nef (FITC channel) by using the gates set up for panel B. Solid gray fill represents EV-negative cells, and a red line represents EV-positive cells. (D) EVs isolated from macaque IV55 preinfection with SIV were labeled and added to purified primary CD4+ T cells. Cells were gated as for panels B and C, and the FITC shift was absent (no Nef). EVs isolated from macaque IV55 at weeks 4 (E), 8 (F), 10 (G), and 16 (H) postinfection with SIV were added to CD4+ T cells. Cells were gated as for panels B and C, and the FITC shift (Nef) in EV-positive cells was observed. (I) EVs isolated from macaque IV55 preinfection with SIV were labeled and added to CD4+ T cells in the presence of ART drugs. Cells were gated as for panels B and C, and the FITC shift was absent (no Nef). EVs isolated from macaque IV55 at weeks 4 (J), 8 (K), 10 (L), and 16 (M) postinfection with SIV were added to CD4+ T cells in the presence of ART drugs. Cells were gated as for panels B and C, and the FITC shift (Nef) in EV-positive cells was observed. (N) Plot comparing the MFI of the Nef signals in EV+ and EV− cells compiling all time points after SIV infection in independent experiments. Each symbol represents the MFI of Nef in EV+ cells divided by the MFI of Nef in EV− cells in the same well. The ratios cluster around 1 at preinfection time points, verifying that Nef is absent from EVs isolated from animal IV55 before SIV infection. (O) Primary CD4+ T cells were mock treated (solid gray) or infected with SIVmac239 (red line), and an FITC shift (Nef) was detected only in infected cells. (P) Same as panel O but cells were treated with ART drugs to block infection.CC BY · PubMed Central
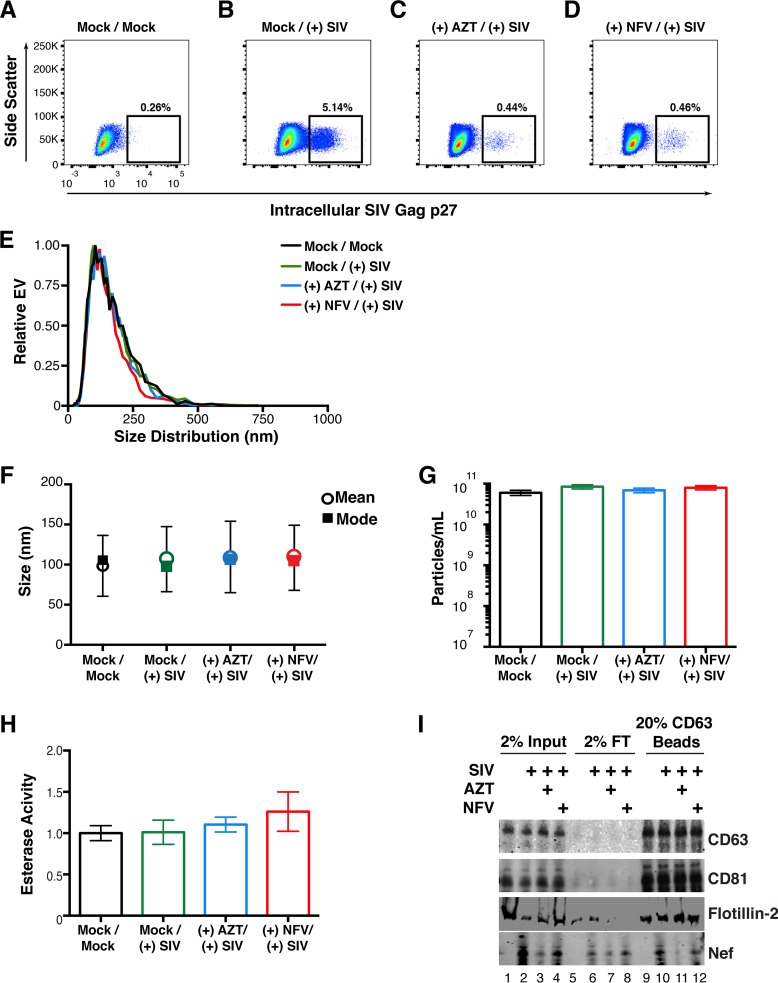
FIG 9 Detection of Nef in EVs from SIV-infected primary cells. (A) Primary PBMCs were isolated from rhesus macaques, mock treated, and stained for intracellular SIV Gag (p27) after 5 days. (B) Primary PBMCs were isolated from rhesus macaques, infected with SIVmac239 at an MOI of 10, and stained for intracellular SIV Gag 5 days postinfection. (C) Primary PBMCs were isolated from rhesus macaques and treated with the reverse transcriptase inhibitor AZT (100 nM). Twenty-four hours later, the cells were infected with SIVmac239 at an MOI of 10 and stained for intracellular SIV Gag 5 days postinfection. (D) Primary PBMCs were isolated from rhesus macaques and treated with the viral protease inhibitor NFV (100 nM). Twenty-four hours later, the cells were infected with SIVmac239 at an MOI of 10 and stained for intracellular SIV Gag 5 days postinfection. (E) Size distribution analysis of EVs isolated from the supernatant of simian macaque primary PBMCs infected with SIVmac239 (see Materials and Methods). Videos of EV populations were taken to determine size distributions (11 measurements per group with a total of three biological replicates). The peak size was arbitrarily set to 1 for each group. (F) Mean and mode sizes of EVs from the PBMCs treated for panel A. n = 3 per group. (G) Total EV concentration (particles per milliliter) in supernatant of PBMCs treated for panel A. n = 3 per group. (H) Esterase activity of EVs isolated from the PBMCs treated for panel A. All values are standardized to the Mock/Mock group. n = 3 per group. (I) SIV Nef is present in CD63+ affinity-purified EVs taken from infected PBMCs. Total EVs from panel A were added to CD63 antibody-coated beads and assayed for the presence of Nef. Input, total EV population; flowthrough (FT), unbound fraction; CD63 Beads, contents bound to CD63 beads.
FIG 9 Detection of Nef in EVs from SIV-infected primary cells. (A) Primary PBMCs were isolated from rhesus macaques, mock treated, and stained for intracellular SIV Gag (p27) after 5 days. (B) Primary PBMCs were isolated from rhesus macaques, infected with SIVmac239 at an MOI of 10, and stained for intracellular SIV Gag 5 days postinfection. (C) Primary PBMCs were isolated from rhesus macaques and treated with the reverse transcriptase inhibitor AZT (100 nM). Twenty-four hours later, the cells were infected with SIVmac239 at an MOI of 10 and stained for intracellular SIV Gag 5 days postinfection. (D) Primary PBMCs were isolated from rhesus macaques and treated with the viral protease inhibitor NFV (100 nM). Twenty-four hours later, the cells were infected with SIVmac239 at an MOI of 10 and stained for intracellular SIV Gag 5 days postinfection. (E) Size distribution analysis of EVs isolated from the supernatant of simian macaque primary PBMCs infected with SIVmac239 (see Materials and Methods). Videos of EV populations were taken to determine size distributions (11 measurements per group with a total of three biological replicates). The peak size was arbitrarily set to 1 for each group. (F) Mean and mode sizes of EVs from the PBMCs treated for panel A. n = 3 per group. (G) Total EV concentration (particles per milliliter) in supernatant of PBMCs treated for panel A. n = 3 per group. (H) Esterase activity of EVs isolated from the PBMCs treated for panel A. All values are standardized to the Mock/Mock group. n = 3 per group. (I) SIV Nef is present in CD63+ affinity-purified EVs taken from infected PBMCs. Total EVs from panel A were added to CD63 antibody-coated beads and assayed for the presence of Nef. Input, total EV population; flowthrough (FT), unbound fraction; CD63 Beads, contents bound to CD63 beads.CC BY · PubMed Central

Verification

Claims the paper makes

The claims and statistics of this paper haven’t been checked yet.

Run the check — free, no account needed. It reads the open-access text and checks the sources it cites.

A few free checks a day · papers already verified open instantly · results are public

Claims other papers make about this one

Each is checked against this paper’s own text: does it say what the citing paper says it does?

Self-check

Percentages, sums and reported differences re-computed from the paper’s own numbers.

The self-check needs the paper’s full text.

Citations

Cites

Show all 85 references

Cited by

Sorted by citations

See all 109

Metadata

Authors
McNamara, R. P., Costantini, L. M., Myers, T. A., Schouest, B., Maness, N. J., Griffith, J. D., Damania, B. A., MacLean, A. G., & Dittmer, D. P.
Affiliations
  • University of North Carolina at Chapel Hill (US)
  • Tulane National Primate Research Center, Tulane University, Covington, Louisiana, USA
  • Tulane University (US)
Corresponding author
  • MacLean, Andrew G.
  • Dittmer, Dirk P.
Venue
mBio
Published
2018-03-07
Volume
9
Issue
1
ISSN
  • 2150-7511 (ISSN-L)
  • 2161-2129
OpenAlex
W2790992461
Cited by
109
References
85
Citations by year
2026: 7 · 2025: 11 · 2024: 9 · 2023: 8 · 2022: 12 · 2021: 16 · 2020: 19 · 2019: 17 · 2018: 10
FWCI
5.51
Type
journal article
Language
en
Open access
Locations
  • mBio (publishedVersion, cc-by)
  • Europe PMC (PubMed Central) (publishedVersion, cc-by)
  • PubMed Central (publishedVersion, cc-by)
  • PubMed (publishedVersion)
  • DOAJ (DOAJ: Directory of Open Access Journals) (submittedVersion, cc-by-sa)
Funders
  • HHS | NIH | National Cancer Institute (CA016086)
  • HHS | National Institutes of Health (OD11104, K12GM000678)
  • HHS | NIH | National Institute of Allergy and Infectious Diseases (T32AI007151)
  • HHS | NIH | National Institute of General Medical Sciences (MH07544)
  • HHS| NIH| National Institute of General Medical Sciences (MH113517)
  • HHS | NIH | National Institute on Drug Abuse (DA040394)
Topics
  • Life Sciences › Biochemistry, Genetics and Molecular Biology › Molecular Biology › Extracellular vesicles in disease
  • Life Sciences › Immunology and Microbiology › Virology › HIV Research and Treatment
  • Life Sciences › Biochemistry, Genetics and Molecular Biology › Cell Biology › Cellular transport and secretion
Keywords
HIV-1 Nef, extracellular vesicles, exosomes, exosome biogenesis, HIV pathogenesis, CD4-negative cells, AIDS progression, intercellular protein transfer
MeSH terms
Animals, Cells, Cultured, Humans, Macaca, Simian Immunodeficiency Virus, HIV-1, Gene Products, nef, Protein Transport, Exosomes

About these checks

Registry, retraction, Cites and statistics results are computed, not judged, with one exception: a printed reference that no index lists is read once by a model before it counts as a citation error. Claims are extracted by a model and kept only when their quote appears verbatim in the text; each cited source is then checked, with a model’s help, for whether it says what the claim relies on. Those verdicts can be wrong — read the claim’s quote and the cited source before relying on one.

Statistics and arithmetic are recomputed, not judged.

Confidence bands are shown only for fields calibrated on our annotated test set. None is calibrated yet, so no band is shown.

What counts as a claim ›How we measure confidence ›How we check this ›

Are you an author, or do you see a problem with this page? Request a review