Cited by 29Bacterial Genetics and BiotechnologyGene Regulatory Network AnalysisEscherichia coli research studies

The DOI matches its Crossref record; 4 of the 4 references it cites were found in a registry or an index.

High osmolarity modulates bacterial cell size through reducing initiation volume in Escherichia coli.

Open access
Dai, Xiongfeng, Zhu, Manlu·2018·mSphere

Abstract

Bacterial cell size depends on growth rate, cell cycle progression, and the cell volume per origin upon initiating chromosome replication (initiation volume). Here, we perform the first systematic and quantitative study of the effect of hyperosmotic stress on the E. coli cell size and cell cycle. We find that hyperosmotic stress significantly reduces the initiation volume. The reduced initiation volume is attributed to the increased DnaA concentration caused by water loss at high osmolarity, indicating a fundamental role of water content in cell size and cell cycle regulation.

Overview

The claims and statistics of this paper haven’t been checked yet.

Run the check — free, no account needed. It reads the open-access text and checks the sources it cites.

A few free checks a day · papers already verified open instantly · results are public

Integrity signals

Registry

Crossref · 10.1128/msphere.00430-18

Cites

4 of 4 references verified0 citation errors · 0 not checkable

Statistics

Figures

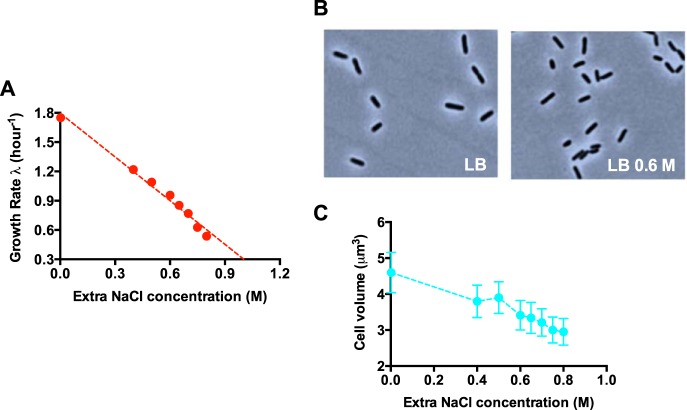
FIG 1 Cell size and growth rate of E. coli under hyperosmotic stress. (A) Growth rate of E. coli in different osmolarities. The original LB medium (containing 1% NaCl) is supplemented with different concentrations of extra NaCl. (B) Phase-contrast images of E. coli at different osmolarities. (C) Average cell volume of E. coli at different osmolarities.
FIG 1 Cell size and growth rate of E. coli under hyperosmotic stress. (A) Growth rate of E. coli in different osmolarities. The original LB medium (containing 1% NaCl) is supplemented with different concentrations of extra NaCl. (B) Phase-contrast images of E. coli at different osmolarities. (C) Average cell volume of E. coli at different osmolarities.CC BY · PubMed Central
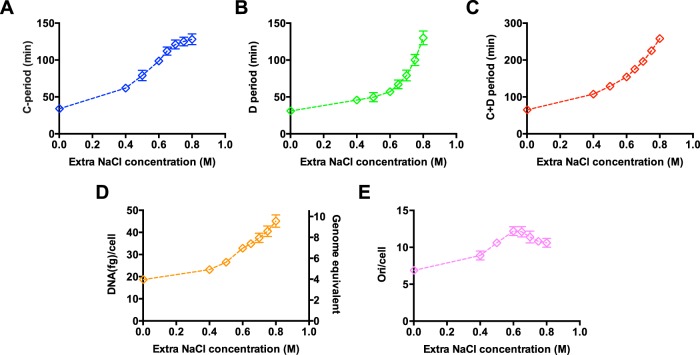
FIG 2 Cell cycle parameters and DNA content of E. coli under hyperosmotic stress. Cells were grown in LB medium supplemented with different levels of sodium chloride as in Fig. 1. (A) C period of E. coli at different osmolarities. (B) D period of E. coli at different osmolarities. (C) C+D period of E. coli at different osmolarities. (D) Cellular DNA content of E. coli at different osmolarities. (E) Chromosome origins per cell of E. coli at different osmolarities. The chromosome origin/cell equals 2(C+D)/τ. Data are average of the results from triplicates, with standard deviations being within 5% to 10%.
FIG 2 Cell cycle parameters and DNA content of E. coli under hyperosmotic stress. Cells were grown in LB medium supplemented with different levels of sodium chloride as in Fig. 1. (A) C period of E. coli at different osmolarities. (B) D period of E. coli at different osmolarities. (C) C+D period of E. coli at different osmolarities. (D) Cellular DNA content of E. coli at different osmolarities. (E) Chromosome origins per cell of E. coli at different osmolarities. The chromosome origin/cell equals 2(C+D)/τ. Data are average of the results from triplicates, with standard deviations being within 5% to 10%.CC BY · PubMed Central
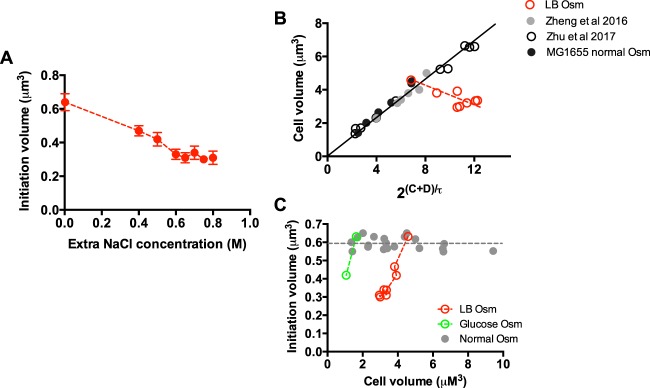
FIG 3 Initiation volume of E. coli under hyperosmotic stress. (A) Initiation volume of E. coli growing in LB medium with different osmolarities (Osm). Data are average of the results from triplicates, with standard deviations being within 5% to 10%. (B) Correlation between the cell size and 2(C+D)/τ in normal osmolarity and high osmolarity. Data points of LB medium with different osmolarities (red points) correspond to data in Fig. 1C and 2E. The data points in normal osmolarity originate from Fig. S3, a study by Zheng et al. (11), and a study by Zhu et al. (13), and fit with a linear line. For the study by Zhu et al., the strain used was wild-type K-12 NCM3722. Data points of the NCM3722 strain are plotted together with that of the MG1655 strain because of their similar initiation volumes found at normal osmolarity, ∼0.6 µM3. (C) Correlation between the initiation volume and cell size at normal osmolarity and high osmolarity. Data points at normal osmolarity originate from Fig. S3, a study by Zheng et al., and a study by Zhu et al. Data points of high osmolarity in both LB medium and glucose medium correspond to data in Fig. 1C, 3A, and S1B and F.
FIG 3 Initiation volume of E. coli under hyperosmotic stress. (A) Initiation volume of E. coli growing in LB medium with different osmolarities (Osm). Data are average of the results from triplicates, with standard deviations being within 5% to 10%. (B) Correlation between the cell size and 2(C+D)/τ in normal osmolarity and high osmolarity. Data points of LB medium with different osmolarities (red points) correspond to data in Fig. 1C and 2E. The data points in normal osmolarity originate from Fig. S3, a study by Zheng et al. (11), and a study by Zhu et al. (13), and fit with a linear line. For the study by Zhu et al., the strain used was wild-type K-12 NCM3722. Data points of the NCM3722 strain are plotted together with that of the MG1655 strain because of their similar initiation volumes found at normal osmolarity, ∼0.6 µM3. (C) Correlation between the initiation volume and cell size at normal osmolarity and high osmolarity. Data points at normal osmolarity originate from Fig. S3, a study by Zheng et al., and a study by Zhu et al. Data points of high osmolarity in both LB medium and glucose medium correspond to data in Fig. 1C, 3A, and S1B and F.CC BY · PubMed Central
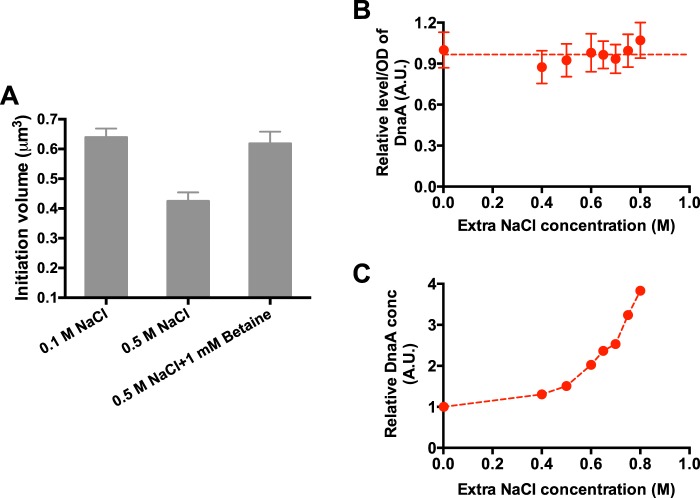
FIG 4 DnaA concentrations at different osmolarities. (A) Initiation volume of E. coli growing in glucose medium of normal osmolarity (0.1 M NaCl), high osmolarity (0.5 M NaCl), and high osmolarity supplemented with 1 mM betaine. (B) DnaA content/OD600 at LB medium supplemented with different osmolarities. Data are average of the results from triplicates, with standard deviations being within 15%. A.U., absorbance units. (C) Relative DnaA concentration (conc) at LB medium of different osmolarities. It corresponds to DnaA content (per OD quantity) normalized by the water content (Fig. S5F).
FIG 4 DnaA concentrations at different osmolarities. (A) Initiation volume of E. coli growing in glucose medium of normal osmolarity (0.1 M NaCl), high osmolarity (0.5 M NaCl), and high osmolarity supplemented with 1 mM betaine. (B) DnaA content/OD600 at LB medium supplemented with different osmolarities. Data are average of the results from triplicates, with standard deviations being within 15%. A.U., absorbance units. (C) Relative DnaA concentration (conc) at LB medium of different osmolarities. It corresponds to DnaA content (per OD quantity) normalized by the water content (Fig. S5F).CC BY · PubMed Central
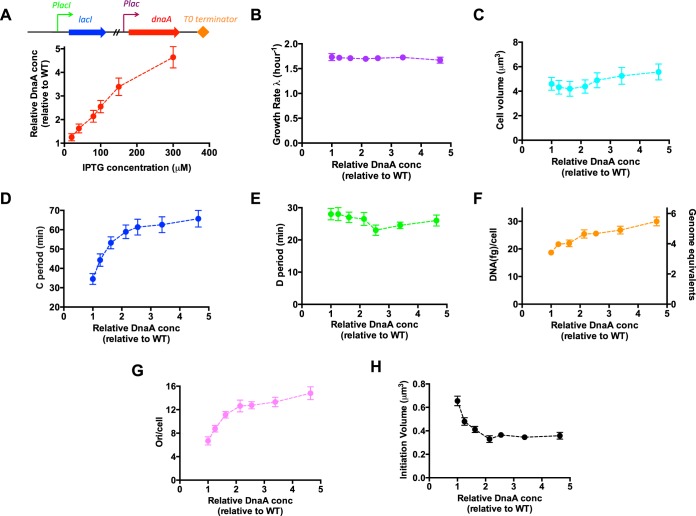
FIG 5 Cell size and cell cycle parameters of E. coli strain overexpressing DnaA protein at normal osmolarity. Cells were grown in LB medium. (A) Relative DnaA concentrations at different IPTG inducer levels. The DnaA concentration of wild-type cells is set as “1”. The expression of DnaA is driven by the Plac promoter, which is under the regulation of the LacI repressor. (B) Growth rate of E. coli upon DnaA overexpression. (C) Cell size of E. coli upon DnaA overexpression. (D) C period of E. coli upon DnaA overexpression. (E) D period of E. coli upon DnaA overexpression. (F) Average DNA content per cell of E. coli upon DnaA overexpression. (G) Origins per cell of E. coli upon DnaA overexpression. (H) Initiation volume of E. coli upon DnaA overexpression. Data are average of the results from triplicates, with standard deviations being within 5% to 10%.
FIG 5 Cell size and cell cycle parameters of E. coli strain overexpressing DnaA protein at normal osmolarity. Cells were grown in LB medium. (A) Relative DnaA concentrations at different IPTG inducer levels. The DnaA concentration of wild-type cells is set as “1”. The expression of DnaA is driven by the Plac promoter, which is under the regulation of the LacI repressor. (B) Growth rate of E. coli upon DnaA overexpression. (C) Cell size of E. coli upon DnaA overexpression. (D) C period of E. coli upon DnaA overexpression. (E) D period of E. coli upon DnaA overexpression. (F) Average DNA content per cell of E. coli upon DnaA overexpression. (G) Origins per cell of E. coli upon DnaA overexpression. (H) Initiation volume of E. coli upon DnaA overexpression. Data are average of the results from triplicates, with standard deviations being within 5% to 10%.CC BY · PubMed Central
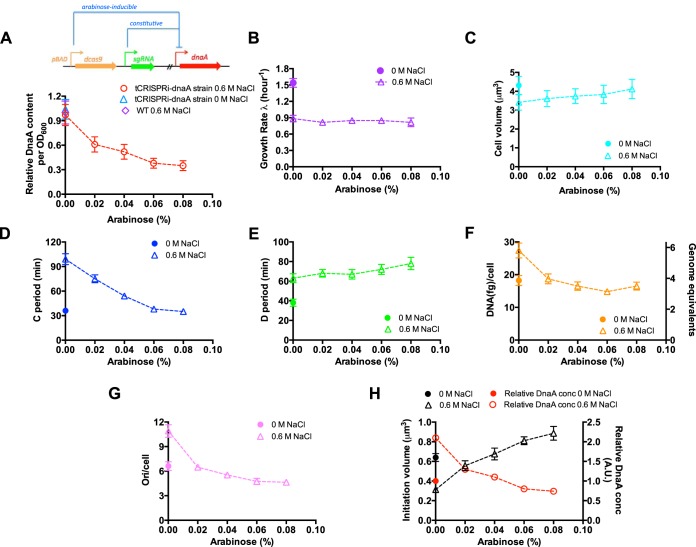
FIG 6 Cell size and cell cycle parameters of the E. coli tCRISPRi-DnaA strain at a fixed high osmolarity. Cells were grown at a fixed high osmolarity (LB plus 0.6 M NaCl medium). The expression of DnaA protein is repressed by the CRISPR-dcas9 system in an arabinose-dose-dependent manner. (A) Relative DnaA content (per OD600 quantity) of the tCRISPRi-DnaA strain growing in LB plus 0.6 M NaCl medium supplemented with different levels of arabinose (red circles). The blue triangle corresponds the relative DnaA content of the tCRISPRi-DnaA strain growing in normal LB medium. The DnaA content of wild-type cells at LB plus 0.6 M NaCl (purple symbol) is set as “1”. (B) Growth rate of E. coli at high osmolarity upon DnaA knockdown (purple open triangles). (C) Cell size of E. coli at high osmolarity upon DnaA knockdown (cyan open triangles). (D) C period of E. coli at high osmolarity upon DnaA knockdown (blue open triangles). (E) D period of E. coli at high osmolarity upon DnaA knockdown (green open triangles). (F) Average DNA amount per cell of E. coli at high osmolarity upon DnaA knockdown (orange open triangles). (G) Origins per cell of E. coli at high osmolarity upon DnaA knockdown (pink open triangles). (H) Initiation volume (black triangles) of E. coli at high osmolarity upon DnaA knockdown. The relative DnaA concentration (red circles) corresponds to DnaA content per OD (panel A) normalized by the water content (triangles in Fig. S5F). Data are average of the results from triplicates, with standard deviations being ∼10%.
FIG 6 Cell size and cell cycle parameters of the E. coli tCRISPRi-DnaA strain at a fixed high osmolarity. Cells were grown at a fixed high osmolarity (LB plus 0.6 M NaCl medium). The expression of DnaA protein is repressed by the CRISPR-dcas9 system in an arabinose-dose-dependent manner. (A) Relative DnaA content (per OD600 quantity) of the tCRISPRi-DnaA strain growing in LB plus 0.6 M NaCl medium supplemented with different levels of arabinose (red circles). The blue triangle corresponds the relative DnaA content of the tCRISPRi-DnaA strain growing in normal LB medium. The DnaA content of wild-type cells at LB plus 0.6 M NaCl (purple symbol) is set as “1”. (B) Growth rate of E. coli at high osmolarity upon DnaA knockdown (purple open triangles). (C) Cell size of E. coli at high osmolarity upon DnaA knockdown (cyan open triangles). (D) C period of E. coli at high osmolarity upon DnaA knockdown (blue open triangles). (E) D period of E. coli at high osmolarity upon DnaA knockdown (green open triangles). (F) Average DNA amount per cell of E. coli at high osmolarity upon DnaA knockdown (orange open triangles). (G) Origins per cell of E. coli at high osmolarity upon DnaA knockdown (pink open triangles). (H) Initiation volume (black triangles) of E. coli at high osmolarity upon DnaA knockdown. The relative DnaA concentration (red circles) corresponds to DnaA content per OD (panel A) normalized by the water content (triangles in Fig. S5F). Data are average of the results from triplicates, with standard deviations being ∼10%.CC BY · PubMed Central
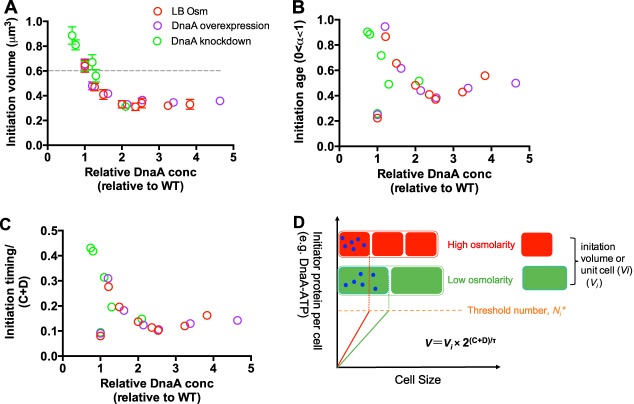
FIG 7 Quantitative correlation of initiation volume, initiation age, and initiation timing/(C+D) period with the DnaA concentration. (A) Correlation between the initiation volume and DnaA concentration under three conditions. Data points of hyperosmotic stress in LB medium are from Fig. 3A and 4C. Data points of DnaA overexpression are the same as those in Fig. 5H. Data points of DnaA knockdown at high osmolarity (LB plus 0.6 M NaCl) are the same as those in Fig. 6H.The DnaA concentration of wild-type cells growing in normal LB medium is set as “1”. The gray dashed line denotes the initiation volume at normal osmolarity. Data are average of the results from triplicates, with standard deviations being ∼10%. (B) Correlation between the initiation age and DnaA concentration under three conditions. (C) Correlation between initiation timing/(C+D) period and DnaA concentration under three conditions. (D) The threshold initiation model.
FIG 7 Quantitative correlation of initiation volume, initiation age, and initiation timing/(C+D) period with the DnaA concentration. (A) Correlation between the initiation volume and DnaA concentration under three conditions. Data points of hyperosmotic stress in LB medium are from Fig. 3A and 4C. Data points of DnaA overexpression are the same as those in Fig. 5H. Data points of DnaA knockdown at high osmolarity (LB plus 0.6 M NaCl) are the same as those in Fig. 6H.The DnaA concentration of wild-type cells growing in normal LB medium is set as “1”. The gray dashed line denotes the initiation volume at normal osmolarity. Data are average of the results from triplicates, with standard deviations being ∼10%. (B) Correlation between the initiation age and DnaA concentration under three conditions. (C) Correlation between initiation timing/(C+D) period and DnaA concentration under three conditions. (D) The threshold initiation model.CC BY · PubMed Central

Verification

Claims the paper makes

The claims and statistics of this paper haven’t been checked yet.

Run the check — free, no account needed. It reads the open-access text and checks the sources it cites.

A few free checks a day · papers already verified open instantly · results are public

Claims other papers make about this one

Each is checked against this paper’s own text: does it say what the citing paper says it does?

Self-check

Percentages, sums and reported differences re-computed from the paper’s own numbers.

The self-check needs the paper’s full text.

Citations

Cites

Show all 4 references

Research works printed but not linked: 39

  1. 10.1016/j.cub.2012.02.032 · DOI
  2. 10.1016/j.cub.2014.12.009 · DOI
  3. 10.1016/j.mib.2015.01.011 · DOI
  4. 10.1146/annurev-micro-090816-093803 · DOI
  5. 10.1016/j.cub.2017.05.076 · DOI
  6. 10.1128/ecosal.5.2.3 · DOI · Paper page
  7. 10.1038/nrmicro2202 · DOI
  8. 10.1038/2191077a0 · DOI
  9. 10.1016/j.cub.2017.03.022 · DOI
  10. 10.1073/pnas.1617932114 · DOI
  11. 10.15252/msb.20156178 · DOI
  12. 10.1128/mBio.01741-17 · DOI
  13. 10.1038/nchembio.1437 · DOI
  14. Durack DT. 1987. Detection, prevention and management of urinary tract infections. Lea and Febiger, Philadelphia, PA.
  15. 10.1038/nrmicro3432 · DOI
  16. Ross DL, Neely AE. 1983. Textbook of urinalysis and body fluids. Appleton & Lange, New York, NY.
  17. 10.1021/bi0347297 · DOI
  18. 10.1128/mr.53.1.121-147.1989 · DOI · Paper page
  19. 10.1128/MMBR.63.1.230-262.1999 · DOI
  20. 10.1128/mBio.02375-17 · DOI
  21. 10.1074/jbc.M103081200 · DOI
  22. 10.1016/0092-8674(89)90802-7 · DOI
  23. 10.1128/jb.175.20.6537-6545.1993 · DOI
  24. 10.3389/fmicb.2018.00319 · DOI
  25. 10.1038/srep39076 · DOI
  26. 10.1016/0022-2836(68)90425-7 · DOI
  27. 10.1099/00221287-19-3-592 · DOI · Paper page
  28. Nanninga N, Woldringh C. 1985. Cell growth, genome duplication and cell division in Escherichia coli. Academic Press, Inc., London, United Kingdom.
  29. 10.1016/S1369-5274(03)00026-2 · DOI
  30. 10.1088/1361-6633/aaa628 · DOI
  31. 10.1128/jb.173.16.5194-5199.1991 · DOI
  32. 10.1038/newbio241133a0 · DOI
  33. 10.1016/0923-2508(91)90025-6 · DOI
  34. 10.1111/j.1365-2958.2006.05493.x · DOI
  35. 10.1038/nmicrobiol.2016.231 · DOI
  36. 10.1128/mSphere.00095-18 · DOI
  37. 10.1371/journal.pgen.1002549 · DOI
  38. 10.1128/jb.130.3.1206-1213.1977 · DOI
  39. 10.1128/JB.180.2.265-273.1998 · DOI

Cited by

Sorted by citations

See all 29

Metadata

Authors
Dai, X., & Zhu, M.
Affiliations
Central China Normal University (CN)
Corresponding author
  • Dai, Xiongfeng
  • Zhu, Manlu
Venue
mSphere
Published
2018-10-31
Volume
3
Issue
5
ISSN
2379-5042 (ISSN-L)
OpenAlex
W2897980578
Cited by
29
References
4
Citations by year
2026: 5 · 2025: 4 · 2024: 3 · 2023: 3 · 2022: 2 · 2021: 3 · 2020: 6 · 2019: 3
FWCI
1.84
Type
journal article
Language
en
Open access
Locations
  • mSphere (publishedVersion, cc-by)
  • Europe PMC (PubMed Central) (publishedVersion, cc-by)
  • PubMed Central (publishedVersion, cc-by)
  • PubMed (publishedVersion)
  • DOAJ (DOAJ: Directory of Open Access Journals) (submittedVersion, cc-by-sa)
Funders
National Natural Science Foundation of China (31700039, 31700089, 31870028)
Topics
  • Life Sciences › Biochemistry, Genetics and Molecular Biology › Genetics › Bacterial Genetics and Biotechnology
  • Life Sciences › Biochemistry, Genetics and Molecular Biology › Molecular Biology › Gene Regulatory Network Analysis
  • Life Sciences › Immunology and Microbiology › Microbiology › Escherichia coli research studies
Keywords
hyperosmotic stress, bacterial cell size, Escherichia coli, chromosome replication initiation, cell cycle regulation, water loss, osmolarity
MeSH terms
Bacterial Proteins, Cell Cycle, Cell Division, DNA-Binding Proteins, Escherichia coli, Osmolar Concentration

About these checks

Registry, retraction, Cites and statistics results are computed, not judged, with one exception: a printed reference that no index lists is read once by a model before it counts as a citation error. Claims are extracted by a model and kept only when their quote appears verbatim in the text; each cited source is then checked, with a model’s help, for whether it says what the claim relies on. Those verdicts can be wrong — read the claim’s quote and the cited source before relying on one.

Statistics and arithmetic are recomputed, not judged.

Confidence bands are shown only for fields calibrated on our annotated test set. None is calibrated yet, so no band is shown.

What counts as a claim ›How we measure confidence ›How we check this ›

Are you an author, or do you see a problem with this page? Request a review

How to cite

Cite CoChat for the checks on this page, and the paper for its own findings.

This page
CoChat. (2026). Citation check: High osmolarity modulates bacterial cell size through reducing initiation volume in Escherichia coli. https://app.cochat.ai/papers/10.1128/msphere.00430-18
The paper
Dai, X., & Zhu, M. (2018). High osmolarity modulates bacterial cell size through reducing initiation volume in Escherichia coli. mSphere. https://doi.org/10.1128/msphere.00430-18