

The DOI matches its Crossref record; 26 of the 26 references it cites were found in a registry or an index.
Evaluating the Information Content of Shallow Shotgun Metagenomics
Open accessAbstract
A common refrain in recent microbiome-related academic meetings is that the field needs to move away from broad taxonomic surveys using 16S sequencing and toward more powerful longitudinal studies using shotgun sequencing. However, performing deep shotgun sequencing in large longitudinal studies remains prohibitively expensive for all but the most well-funded research labs and consortia, which leads many researchers to choose 16S sequencing for large studies, followed by deep shotgun sequencing on a subset of targeted samples. Here, we show that shallow- or moderate-depth shotgun sequencing may be used by researchers to obtain species-level taxonomic and functional data at approximately the same cost as amplicon sequencing. While shallow shotgun sequencing is not intended to replace deep shotgun sequencing for strain-level characterization, we recommend that microbiome scientists consider using shallow shotgun sequencing instead of 16S sequencing for large-scale human microbiome studies.
Overview
The claims and statistics of this paper haven’t been checked yet.
Run the check — free, no account needed. It reads the open-access text and checks the sources it cites.
Integrity signals
Registry
Cites
Statistics
Figures
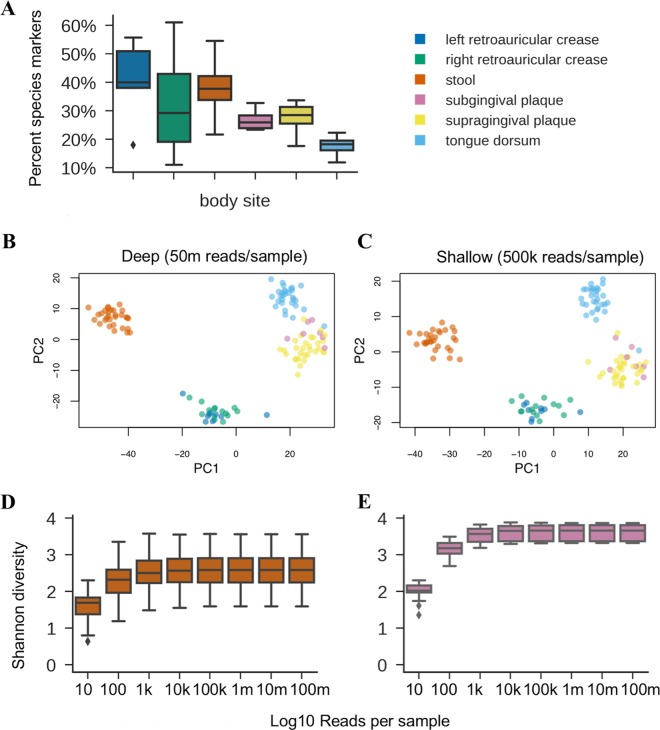
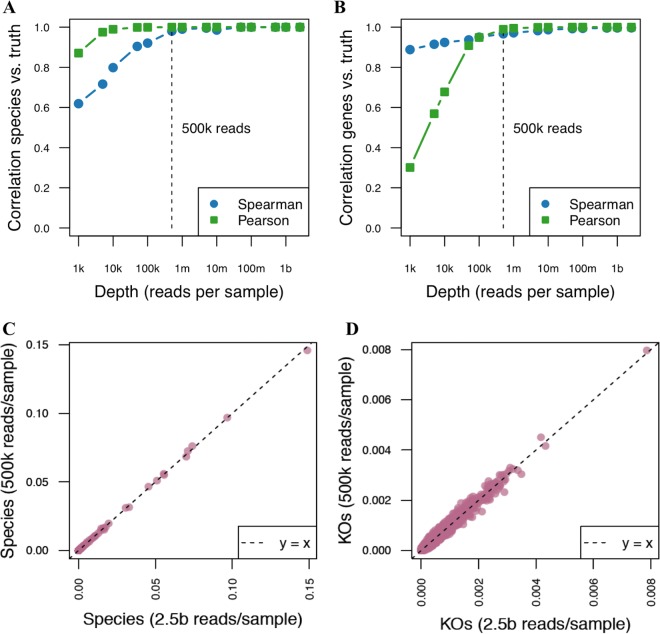
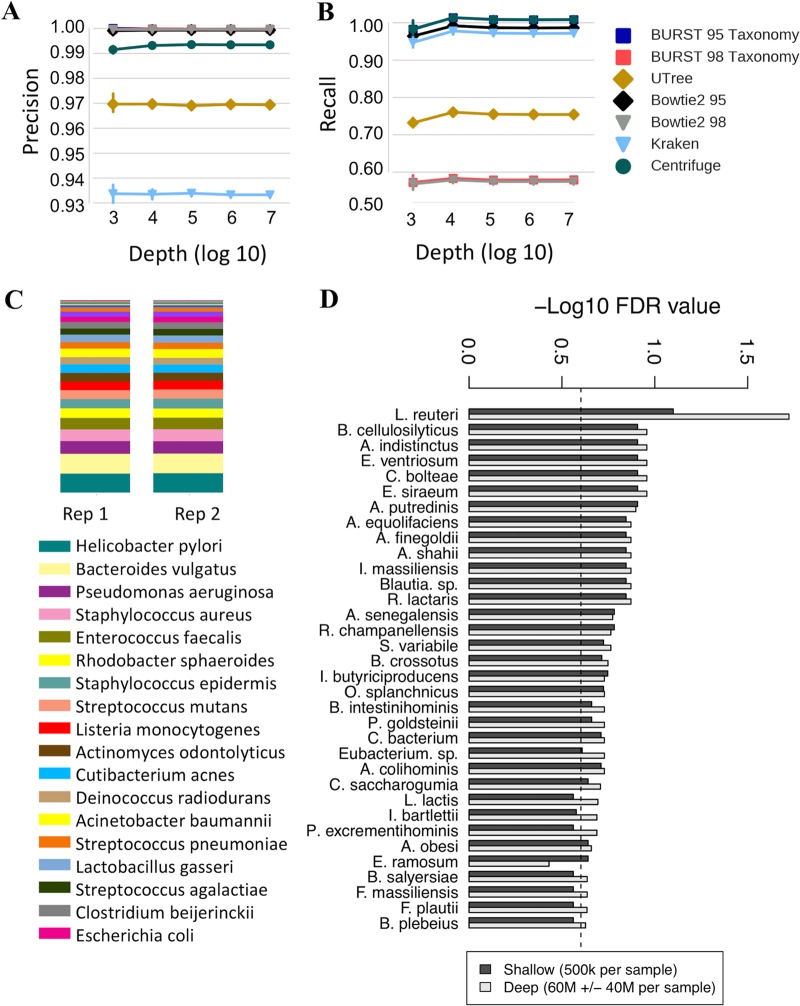
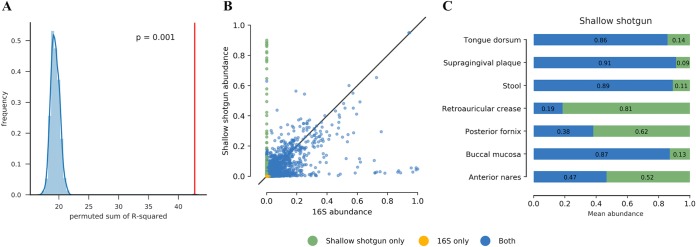
Verification
Claims the paper makes
The claims and statistics of this paper haven’t been checked yet.
Run the check — free, no account needed. It reads the open-access text and checks the sources it cites.
Claims other papers make about this one
Each is checked against this paper’s own text: does it say what the citing paper says it does?
In the citing paper
“we repeated all bioinformatic, normalization, and ML steps using bacterial assignments from SHOGUN31 and its separate database48, which showed highly concordant performances”
From RETRACTED ARTICLE: Microbiome analyses of blood and tissues suggest cancer diagnostic approach (2020) · cites this paper as [31]
Self-check
Percentages, sums and reported differences re-computed from the paper’s own numbers.
The self-check needs the paper’s full text.
Citations
Cites
Fast gapped-read alignment with Bowtie 2
Langmead, B., & Salzberg, S. L. (2012) · Nature Methods · doi:10.1038/nmeth.1923 · Cited by 56,400 · cited 5×
“Instead, we selected several tools representing different approaches to database search for comparison, including exhaustive semiglobal gapped alignment (18, 19), heuristic gapped alignment using the Burrows-Wheeler transformation (23), and k-mer-based searching (21, 25).”
MethodInfluentialStructure, function and diversity of the healthy human microbiome
The Human Microbiome Project Consortium (2012) · Nature · doi:10.1038/nature11234 · Cited by 11,726 · cited 4×
“5 million sequences per sample, as demonstrated on deep whole-genome sequencing (WMS) samples from the Human Microbiome Project (HMP) data set (4), the HMP mock community (12), a diabetes study (17), simulated human gut microbiomes, and two novel human stool samples on which we performed ultradeep sequencing of 2.”
BackgroundMethodInfluentialNeedleman, S. B., & Wunsch, C. D. (1970) · Journal of Molecular Biology · doi:10.1016/0022-2836(70)90057-4 · Cited by 11,288 · cited 5×
“Instead, we selected several tools representing different approaches to database search for comparison, including exhaustive semiglobal gapped alignment (18, 19), heuristic gapped alignment using the Burrows-Wheeler transformation (23), and k-mer-based searching (21, 25).”
MethodInfluentialPredictive functional profiling of microbial communities using 16S rRNA marker gene sequences
Langille, M. G. I., Zaneveld, J., Caporaso, J. G., McDonald, D., Knights, D., Reyes, J. A., Clemente, J. C., Burkepile, D. E., Vega Thurber, R. L., Knight, R., et al. (2013) · Nature Biotechnology · doi:10.1038/nbt.2676 · Cited by 9,116 · cited 3×
“than the correlations of functional profiles predicted from 16S sequencing, which typically has 80% to 90% correlation with the directly observed functions (7, 8).”
BackgroundMethodSelf-citationMcDonald, D. T., Price, M. N., Goodrich, J. K., Nawrocki, E. P., DeSantis, T. Z., Probst, A. J., Andersen, G. L., Knight, R. D., & Hugenholtz, P. (2011) · The ISME Journal · doi:10.1038/ismej.2011.139 · Cited by 5,144 · cited 1×
“16S sequences were aligned to Greengenes version 13_8 (29) at 98% identity with exhaustive gapped alignment (18, 19).”
MethodSelf-citationKEGG for integration and interpretation of large-scale molecular data sets
Kanehisa, M., Goto, S., Sato, Y., Furumichi, M., & Tanabe, M. (2012) · Nucleic Acids Research · doi:10.1093/nar/gkr988 · Cited by 4,848 · cited 6×
“Functional profiling was obtained using KEGG Orthology group (KO) (16) annotations for RefSeq-derived genes (20) from directly observed exhaustive gapped alignments in ultradeep WMS sequencing.”
BackgroundMethodInfluentialKraken: ultrafast metagenomic sequence classification using exact alignments
Wood, D. E., & Salzberg, S. L. (2014) · Genome Biology · doi:10.1186/gb-2014-15-3-r46 · Cited by 4,521 · cited 5×
“Instead, we selected several tools representing different approaches to database search for comparison, including exhaustive semiglobal gapped alignment (18, 19), heuristic gapped alignment using the Burrows-Wheeler transformation (23), and k-mer-based searching (21, 25).”
MethodInfluentialBinning metagenomic contigs by coverage and composition
Alneberg, J., Bjarnason, B. S., de Bruijn, I., Schirmer, M., Quick, J., Ijaz, U. Z., Lahti, L., Loman, N. J., Andersson, A. F., & Quince, C. (2014) · Nature Methods · doi:10.1038/nmeth.3103 · Cited by 2,815 · cited 1×
“These concerns can be alleviated to some extent using deep shotgun sequencing and metagenomic assembly (10), coabundance clustering (11), or proximity-based assembly (28), and de novo identification of strains from complex metagenomes remains an active area of research.”
BackgroundA communal catalogue reveals Earth's multiscale microbial diversity
Thompson, L. R., Sanders, J. G., McDonald, D., Amir, A., Ladau, J., Locey, K. J., Prill, R. J., Tripathi, A., Gibbons, S. M., Ackermann, G., et al. (2017) · Nature · doi:10.1038/nature24621 · Cited by 2,684
Self-citationYarza, P., Yilmaz, P., Pruesse, E., Glöckner, F. O., Ludwig, W., SCHLEIFER, K. H., Whitman, W. B., Euzéby, J. P., Amann, R., & Rossello-Mora, R. A. (2014) · Nature Reviews Microbiology · doi:10.1038/nrmicro3330 · Cited by 2,651 · cited 2×
“variable-region amplicon sequences often do not resolve taxa below the genus or family level, although some species can be differentiated with 16S sequencing (6).”
Background
Cited by
Sorted by citations
Reproducible, interactive, scalable and extensible microbiome data science using QIIME 2
Bolyen, E., Rideout, J. R., Dillon, M. R., Bokulich, N. A., Abnet, C. C., Al-Ghalith, G. A., Alexander, H., Alm, E. J., Arumugam, M., Asnicar, F., et al. (2019) · Nature Biotechnology · doi:10.1038/s41587-019-0209-9 · Cited by 23,742
Self-citationRETRACTED ARTICLE: Microbiome analyses of blood and tissues suggest cancer diagnostic approach
Poore, G. D., Kopylova, E., Zhu, Q., Carpenter, C., Fraraccio, S., Wandro, S., Kosciolek, T., Janssen, S., Metcalf, J., Song, S. J., et al. (2020) · Nature · doi:10.1038/s41586-020-2095-1 · Cited by 989
Self-citationRetractedDaily sampling reveals personalized diet-microbiome associations in humans
Johnson, A. J., Vangay, P., Al-Ghalith, G. A., Hillmann, B. M., Ward, T. L., Shields-Cutler, R. R., Kim, A. D., Shmagel, A. K., Syed, A. N., Walter, J., et al. (2019) · Cell Host & Microbe · doi:10.1016/j.chom.2019.05.005 · Cited by 742
Self-citationEstaki, M., Jiang, L., Bokulich, N. A., McDonald, D. T., González, A., Kościółek, T., Martino, C., Zhu, Q., Birmingham, A., Vázquez‐Baeza, Y., et al. (2020) · Current Protocols in Bioinformatics · doi:10.1002/cpbi.100 · Cited by 588
“In the example below, we demonstrate the use of q2-shogun , a wrapper for the SHOGUN pipeline (Hillmann et al., 2018 --i-reference-reads refseqs.qza \ --i-reference-taxonomy taxonomy.qza \ --i-database bt2-database.qza \ --o-taxa-table taxatable.qza In this example, SHOGUN is called to align query…”
BackgroundMethodInfluentialSelf-citationConsistent and correctable bias in metagenomic sequencing experiments
McLaren, M. R., Willis, A. D., & Callahan, B. J. (2019) · eLife · doi:10.7554/elife.46923 · Cited by 424
“…et al., 2014), exact short-read ribosomal sequence variants and common shotgun profilers group variation at roughly the species level (Edgar, 2018; Hillmann et al., 2018), and metagenome assembly combines strains too similar to be separated by the assembler or by the subsequent binning (Dick,…”
Background
Metadata
- Authors
- Hillmann, B., Al-Ghalith, G. A., Shields-Cutler, R. R., Zhu, Q., Gohl, D. M., Beckman, K. B., Knight, R., & Knights, D.
- Affiliations
- University of Minnesota (US)
- Bioinformatics and Computational Biology, University of Minnesota, Minneapolis, Minnesota, USA
- Biotechnology Institute, University of Minnesota, Minneapolis, Minnesota, USA
- University of California San Diego (US)
- Corresponding author
- Knights, Dan
- ORCID
- Venue
- mSystems
- Publisher
- American Society for Microbiology
- Published
- 2018-10-30
- Volume
- 3
- Issue
- 6
- ISSN
- 2379-5077 (ISSN-L)
- PMC
- PMC6234283
- OpenAlex
- W2951076599
- Cited by
- 474
- References
- 26
- Citations by year
- 2026: 52 · 2025: 66 · 2024: 57 · 2023: 61 · 2022: 60 · 2021: 82 · 2020: 68 · 2019: 24 · 2018: 2
- FWCI
- 15.65
- Type
- journal article
- Language
- en
- Open access
- gold
- doi.org
- Licence
- Locations
- mSystems (publishedVersion, cc-by)
- bioRxiv (Cold Spring Harbor Laboratory) (acceptedVersion, cc-by)
- Europe PMC (PubMed Central) (publishedVersion, cc-by)
- PubMed Central (publishedVersion, cc-by)
- PubMed (publishedVersion)
- DOAJ (DOAJ: Directory of Open Access Journals) (submittedVersion, cc-by-sa)
- DOAJ (DOAJ: Directory of Open Access Journals) (submittedVersion)
- eScholarship (California Digital Library) (submittedVersion)
- eScholarship (California Digital Library) (submittedVersion, cc-by)
- Funders
- HHS | National Institutes of Health (R01AI121383, P01DK078669)
- Topics
- Life Sciences › Biochemistry, Genetics and Molecular Biology › Molecular Biology › Genomics and Phylogenetic Studies
- Life Sciences › Biochemistry, Genetics and Molecular Biology › Molecular Biology › Gut microbiota and health
- Physical Sciences › Environmental Science › Ecology › Microbial Community Ecology and Physiology
- Keywords
- 16S rRNA gene sequencing, functional metagenomics, amplicon sequencing
About these checks
Registry, retraction, Cites and statistics results are computed, not judged, with one exception: a printed reference that no index lists is read once by a model before it counts as a citation error. Claims are extracted by a model and kept only when their quote appears verbatim in the text; each cited source is then checked, with a model’s help, for whether it says what the claim relies on. Those verdicts can be wrong — read the claim’s quote and the cited source before relying on one.
Statistics and arithmetic are recomputed, not judged.
Confidence bands are shown only for fields calibrated on our annotated test set. None is calibrated yet, so no band is shown.
What counts as a claim ›How we measure confidence ›How we check this ›
Are you an author, or do you see a problem with this page? Request a review
