

The DOI matches its Crossref record; 94 of the 94 references it cites were found in a registry or an index.
Molecular and evolutionary basis of O-antigenic polysaccharide-driven phage sensitivity in environmental pseudomonads
Open accessPublished version of a preprint
Abstract
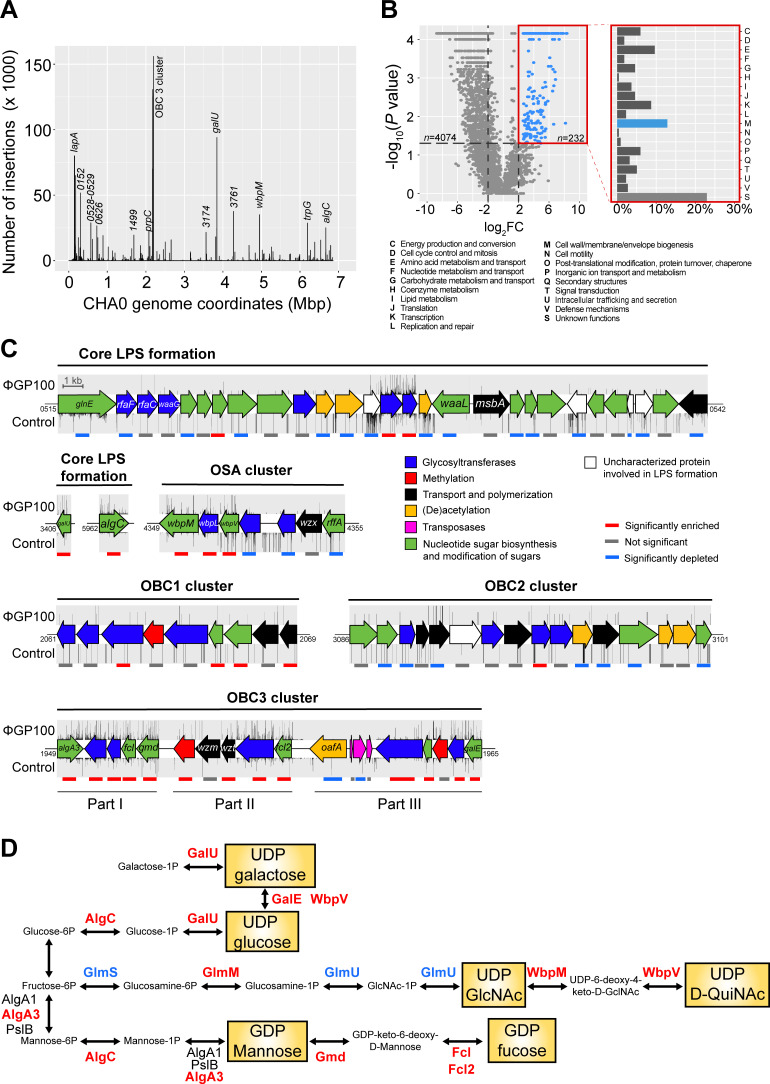
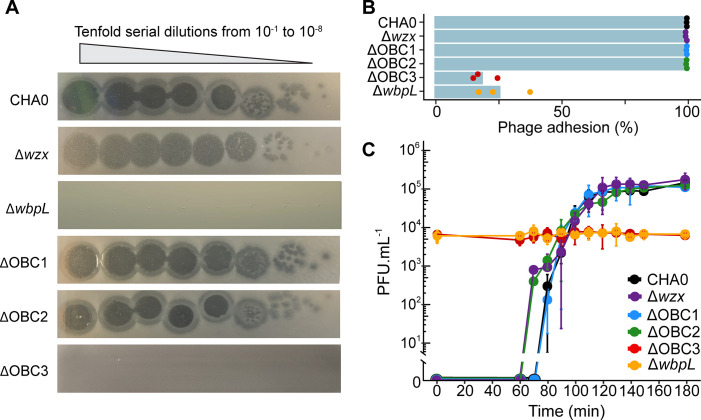
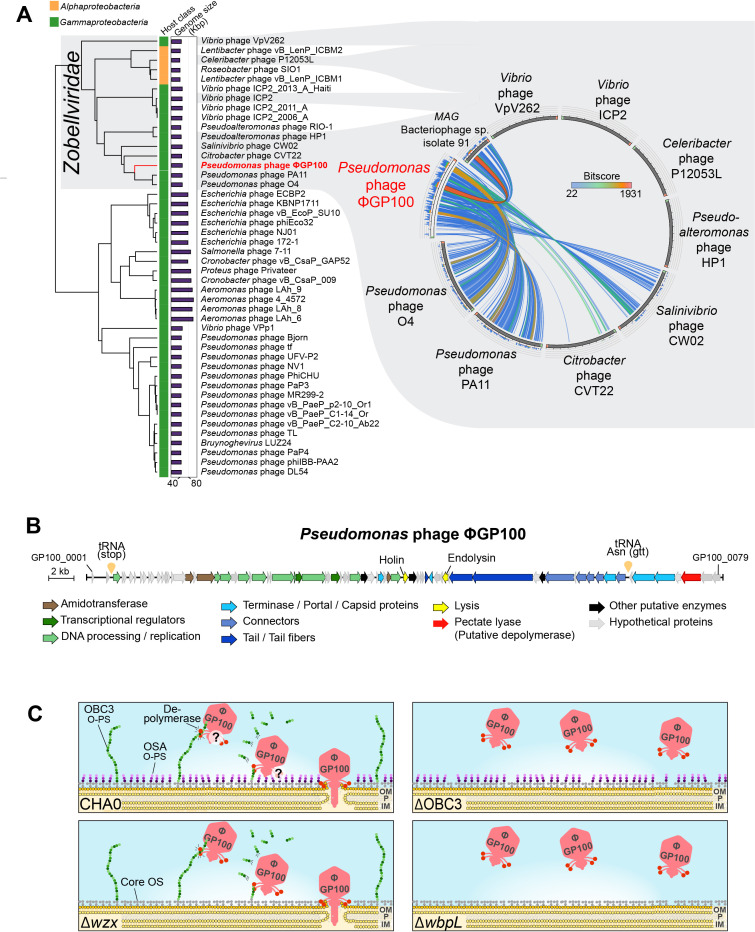
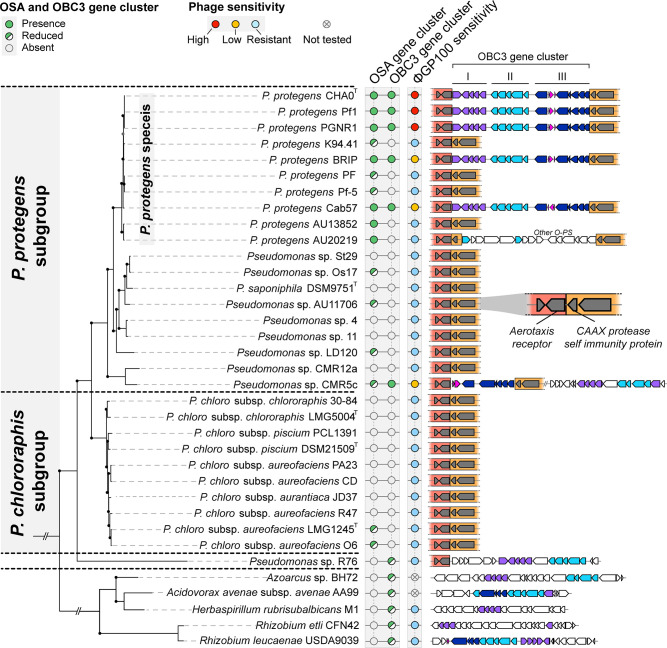
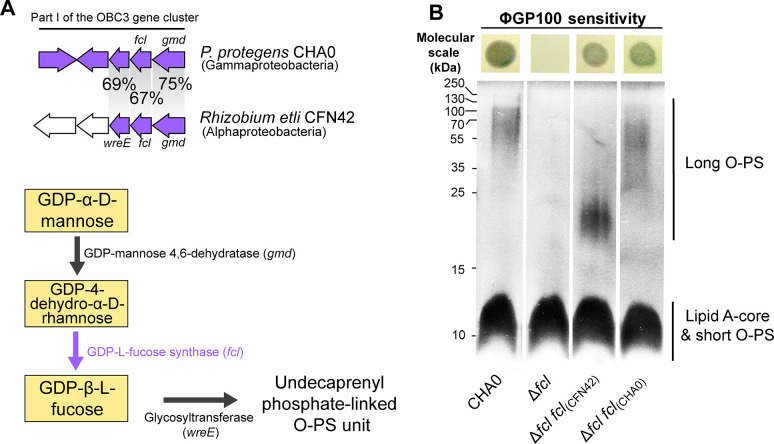
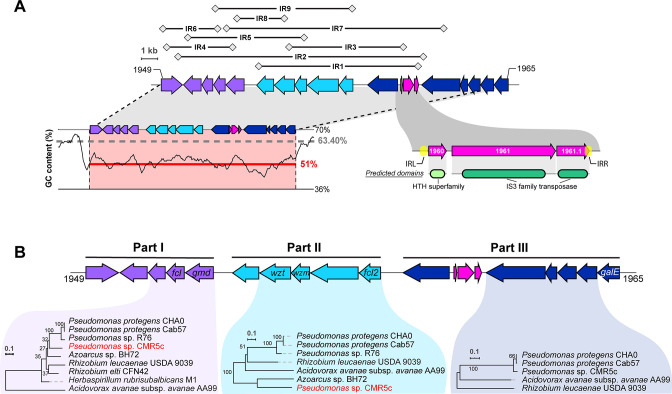
Pseudomonas protegens CHA0, a bacterial strain able to suppress plant pathogens as well as efficiently kill lepidopteran pest insects, has been studied as a biocontrol agent to prevent ensuing agricultural damage. However, the success of this method is dependent on efficient plant colonization by the bacterial inoculant, while it faces competition from the resident microbiota as well as predators such as bacteriophages. One of these naturally occurring phages, ΦGP100, was found to drastically reduce the abundance of CHA0 once inoculated into plant microcosms, resulting in the loss of plant protection effect against a phytopathogen. Here, we investigated the molecular determinants implicated in the interaction between CHA0 and the phage ΦGP100 using a high-density transposon-sequencing approach. We show that lipopolysaccharide cell surface decorations, specifically the longer OBC3-type O-antigenic polysaccharide (O-PS, O-antigen) of the two dominant O-PS of CHA0, are essential for the attachment and infection of ΦGP100. Moreover, when exploring the distribution of the OBC3 cluster in bacterial genomes, we identified several parts of this gene cluster that are conserved in phylogenetically distant bacteria. Through heterologous complementation, we integrated an OBC3-type gene copy from a phylogenetically distant bacterium and were able to restore the phage sensitivity of a CHA0 mutant which lacked the ability to form long O-PS. Finally, we evidence that the OBC3 gene cluster of CHA0 displays a high genomic plasticity and likely underwent several horizontal acquisitions and genomic rearrangements. Collectively, this study underlines the complexity of phage-bacteria interactions and the multifunctional aspect of bacterial cell surface decorations. IMPORTANCE: The application of plant-beneficial microorganisms to protect crop plants is a promising alternative to the usage of chemicals. However, biocontrol research often faces difficulties in implementing this approach due to the inconsistency of the bacterial inoculant to establish itself within the root microbiome. Beneficial bacterial inoculants can be decimated by the presence of their natural predators, notably bacteriophages (also called phages). Thus, it is important to gain knowledge regarding the mechanisms behind phage-bacteria interactions to overcome this challenge. Here, we evidence that the major long O-antigenic polysaccharide (O-PS, O-antigen) of the widely used model plant-beneficial bacterium Pseudomonas protegens CHA0 is the receptor of its natural predator, the phage ΦGP100. We examined the distribution of the gene cluster directing the synthesis of this O-PS and identified signatures of horizontal gene acquisitions. Altogether, our study highlights the importance of bacterial cell surface structure variation in the complex interplay between phages and their Pseudomonas hosts.
Overview
The claims and statistics of this paper haven’t been checked yet.
Run the check — free, no account needed. It reads the open-access text and checks the sources it cites.
Integrity signals
Registry
Cites
Statistics
Figures
Verification
Claims the paper makes
The claims and statistics of this paper haven’t been checked yet.
Run the check — free, no account needed. It reads the open-access text and checks the sources it cites.
Self-check
Percentages, sums and reported differences re-computed from the paper’s own numbers.
The self-check needs the paper’s full text.
Citations
Cites
Fast and accurate short read alignment with Burrows-Wheeler transform
Li, H., & Durbin, R. (2009) · Bioinformatics · doi:10.1093/bioinformatics/btp324 · Cited by 58,607
Highly accurate protein structure prediction with AlphaFold
Jumper, J., Evans, R., Pritzel, A., Green, T., Figurnov, M., Ronneberger, O., Tunyasuvunakool, K., Bates, R., Žídek, A., Potapenko, A., et al. (2021) · Nature · doi:10.1038/s41586-021-03819-2 · Cited by 43,764
Cutadapt removes adapter sequences from high-throughput sequencing reads
Martin, M. (2011) · EMBnet.journal · doi:10.14806/ej.17.1.200 · Cited by 33,889
Prokka: rapid prokaryotic genome annotation
Seemann, T. (2014) · Bioinformatics · doi:10.1093/bioinformatics/btu153 · Cited by 18,818
Fast and sensitive protein alignment using DIAMOND
Buchfink, B., Xie, C., & Huson, D. H. (2015) · Nature Methods · doi:10.1038/nmeth.3176 · Cited by 14,201
Selection of Conserved Blocks from Multiple Alignments for Their Use in Phylogenetic Analysis
Castresana, J. (2000) · Molecular Biology and Evolution · doi:10.1093/oxfordjournals.molbev.a026334 · Cited by 10,508
OrthoFinder: phylogenetic orthology inference for comparative genomics
Emms, D. M., & Kelly, S. (2019) · Genome Biology · doi:10.1186/s13059-019-1832-y · Cited by 7,676
A Rapid Bootstrap Algorithm for the RAxML Web Servers
Stamatakis, A., Hoover, P., & Rougemont, J. (2008) · Systematic Biology · doi:10.1080/10635150802429642 · Cited by 7,028
Huerta-Cepas, J., Szklarczyk, D., Heller, D., Hernández-Plaza, A., Forslund, S. K., Cook, H., Mende, D. R., Letunic, I., Rattei, T., Jensen, L. J., et al. (2019) · Nucleic Acids Research · doi:10.1093/nar/gky1085 · Cited by 4,902
RAxML-NG: a fast, scalable and user-friendly tool for maximum likelihood phylogenetic inference
Kozlov, A. M., Darriba, D., Flouri, T., Morel, B., & Stamatakis, A. (2019) · Bioinformatics · doi:10.1093/bioinformatics/btz305 · Cited by 4,454
RAxML-NG: a fast, scalable and user-friendly tool for maximum likelihood phylogenetic inferencePreprint
Kozlov, A., Darriba, D., Flouri, T., Morel, B., & Stamatakis, A. (2018) · bioRxiv · doi:10.1101/447110 · Cited by 3,947
PHASTER: a better, faster version of the PHAST phage search tool
Arndt, D., Grant, J. R., Marcu, A., Sajed, T., Pon, A., Liang, Y., & Wishart, D. S. (2016) · Nucleic Acids Research · doi:10.1093/nar/gkw387 · Cited by 3,571
An Improved General Amino Acid Replacement Matrix
Le, S. Q., & Gascuel, O. (2008) · Molecular Biology and Evolution · doi:10.1093/molbev/msn067 · Cited by 3,127
CDD/SPARCLE: the conserved domain database in 2020
Lu, S., Wang, J., Chitsaz, F., Derbyshire, M. K., Geer, R. C., Gonzales, N. R., Gwadz, M., Hurwitz, D. I., Marchler, G. H., Song, J. S., et al. (2019) · Nucleic Acids Research · doi:10.1093/nar/gkz991 · Cited by 3,062
ISfinder: the reference centre for bacterial insertion sequences
Siguier, P. (2006) · Nucleic Acids Research · doi:10.1093/nar/gkj014 · Cited by 2,767
Biological control of soil-borne pathogens by fluorescent pseudomonads
Haas, D., & Défago, G. (2005) · Nature Reviews Microbiology · doi:10.1038/nrmicro1129 · Cited by 2,611
IslandViewer 4: expanded prediction of genomic islands for larger-scale datasets
Bertelli, C., Laird, M. R., Williams, K. P., Simon Fraser University Research Computing Group, Lau, B. Y., Hoad, G., Winsor, G. L., & Brinkman, F. S. (2017) · Nucleic Acids Research · doi:10.1093/nar/gkx343 · Cited by 1,543
Clustal Omega, Accurate Alignment of Very Large Numbers of Sequences
Sievers, F., & Higgins, D. G. (2014) · Methods in Molecular Biology · doi:10.1007/978-1-62703-646-7_6 · Cited by 1,247
Carver, T. J., Harris, S. R., Berriman, M., Parkhill, J., & Keane, J. A. (2011) · Bioinformatics · doi:10.1093/bioinformatics/btr703 · Cited by 1,228
van Die, I. (2017) · Pure Amsterdam UMC · Cited by 1,111
Phage diversity, genomics and phylogeny
Dion, M. B., Oechslin, F., & Moineau, S. (2020) · Nature Reviews Microbiology · doi:10.1038/s41579-019-0311-5 · Cited by 960
How Many Bootstrap Replicates Are Necessary?
Pattengale, N. D., Alipour, M., Bininda-Emonds, O. R. P., Moret, B. M. E., & Stamatakis, A. (2010) · Journal of Computational Biology · doi:10.1089/cmb.2009.0179 · Cited by 958
ViPTree: the viral proteomic tree server
Nishimura, Y., Yoshida, T., Kuronishi, M., Uehara, H., Ogata, H., & Goto, S. (2017) · Bioinformatics · doi:10.1093/bioinformatics/btx157 · Cited by 946
Dali server: structural unification of protein families
Holm, L. (2022) · Nucleic Acids Research · doi:10.1093/nar/gkac387 · Cited by 935
Interactions between bacterial and phage communities in natural environments
Chevallereau, A., Pons, B. J., van Houte, S., & Westra, E. R. (2022) · Nature Reviews Microbiology · doi:10.1038/s41579-021-00602-y · Cited by 728
The pan-immune system of bacteria: antiviral defence as a community resource
Bernheim, A., & Sorek, R. (2020) · Nature Reviews Microbiology · doi:10.1038/s41579-019-0278-2 · Cited by 675
O-antigen structural variation: mechanisms and possible roles in animal/plant–microbe interactions
Lerouge, I., & Vanderleyden, J. (2002) · FEMS Microbiology Reviews · doi:10.1111/j.1574-6976.2002.tb00597.x · Cited by 526
Pushing the envelope: LPS modifications and their consequences
Simpson, B. W., & Trent, M. S. (2019) · Nature Reviews Microbiology · doi:10.1038/s41579-019-0201-x · Cited by 521
Bacteriophage-encoded depolymerases: their diversity and biotechnological applications
Pires, D. P., Oliveira, H., Melo, L. D. R., Sillankorva, S., & Azeredo, J. (2016) · Applied Microbiology and Biotechnology · doi:10.1007/s00253-015-7247-0 · Cited by 517
Kraken: A set of tools for quality control and analysis of high-throughput sequence data
Davis, M. P. A., van Dongen, S., Abreu‐Goodger, C., Bartoniček, N., & Enright, A. J. (2013) · Methods · doi:10.1016/j.ymeth.2013.06.027 · Cited by 418
Score-based prediction of genomic islands in prokaryotic genomes using hidden Markov models
Waack, S., Keller, O., Asper, R., Brodag, T., Damm, C., Fricke, W. F., Surovcik, K., Meinicke, P., & Merkl, R. (2006) · BMC Bioinformatics · doi:10.1186/1471-2105-7-142 · Cited by 404
Lipopolysaccharide transport and assembly at the outer membrane: the PEZ model
Okuda, S., Sherman, D. J., Silhavy, T. J., Ruiz, N., & Kahne, D. E. (2016) · Nature Reviews Microbiology · doi:10.1038/nrmicro.2016.25 · Cited by 382
Martínez‐García, E., & de Lorenzo, V. (2011) · Environmental Microbiology · doi:10.1111/j.1462-2920.2011.02538.x · Cited by 365
Microbiota-mediated disease resistance in plants
Vannier, N., Agler, M. T., & Hacquard, S. (2019) · PLoS Pathogens · doi:10.1371/journal.ppat.1007740 · Cited by 365
Diversity and Function of Phage Encoded Depolymerases
Knecht, L. E., Veljkovic, M., & Fieseler, L. (2020) · Frontiers in Microbiology · doi:10.3389/fmicb.2019.02949 · Cited by 359
Circoletto: visualizing sequence similarity with Circos
Darzentas, N. (2010) · Bioinformatics · doi:10.1093/bioinformatics/btq484 · Cited by 347
Detecting Sequence Homology at the Gene Cluster Level with MultiGeneBlast
Medema, M. H., Takano, E., & Breitling, R. (2013) · Molecular Biology and Evolution · doi:10.1093/molbev/mst025 · Cited by 347
Nematode grazing promotes bacterial community dynamics in soil at the aggregate level
Jiang, Y., Liu, M., Zhang, J., Chen, Y., Chen, X., Chen, L., Li, H., Zhang, X.-X., & Sun, B. (2017) · The ISME Journal · doi:10.1038/ismej.2017.120 · Cited by 336
Review: Lipopolysaccharide biosynthesis in Pseudomonas aeruginosa
King, J. D., Kocíncová, D., Westman, E. L., & Lam, J. S. (2009) · Innate Immunity · doi:10.1177/1753425909106436 · Cited by 312
Larsen, R., Wilson, M., Guss, A. M., & Metcalf, W. W. (2002) · Archives of Microbiology · doi:10.1007/s00203-002-0442-2 · Cited by 307
Phage combination therapies for bacterial wilt disease in tomato
Wang, X., Wei, Z., Yang, K., Wang, J., Jousset, A., Xu, Y., Shen, Q., & Friman, V. (2019) · Nature Biotechnology · doi:10.1038/s41587-019-0328-3 · Cited by 301
Genetic and Functional Diversity of Pseudomonas aeruginosa Lipopolysaccharide
Lam, J. S., Taylor, V. L., Islam, S. T., Hao, Y., & Kocíncová, D. (2011) · Frontiers in Microbiology · doi:10.3389/fmicb.2011.00118 · Cited by 299
Gilchrist, C. L. M., Booth, T., van Wersch, B., van Grieken, L., Medema, M. H., & Chooi, Y. (2021) · Bioinformatics Advances · doi:10.1093/bioadv/vbab016 · Cited by 292
Voineagu, I., Narayanan, V., Lobachev, K. S., & Mirkin, S. M. (2008) · Proceedings of the National Academy of Sciences · doi:10.1073/pnas.0804510105 · Cited by 269 · cited 1×
“The presence of IRs has been proposed to reflect genomic instability (56).”
BackgroundTRANSIT - A Software Tool for Himar1 TnSeq Analysis
DeJesus, M. A., Ambadipudi, C., Baker, R., Sassetti, C. M., & Ioerger, T. R. (2015) · PLoS Computational Biology · doi:10.1371/journal.pcbi.1004401 · Cited by 265
Reconciling the many faces of lateral gene transfer
Lawrence, J. G., & Ochman, H. (2002) · Trends in Microbiology · doi:10.1016/s0966-842x(01)02282-x · Cited by 221
The ‘Neglected’ Soil Virome – Potential Role and Impact
Pratama, A. A., & van Elsas, J. D. (2018) · Trends in Microbiology · doi:10.1016/j.tim.2017.12.004 · Cited by 215
Moffatt, J. H., Harper, M., Adler, B., Nation, R. L., Li, J., & Boyce, J. D. (2011) · Antimicrobial Agents and Chemotherapy · doi:10.1128/aac.01732-10 · Cited by 205
Horizontal gene transfer in the phytosphere
van Elsas, J. D., Turner, S. L., & Bailey, M. (2003) · New Phytologist · doi:10.1046/j.1469-8137.2003.00697.x · Cited by 203
Pathogenicity Islands and Other Virulence Elements in Listeria
Kreft, J., Vazquez-Boland, J.-A., Altrock, S., Dominguez-Bernal, G., & Goebel, W. (2002) · Current topics in microbiology and immunology · doi:10.1007/978-3-642-56031-6_7 · Cited by 193
Promise for plant pest control: root-associated pseudomonads with insecticidal activities
Kupferschmied, P., Maurhofer, M., & Keel, C. (2013) · Frontiers in Plant Science · doi:10.3389/fpls.2013.00287 · Cited by 190
Self-citationPhage–host interplay: examples from tailed phages and Gram-negative bacterial pathogens
Chaturongakul, S., & Ounjai, P. (2014) · Frontiers in Microbiology · doi:10.3389/fmicb.2014.00442 · Cited by 165
Jousset, A., Rochat, L., Péchy‐Tarr, M., Keel, C., Scheu, S., & Bonkowski, M. (2009) · The ISME Journal · doi:10.1038/ismej.2009.26 · Cited by 164
Self-citationCoyne, M. J., Russell, K., Coyle, C. L., & Goldberg, J. B. (1994) · Journal of Bacteriology · doi:10.1128/jb.176.12.3500-3507.1994 · Cited by 162
Flury, P., Aellen, N., Ruffner, B., Péchy‐Tarr, M., Fataar, S., Metla, Z., Domínguez‐Ferreras, A., Bloemberg, G. V., Frey, J., Goesmann, A., et al. (2016) · The ISME Journal · doi:10.1038/ismej.2016.5 · Cited by 162
Self-citationPéchy‐Tarr, M., Bruck, D. J., Maurhofer, M., Fischer, E., Vogne, C., Henkels, M. D., Donahue, K. M., Grunder, J., Loper, J. E., & Keel, C. (2008) · Environmental Microbiology · doi:10.1111/j.1462-2920.2008.01662.x · Cited by 160
Self-citationThe future of phage biocontrol in integrated plant protection for sustainable crop production
Holtappels, D., Fortuna, K. J., Lavigne, R., & Wagemans, J. (2020) · Current Opinion in Biotechnology · doi:10.1016/j.copbio.2020.08.016 · Cited by 160
Burrows, L. L., Charter, D. F., & Lam, J. S. (1996) · Molecular Microbiology · doi:10.1046/j.1365-2958.1996.1351503.x · Cited by 139
Ramette, A., Moënne‐Loccoz, Y., & Défago, G. (2003) · FEMS Microbiology Ecology · doi:10.1111/j.1574-6941.2003.tb01088.x · Cited by 135
Lu, H., Patil, P. B., Sluys, M. V., White, F. F., Ryan, R. P., Dow, J. M., Rabinowicz, P. D., Salzberg, S. L., Leach, J. E., Sonti, R. V., et al. (2008) · PLoS ONE · doi:10.1371/journal.pone.0003828 · Cited by 123
Vacheron, J., Péchy‐Tarr, M., Brochet, S., Heiman, C. M., Stojiljkovic, M., Maurhofer, M., & Keel, C. (2019) · The ISME Journal · doi:10.1038/s41396-019-0353-8 · Cited by 106
Self-citationDNA rearrangement mediated by inverted repeats.
Bi, X., & Liu, L. F. (1996) · Proceedings of the National Academy of Sciences · doi:10.1073/pnas.93.2.819 · Cited by 105
The Variation of O Antigens in Gram-Negative Bacteria
Wang, L., Wang, Q., & Reeves, P. R. (2010) · Sub-cellular biochemistry/Subcellular biochemistry · doi:10.1007/978-90-481-9078-2_6 · Cited by 100
Endotoxins: Structure, Function and Recognition
Wang, X., & Quinn, P. J. (2010) · Sub-cellular biochemistry/Subcellular biochemistry · doi:10.1007/978-90-481-9078-2 · Cited by 97
Oliveira, H., Costa, A. R., Konstantinides, N., Ferreira, A., Akturk, E., Sillankorva, S., Nemec, A., Shneider, M. M., Dötsch, A., & Azeredo, J. (2017) · Environmental Microbiology · doi:10.1111/1462-2920.13970 · Cited by 91
The Role of Rhizosphere Bacteriophages in Plant Health
Pratama, A. A., Terpstra, J., de Oliveria, A. L. M., & Salles, J. F. (2020) · Trends in Microbiology · doi:10.1016/j.tim.2020.04.005 · Cited by 89
Broeker, N. K., & Barbirz, S. (2017) · Molecular Microbiology · doi:10.1111/mmi.13729 · Cited by 85
Dean, C. R., & Goldberg, J. B. (2002) · FEMS Microbiology Letters · doi:10.1016/s0378-1097(02)00641-9 · Cited by 81
Multifaceted Impacts of Bacteriophages in the Plant Microbiome
Koskella, B., & Taylor, T. (2018) · Annual Review of Phytopathology · doi:10.1146/annurev-phyto-080417-045858 · Cited by 73
Keel, C., Ucurum, Z., Michaux, P., Adrian, M., & Haas, D. (2002) · Molecular Plant-Microbe Interactions · doi:10.1094/mpmi.2002.15.6.567 · Cited by 65
Self-citationPatil, P. B., & Sonti, R. V. (2004) · BMC Microbiology · doi:10.1186/1471-2180-4-40 · Cited by 62
Vacheron, J., Heiman, C. M., & Keel, C. (2021) · Communications Biology · doi:10.1038/s42003-020-01581-1 · Cited by 62
Self-citationBoutoille, D., Corvec, S., Caroff, N., Giraudeau, C., Espaze, E., Caillon, J., Plésiat, P., & Reynaud, A. (2003) · FEMS Microbiology Letters · doi:10.1016/s0378-1097(03)00882-6 · Cited by 60
Smith, T. J., Font, M. E., Kelly, C. M., Sondermann, H., & O’Toole, G. A. (2018) · Journal of Bacteriology · doi:10.1128/jb.00734-17 · Cited by 52
Chen, Y., Bystrický, P., Adeyeye, J., Panigrahi, P., Ali, A., Johnson, J. A., Bush, C. A., Morris, J. G., & Stine, O. (2007) · BMC Microbiology · doi:10.1186/1471-2180-7-20 · Cited by 49
Kupferschmied, P., Péchy‐Tarr, M., Imperiali, N., Maurhofer, M., & Keel, C. (2014) · PLoS Pathogens · doi:10.1371/journal.ppat.1003964 · Cited by 48
Self-citationBeyond antibacterials – exploring bacteriophages as antivirulence agents
Shen, Y., & Loessner, M. J. (2020) · Current Opinion in Biotechnology · doi:10.1016/j.copbio.2020.11.004 · Cited by 43
Jaffuel, G., Imperiali, N., Shelby, K. S., Campos‐Herrera, R., Geisert, R. W., Maurhofer, M., Loper, J. E., Keel, C., Turlings, T. C. J., & Hibbard, B. E. (2019) · Scientific Reports · doi:10.1038/s41598-019-39753-7 · Cited by 42
Self-citationBruto, M., Prigent‐Combaret, C., Luis, P., Moënne‐Loccoz, Y., & Muller, D. A. E. (2014) · Proceedings of the Royal Society B Biological Sciences · doi:10.1098/rspb.2014.0848 · Cited by 41
The structure of the lipopolysaccharide from a galU mutant of Pseudomonas aeruginosa serogroup-O11
Choudhury, B., Carlson, R. W., & Goldberg, J. B. (2005) · Carbohydrate Research · doi:10.1016/j.carres.2005.09.017 · Cited by 41
Krupovìč, M., Turner, D., Витальевна, М. В., Dyall‐Smith, M., Oksanen, H. M., Edwards, R. A., Dutilh, B. E., Lehman, S. M., Reyes, A., Baquero, D. P., et al. (2021) · Archives of Virology · doi:10.1007/s00705-021-05205-9 · Cited by 41
Li, E., Zhang, H., Jiang, H., Pieterse, C. M. J., Jousset, A., Bakker, P. A. H. M., & de Jonge, R. (2021) · mBio · doi:10.1128/mbio.00927-21 · Cited by 37
Imperiali, N., Dennert, F., Schneider, J., Bougouin, E., Velatta, C., Fesselet, M., Wyler, M., Mascher, F., Mavrodi, O. V., Mavrodi, D. V., et al. (2017) · Frontiers in Plant Science · doi:10.3389/fpls.2017.00427 · Cited by 31
Self-citationHeiman, C. M., Maurhofer, M., Calderon, S., Dupasquier, M., Marquis, J., Keel, C., & Vacheron, J. (2022) · The ISME Journal · doi:10.1038/s41396-022-01217-8 · Cited by 30
Self-citationKupferschmied, P., Chai, T., Flury, P., Blom, J., Smits, T. H. M., Maurhofer, M., & Keel, C. (2016) · Environmental Microbiology · doi:10.1111/1462-2920.13571 · Cited by 29
Self-citationOng, S. P., Azam, A. H., Sasahara, T., Miyanaga, K., & Tanji, Y. (2020) · Journal of Bioscience and Bioengineering · doi:10.1016/j.jbiosc.2020.02.001 · Cited by 28
Garrido‐Sanz, D., Redondo‐Nieto, M., Martín, M., & Rivilla, R. (2021) · Microbial Genomics · doi:10.1099/mgen.0.000593 · Cited by 27
Self-citationFaoro, H., de Oliveira, W. K., Weiss, V. A., Tadra‐Sfeir, M. Z., Cardoso, R. L. A., Balsanelli, E., Brusamarello-Santos, L. C. C., Camilios‐Neto, D., Cruz, L. M., Raittz, R. T., et al. (2019) · BMC Genomics · doi:10.1186/s12864-019-5982-9 · Cited by 23
Kutschera, A., Schombel, U., Wröbel, M., Gisch, N., & Ranf, S. (2019) · Molecular Plant Pathology · doi:10.1111/mpp.12864 · Cited by 22
Kaleta, P., O’Callaghan, J., Fitzgerald, G. F., Beresford, T. P., & Ross, R. P. (2009) · Applied and Environmental Microbiology · doi:10.1128/aem.01845-09 · Cited by 21
Roles of Predicted Glycosyltransferases in the Biosynthesis of the Rhizobium etli CE3 O Antigen
Ojeda, K. J., Simonds, L., & Noel, K. D. (2013) · Journal of Bacteriology · doi:10.1128/jb.02080-12 · Cited by 14
Phage-host interplay: examples from tailed phages and Gram-negative bacterial pathogens
eChaturongakul, S., & eOunjai, P. (2014) · Frontiers in Microbiology · Cited by 13
Genome instability in bacteria: Causes and consequences
Golubov, A. (2021) · Elsevier eBooks · doi:10.1016/b978-0-323-85679-9.00005-2 · Cited by 8
Genome Sequence of the Pseudomonas protegens Phage ΦGP100
Vacheron, J., Kupferschmied, P., Resch, G., & Keel, C. (2018) · Genome Announcements · doi:10.1128/genomea.00261-18 · Cited by 2
Self-citation
Research works printed but not linked: 2
- 10.1111/j.1574-6968.2002.tb11193.x · DOI
- Reeves PP , Wang L . 2002. Genomic organization of LPS-specific loci. Curr Top Microbiol Immunol 264:109–135.
Metadata
- Authors
- Vacheron, J., Heiman, C. M., Garneau, J. R., Kupferschmied, P., de Jonge, R., Garrido-Sanz, D., & Keel, C.
- Affiliations
- University of Lausanne (CH)
- Utrecht University (NL)
- Department of Fundamental Microbiology, University of Lausanne , Lausanne, Switzerland
- Corresponding author
- Vacheron, Jordan
- Keel, Christoph
- ORCID
- Venue
- Microbiology Spectrum
- Publisher
- American Society for Microbiology
- Published
- 2023-12-12
- Volume
- 11
- Issue
- 6
- Pages
- e0204923-e0204923
- ISSN
- 2165-0497 (ISSN-L)
- PMC
- PMC10715155
- OpenAlex
- W4387392058
- Cited by
- 4
- References
- 94
- Citations by year
- 2026: 2 · 2024: 2
- FWCI
- 0.65
- Type
- journal article
- Language
- en
- Open access
- gold
- doi.org
- Licence
- cc-by
- creativecommons.org/licenses/by/4.0/ (vor)
- journals.asm.org/non-commercial-tdm-license (tdm)
- Locations
- Microbiology Spectrum (publishedVersion, cc-by)
- bioRxiv (Cold Spring Harbor Laboratory) (acceptedVersion, cc-by-nc-nd)
- PubMed Central (publishedVersion, cc-by)
- PubMed (publishedVersion)
- SERVAL (Université de Lausanne) (submittedVersion, cc-by)
- DOAJ (DOAJ: Directory of Open Access Journals) (submittedVersion, cc-by-sa)
- Utrecht University Repository (Utrecht University) (submittedVersion, other-oa)
- IRIS (submittedVersion, cc-by)
- Funders
- National Centre of Competence in Research Microbiomes (51NF40_180575)
- Swiss National Science Foundation (310030_184666)
- Topics
- Life Sciences › Immunology and Microbiology › Virology › Bacteriophages and microbial interactions
- Life Sciences › Biochemistry, Genetics and Molecular Biology › Genetics › Bacterial Genetics and Biotechnology
- Life Sciences › Agricultural and Biological Sciences › Plant Science › Plant-Microbe Interactions and Immunity
- Keywords
- phage sensitivity, phage-bacteria interactions, biological control agents, plant colonization, genome plasticity, horizontal gene transfer, genome rearrangement, transposon sequencing
- MeSH terms
- Bacteria, Bacteriophages, Biological Evolution, O Antigens
About these checks
Registry, retraction, Cites and statistics results are computed, not judged, with one exception: a printed reference that no index lists is read once by a model before it counts as a citation error. Claims are extracted by a model and kept only when their quote appears verbatim in the text; each cited source is then checked, with a model’s help, for whether it says what the claim relies on. Those verdicts can be wrong — read the claim’s quote and the cited source before relying on one.
Statistics and arithmetic are recomputed, not judged.
Confidence bands are shown only for fields calibrated on our annotated test set. None is calibrated yet, so no band is shown.
What counts as a claim ›How we measure confidence ›How we check this ›
Are you an author, or do you see a problem with this page? Request a review
Data sources
Bibliographic data: Semantic Scholar, OpenAlex, Crossref.
Contains information from the Semantic Scholar Academic Graph Datasets, made available under the ODC Attribution License (ODC-BY 1.0).
Semantic Scholar’s data is described in: Kinney, R., et al. (2023). The Semantic Scholar Open Data Platform. arXiv:2301.10140.
