

Using electronic health record data to develop inpatient mortality predictive model: Acute Laboratory Risk of Mortality Score (ALaRMS)
Open accessThe DOI matches its Crossref record; 25 of the 25 references it cites were found in a registry or an index.
Abstract
OBJECTIVE: Using numeric laboratory data and administrative data from hospital electronic health record (EHR) systems, to develop an inpatient mortality predictive model. METHODS: Using EHR data of 1,428,824 adult discharges from 70 hospitals in 2006-2007, we developed the Acute Laboratory Risk of Mortality Score (ALaRMS) using age, gender, and initial laboratory values on admission as candidate variables. We then added administrative variables using the Agency for Healthcare Research and Quality (AHRQ)'s clinical classification software (CCS) and comorbidity software (CS) as disease classification tools. We validated the model using 770,523 discharges in 2008. RESULTS: Mortality predictors with ORs >2.00 included age, deranged albumin, arterial pH, bands, blood urea nitrogen, oxygen partial pressure, platelets, pro-brain natriuretic peptide, troponin I, and white blood cell counts. The ALaRMS model c-statistic was 0.87. Adding the CCS and CS variables increased the c-statistic to 0.91. The relative contributions were 69% (ALaRMS), 25% (CCS), and 6% (CS). Furthermore, the integrated discrimination improvement statistic demonstrated a 127% (95% CI 122% to 133%) overall improvement when ALaRMS was added to CCS and CS variables. In contrast, only a 22% (CI 19% to 25%) improvement was seen when CCS and CS variables were added to ALaRMS. CONCLUSIONS: EHR data can generate clinically plausible mortality predictive models with excellent discrimination. ALaRMS uses automated laboratory data widely available on admission, providing opportunities to aid real-time decision support. Models that incorporate laboratory and AHRQ's CCS and CS variables have utility for risk adjustment in retrospective outcome studies.
Overview
The claims and statistics of this paper haven’t been checked yet.
Free: it reads the open-access text and checks the first 5 claims that cite a source we can check. Create a free account to check every claim.
Integrity signals
Registry
Cites
Statistics
Figures
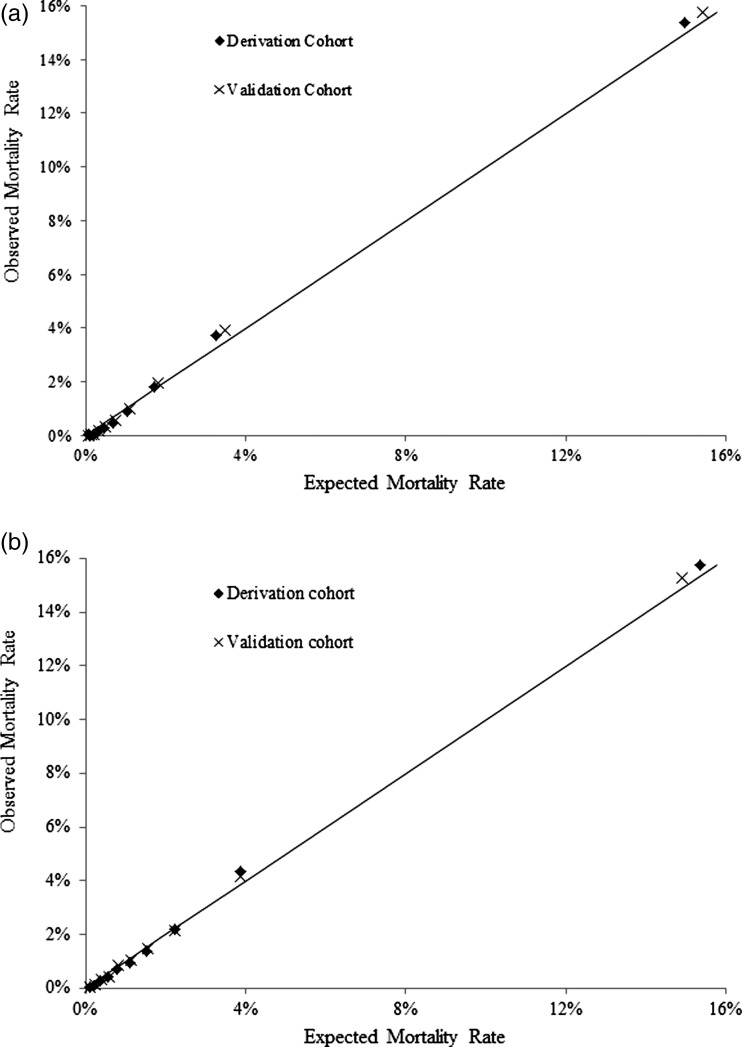
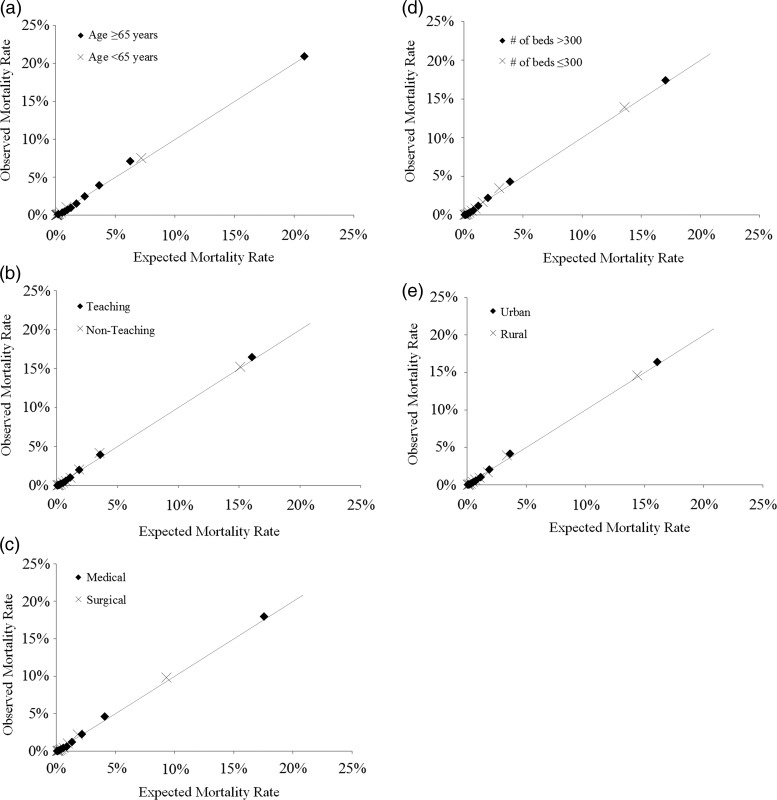
Verification
Claims the paper makes
The claims and statistics of this paper haven’t been checked yet.
Free: it reads the open-access text and checks the first 5 claims that cite a source we can check. Create a free account to check every claim.
Claims other papers make about this one
Each is checked against this paper’s own text: does it say what the citing paper says it does?
The cited source says what the claim attributes to it.
In the citing paper
“To the best of our knowledge, our models outperform existing EHR models in the medical literature for predicting mortality (0.92–0.94 vs 0.91),42 unexpected readmission (0.75–0.76 vs 0.69),43 and increased length of stay (0.85–0.86 vs 0.77).44”
From Scalable and accurate deep learning with electronic health records (2018) · cites this paper as [42]
Self-check
Percentages, sums and reported differences re-computed from the paper’s own numbers.
The self-check needs the paper’s full text.
Citations
Cites
Le Gall, J.-R. (1993) · JAMA: The Journal of the American Medical Association · doi:10.1001/jama.270.24.2957 · Cited by 7,773
Pencina, M. J., D' Agostino, R. B., D' Agostino, R. B., & Vasan, R. S. (2008) · Statistics in Medicine · doi:10.1002/sim.2929 · Cited by 6,493
A Prediction Rule to Identify Low-Risk Patients with Community-Acquired Pneumonia
Fine, M. J., Auble, T. E., Yealy, D. M., Hanusa, B. H., Weissfeld, L. A., Singer, D. E., Coley, C. M., Marrie, T. J., & Kapoor, W. N. (1997) · New England Journal of Medicine · doi:10.1056/nejm199701233360402 · Cited by 4,582
Zimmerman, J. E., Kramer, A. A., McNair, D. S., & Malila, F. M. (2006) · Critical Care Medicine · doi:10.1097/01.ccm.0000215112.84523.f0 · Cited by 1,764
Presentation of multivariate data for clinical use: The Framingham Study risk score functions
Sullivan, L. M., Massaro, J. M., & D'Agostino, R. B. (2004) · Statistics in Medicine · doi:10.1002/sim.1742 · Cited by 1,753
Epidemiology and Outcomes of Health-care–Associated Pneumonia
Kollef, M. H., Shorr, A., Tabak, Y. P., Gupta, V., Liu, L. Z., & Johannes, R. S. (2005) · Chest · doi:10.1378/chest.128.6.3854 · Cited by 948
Self-citationKrumholz, H. M., Wang, Y., Mattera, J. A., Wang, Y., Han, L. F., Ingber, M. J., Roman, S., & Normand, S.-L. T. (2006) · Circulation · doi:10.1161/circulationaha.105.611186 · Cited by 492
Krumholz, H. M., Wang, Y., Mattera, J. A., Wang, Y., Han, L. F., Ingber, M. J., Roman, S., & Normand, S.-L. T. (2006) · Circulation · doi:10.1161/circulationaha.105.611194 · Cited by 386
Escobar, G. J., Greene, J. D., Scheirer, P., Gardner, M. N., Draper, D., & Kipnis, P. (2008) · Medical Care · doi:10.1097/mlr.0b013e3181589bb6 · Cited by 316 · cited 1×
“…Acute Physiology Score (LAPS), and the COmorbidity Point Score (COPS), were developed for all patients admitted to acute-care hospitals, 3 and used outpatient laboratory data from the 24 h preceding the index hospitalization and diagnosis data from the 12 months preceding the index…”
Silber, J. H. (1995) · JAMA: The Journal of the American Medical Association · doi:10.1001/jama.1995.03530040045039 · Cited by 314
Cited by
Scalable and accurate deep learning with electronic health records
Rajkomar, A., Oren, E., Chen, K., Dai, A. M., Hajaj, N., Hardt, M., Liu, P. J., Liu, X., Marcus, J., Sun, M., et al. (2018) · npj Digital Medicine · doi:10.1038/s41746-018-0029-1 · Cited by 2,648
“Inpatient mortality We predicted impending inpatient death, defined as a discharge disposition of “expired” [52, 30, 54, 57].”
BackgroundGoldstein, B. A., Navar, A. M., Pencina, M. J., & Ioannidis, J. P. A. (2017) · Journal of the American Medical Informatics Association · doi:10.1093/jamia/ocw042 · Cited by 936
Bardhan, I., Chen, H., & Karahanna, E. (2020) · MIS Quarterly · doi:10.25300/misq/2020/14644 · Cited by 167
“For example, such hospital data have been adopted in health data analytics to predict adverse events (Lin et al. 2017), hospital readmissions (Bardhan et al. 2015), or patient mortality (Tabak et al. 2014), among others.”
Predictive modeling of U.S. health care spending in late life
Einav, L., Finkelstein, A., Mullainathan, S., & Obermeyer, Z. (2018) · Science · doi:10.1126/science.aar5045 · Cited by 163
Lin, Y.-K., Chen, H., Brown, R. A., Li, S.-H., & Yang, H.-J. (2017) · MIS Quarterly · doi:10.25300/misq/2017/41.2.07 · Cited by 158
“2014), and patient mortality (Tabak et al. 2014), are often of great practical importance.”
BackgroundMethod
Metadata
- Authors
- Tabak, Y. P., Sun, X., Nunez, C. M., & Johannes, R. S.
- Affiliations
- CareFusion Foundation (US)
- Brigham and Women's Hospital (US)
- Corresponding author
- Tabak, Ying P
- Venue
- Journal of the American Medical Informatics Association
- Publisher
- Oxford University Press (OUP)
- Published
- 2014-05
- Volume
- 21
- Issue
- 3
- Pages
- 455-463
- ISSN
- 1067-5027 (ISSN-L)
- 1527-974X
- PMC
- PMC3994855
- OpenAlex
- W2103742358
- Cited by
- 107
- References
- 25
- Citations by year
- 2025: 3 · 2024: 5 · 2023: 2 · 2022: 10 · 2021: 12 · 2020: 14 · 2019: 16 · 2018: 14 · 2017: 5 · 2016: 11 · 2015: 13 · 2014: 2
- FWCI
- 9.59
- Type
- journal article
- Language
- en
- Open access
- hybrid
- doi.org
- Licence
- cc-by-nc-nd
- Locations
- Journal of the American Medical Informatics Association (publishedVersion, cc-by-nc-nd)
- Europe PMC (PubMed Central) (publishedVersion, cc-by-nc)
- PubMed Central (publishedVersion, cc-by-nc)
- PubMed (publishedVersion)
- Digital Access to Scholarship at Harvard (DASH) (Harvard University) (submittedVersion, cc-by)
- Topics
- Physical Sciences › Computer Science › Artificial Intelligence › Machine Learning in Healthcare
- Health Sciences › Medicine › Critical Care and Intensive Care Medicine › Sepsis Diagnosis and Treatment
- Health Sciences › Health Professions › Health Information Management › Electronic Health Records Systems
- Keywords
- in-hospital mortality prediction, electronic health record data, laboratory parameters, Clinical Classification Software, risk adjustment, integrated discrimination improvement, real-time clinical decision support, hospital discharge data
- MeSH terms
- Adult, Age Factors, Aged, Female, Hematologic Tests, Hospitalization, Humans, Male, Middle Aged, Models, Theoretical, Prognosis, Software, Hospital Mortality, Risk Assessment, Electronic Health Records
About these checks
Registry, retraction, Cites and statistics results are computed, not judged, with one exception: a printed reference that no index lists is read once by a model before it counts as a citation error. Claims are extracted by a model and kept only when their quote appears verbatim in the text; each cited source is then checked, with a model’s help, for whether it says what the claim relies on. Those verdicts can be wrong — read the claim’s quote and the cited source before relying on one.
Statistics and arithmetic are recomputed, not judged.
Confidence bands are shown only for fields calibrated on our annotated test set. None is calibrated yet, so no band is shown.
What counts as a claim ›How we measure confidence ›How we check this ›
Are you an author, or do you see a problem with this page? Request a review
How to cite
Cite CoChat for the checks on this page, and the paper for its own findings.
- This page
- CoChat. (2026). Citation check: Using electronic health record data to develop inpatient mortality predictive model: Acute Laboratory Risk of Mortality Score (ALaRMS). https://app.cochat.ai/papers/10.1136/amiajnl-2013-001790
- The paper
- Tabak, Y. P., Sun, X., Nunez, C. M., & Johannes, R. S. (2014). Using electronic health record data to develop inpatient mortality predictive model: Acute Laboratory Risk of Mortality Score (ALaRMS). Journal of the American Medical Informatics Association. https://doi.org/10.1136/amiajnl-2013-001790
Data sources
Bibliographic data: Semantic Scholar, OpenAlex, Crossref.
Contains information from the Semantic Scholar Academic Graph Datasets, made available under the ODC Attribution License (ODC-BY 1.0).
Semantic Scholar’s data is described in: Kinney, R., et al. (2023). The Semantic Scholar Open Data Platform. arXiv:2301.10140.
