

The DOI matches its Crossref record; 1 of the 1 references it cites were found in a registry or an index.
Comparison of cardiovascular disease risk factors, assessment and management in men and women, including consideration of absolute risk: a nationally representative cross-sectional study
Open accessAbstract
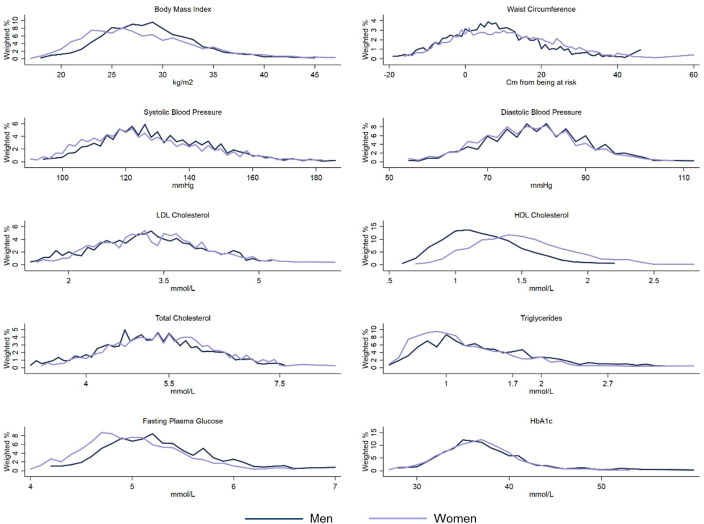
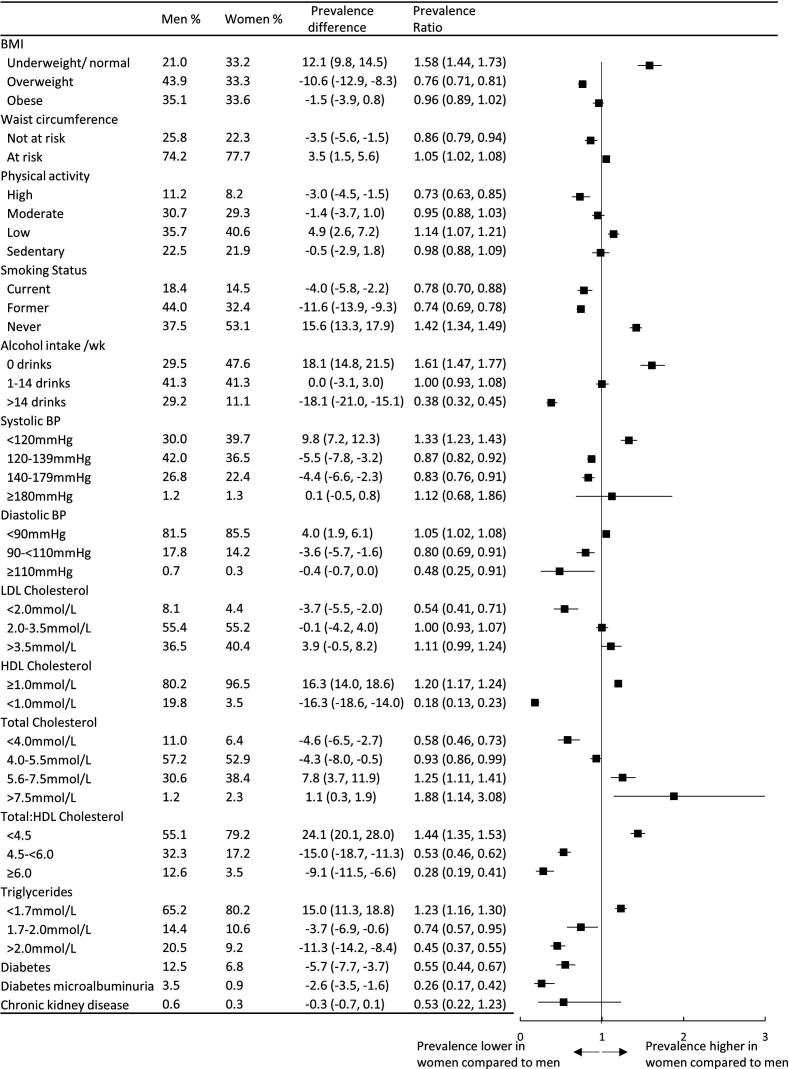
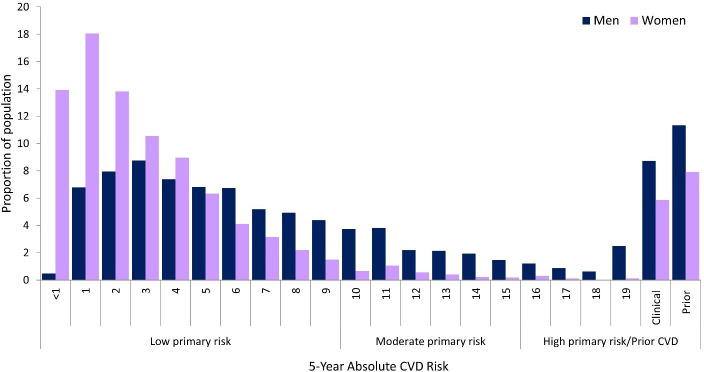
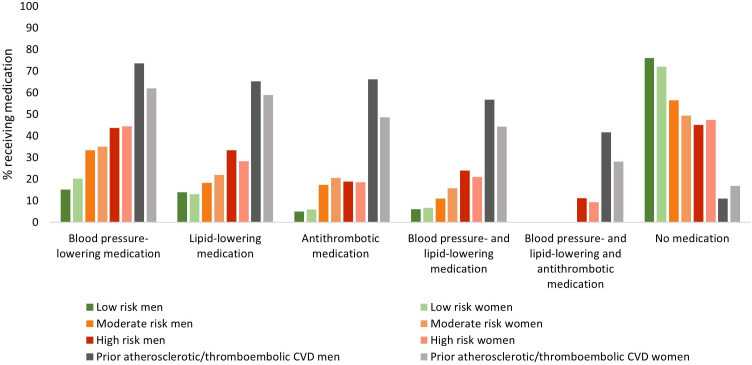
Objectives: Cardiovascular disease (CVD) is highly preventable and optimal treatments based on absolute risk can halve risk of future events. Compared with women, men have higher risks of developing CVD. However, women can experience suboptimal treatment. We aimed to quantify sex differences in CVD risk, assessment and treatment in Australian adults. Design, participants, setting: Cross-sectional analysis of nationally representative data from interview, physical measures, medication review and blood and urine samples, from 2011 to 2012 Australian Health Survey participants aged 45–74 (n=11 518). Outcome measures: CVD risk factors, absolute 5-year risk of a primary CVD event, blood pressure and cholesterol assessment in the previous 2 and 5 years and use of recommended CVD preventive medications were compared using Poisson regression to estimate age-adjusted male versus female prevalence ratios (PRs). Results: Women had a generally more favourable CVD risk factor profile than men, including lower: current smoking prevalence (women=14.5%; men=18.4%, PR=0.78, 95% CI=0.70 to 0.88); body mass index (women (mean)=28.3 kg/m 2 ; men (mean)=28.8 kg/m 2 , p<0.01); systolic and diastolic blood pressure (systolic: women (mean)=127.1 mm Hg; men (mean)=130.5 mm Hg, p<0.001); blood glucose (women (mean)=5.2 mmol/L; men (mean)=5.5 mmol/L); diabetes prevalence (women=6.8%; men=12.5%, PR=0.55, 95% CI=0.44 to 0.67); prior CVD (women=7.9%; men=11.3%) and absolute primary CVD risk (absolute 5-year CVD risk >15%: women=6.6%, 95% CI=5.4 to 7.8; men=15.4%, 95% CI=13.9% to 16.9%). Compared with men, women had higher low-density lipoprotein, high-density lipoprotein and total cholesterol and sedentary behaviour and lower physical activity. Blood pressure and cholesterol assessment were common in both sexes. Among those at high absolute risk, age-adjusted proportions receiving recommended CVD medications were low, without sex differences (women=21.3%; men=23.8%, PR=0.93, 95% CI=0.49 to 1.78). Fewer women than men with prior atherosclerotic CVD were receiving recommended treatment (women=21.8%, men=41.4%, PR=0.55, 95% CI=0.31 to 0.96). Conclusion: Women have a more favourable CVD risk factor profile than men. Preventive treatment is uncommon and women with prior atherosclerotic CVD are around half as likely as men to be receiving recommended treatment.
Overview
The claims and statistics of this paper haven’t been checked yet.
Run the check — free, no account needed. It reads the open-access text and checks the sources it cites.
Integrity signals
Registry
Cites
Statistics
Figures
Verification
Claims the paper makes
The claims and statistics of this paper haven’t been checked yet.
Run the check — free, no account needed. It reads the open-access text and checks the sources it cites.
Claims other papers make about this one
Each is checked against this paper’s own text: does it say what the citing paper says it does?
The cited source says what the claim attributes to it.
In the citing paper
“The lower predicted cardiovascular risk observed among female participants than males is consistent with existing literature31,32 and reflects the sex-specific structure of the Framingham risk equation and distribution of CV risk factors.”
From Tirzepatide compared with semaglutide and 10-year cardiovascular disease risk reduction in obesity: post-hoc analysis of the SURMOUNT-5 trial (2025) · cites this paper as [32]
Self-check
Percentages, sums and reported differences re-computed from the paper’s own numbers.
The self-check needs the paper’s full text.
Citations
Cites
Zhou, B., Bentham, J., Di Cesare, M., Bixby, H., Danaei, G., Cowan, M. J., Paciorek, C. J., Singh, G., Hajifathalian, K., Bennett, J. E., et al. (2017) · The Lancet · doi:10.1016/s0140-6736(16)31919-5 · Cited by 2,579
Research works printed but not linked: 15
- 10.1016/s0140-6736(18)32335-3 · DOI
- Foreman, 2018, Forecasting life expectancy, years of life lost, and all-cause and cause-specific mortality for 250 causes of death: reference and alternative scenarios for 2016–40 for 195 countries and territories, The Lancet, 392, 2052, 10.1016/S0140-6736(18)31694-5 · DOI
- 10.1016/S0140-6736(14)61212-5 · DOI · Paper page
- 2012, The effects of lowering LDL cholesterol with statin therapy in people at low risk of vascular disease: meta-analysis of individual data from 27 randomised trials, The Lancet, 380, 581, 10.1016/S0140-6736(12)60367-5 · DOI · Paper page
- Kuhn, 2014, Effect of patient sex on triage for ischaemic heart disease and treatment onset times: a retrospective analysis of Australian emergency department data, Int Emerg Nurs, 22, 88, 10.1016/j.ienj.2013.08.002 · DOI
- 10.1136/heartjnl-2016-310216 · DOI
- The Royal Australian College of General Practitioners . Guidelines for preventive activities in general practice. 2016. 9th edition. East Melbourne, Victoria: RACGP, 2016.
- Farzadfar, 2011, National, regional, and global trends in serum total cholesterol since 1980: systematic analysis of health examination surveys and epidemiological studies with 321 country-years and 3·0 million participants, The Lancet, 377, 578, 10.1016/S0140-6736(10)62038-7 · DOI · Paper page
- Giovino, 2012, Tobacco use in 3 billion individuals from 16 countries: an analysis of nationally representative cross-sectional household surveys, The Lancet, 380, 668, 10.1016/S0140-6736(12)61085-X · DOI · Paper page
- 10.1016/j.jacc.2007.08.017 · DOI
- 10.1038/ajh.2007.36 · DOI
- Woodward, 2019, Cardiovascular disease and the female disadvantage, Int J Environ Res Public Health, 16, 10.3390/ijerph16071165 · DOI
- Lee, 2019, Sex disparities in the management of coronary heart disease in general practices in Australia, Heart, 105, 10.1136/heartjnl-2019-315134 · DOI
- 10.1177/1741826710389369 · DOI
- 10.1089/jwh.2012.3972 · DOI
Cited by
Sorted by citations
Liu, J., Bu, X., Wei, L., Wang, X., Lai, L., Dong, C., Ma, A., & Wang, T. (2021) · Journal of Hypertension · doi:10.1097/hjh.0000000000002958 · Cited by 100
Mamas, M. A., Bays, H., Li, R., Upadhyay, N., Irani, T., Senyucel, C., Dunn, J. P., & Liu-Seifert, H. (2025) · European Heart Journal Open · doi:10.1093/ehjopen/oeaf117 · Cited by 24
Metadata
- Authors
- Banks, E., Welsh, J., Joshy, G., Martin, M., Paige, E., & Korda, R. J.
- Affiliations
- Australian National University (AU)
- Corresponding author
- Banks, Emily
- Venue
- BMJ Open
- Publisher
- BMJ
- Published
- 2020-12
- Volume
- 10
- Issue
- 12
- Pages
- e038761
- ISSN
- 2044-6055 (ISSN-L)
- PMC
- PMC7757475
- OpenAlex
- W3117541213
- Cited by
- 39
- References
- 1
- Citations by year
- 2026: 7 · 2025: 3 · 2024: 9 · 2023: 7 · 2022: 8 · 2021: 5
- FWCI
- 3.75
- Type
- journal article
- Language
- en
- Open access
- gold
- doi.org
- Licence
- Locations
- BMJ Open (publishedVersion, cc-by-nc)
- PubMed Central (publishedVersion, cc-by-nc)
- PubMed (publishedVersion)
- DOAJ (DOAJ: Directory of Open Access Journals) (submittedVersion)
- HighWire Press Open Archive (submittedVersion)
- ANU Open Research (Australian National University) (submittedVersion, cc-by-nc)
- Funders
- NSW CVRN Women and Heart Disease grant from the National Heart Foundation of Australia (101692)
- National Health and Medical Research Council (1042717)
- Topics
- Health Sciences › Medicine › Public Health, Environmental and Occupational Health › Health Promotion and Cardiovascular Prevention
- Health Sciences › Medicine › Public Health, Environmental and Occupational Health › Sex and Gender in Healthcare
- Health Sciences › Medicine › Cardiology and Cardiovascular Medicine › Cardiovascular Health and Risk Factors
- Keywords
- cardiovascular risk factors, sex differences, absolute cardiovascular risk, cardiovascular risk assessment, blood pressure screening, cholesterol screening, diabetes prevalence, physical activity, sedentary behavior, atherosclerotic cardiovascular disease, women's cardiovascular health, Australian adults, middle-aged and older adults, treatment gap
- MeSH terms
- Adult, Aged, Australia, Cardiovascular Diseases, Cross-Sectional Studies, Diabetes Mellitus, Female, Humans, Male, Middle Aged, Risk Factors
About these checks
Registry, retraction, Cites and statistics results are computed, not judged, with one exception: a printed reference that no index lists is read once by a model before it counts as a citation error. Claims are extracted by a model and kept only when their quote appears verbatim in the text; each cited source is then checked, with a model’s help, for whether it says what the claim relies on. Those verdicts can be wrong — read the claim’s quote and the cited source before relying on one.
Statistics and arithmetic are recomputed, not judged.
Confidence bands are shown only for fields calibrated on our annotated test set. None is calibrated yet, so no band is shown.
What counts as a claim ›How we measure confidence ›How we check this ›
Are you an author, or do you see a problem with this page? Request a review
