

The DOI matches its Crossref record; 23 of the 24 references it cites were found in a registry or an index.
Principles for high-quality, high-value testing
Open accessAbstract
A survey of doctors working in two large NHS hospitals identified over 120 laboratory tests, imaging investigations and investigational procedures that they considered not to be overused. A common suggestion in this survey was that more training was required. And, this prompted the development of a list of core principles for high-quality, high-value testing. The list can be used as a framework for training and as a reference source. The core principles are: (1) Base testing practices on the best available evidence. (2) Apply the evidence on test performance with careful judgement. (3) Test efficiently. (4) Consider the value (and affordability) of a test before requesting it. (5) Be aware of the downsides and drivers of overdiagnosis. (6) Confront uncertainties. (7) Be patient-centred in your approach. (8) Consider ethical issues. (9) Be aware of normal cognitive limitations and biases when testing. (10) Follow the ‘knowledge journey’ when teaching and learning these core principles.
Overview
The claims and statistics of this paper haven’t been checked yet.
Run the check — free, no account needed. It reads the open-access text and checks the sources it cites.
Integrity signals
Registry
Cites
Statistics
Figures
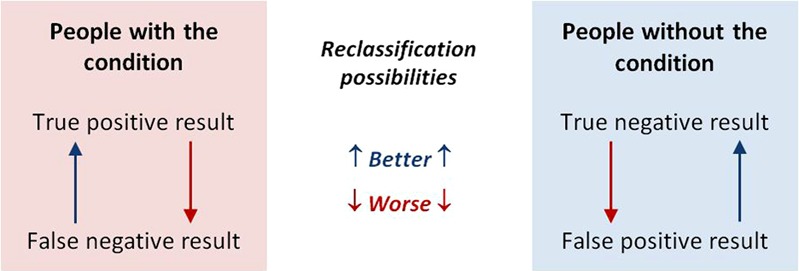
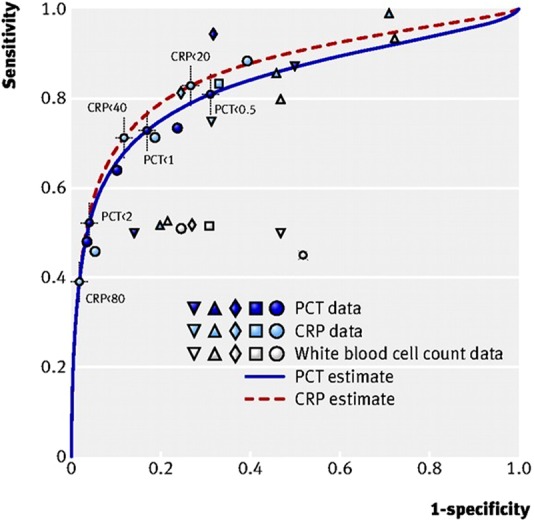
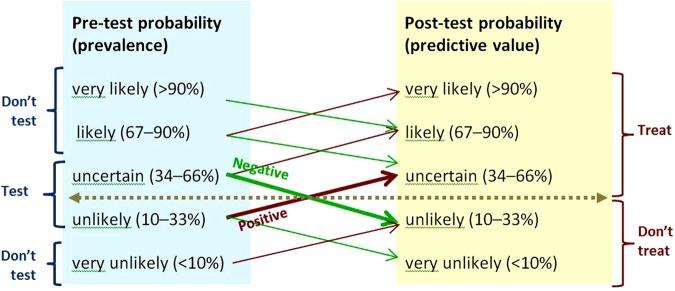
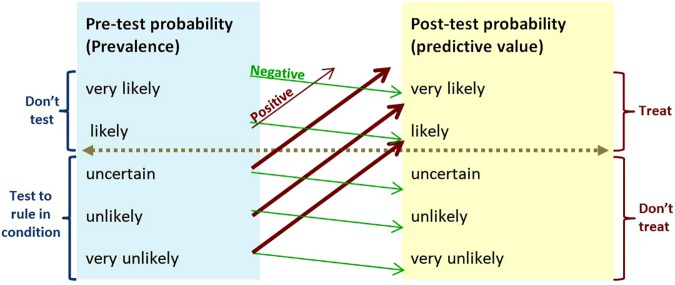
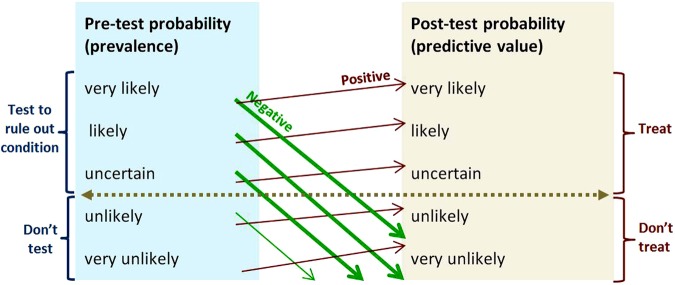
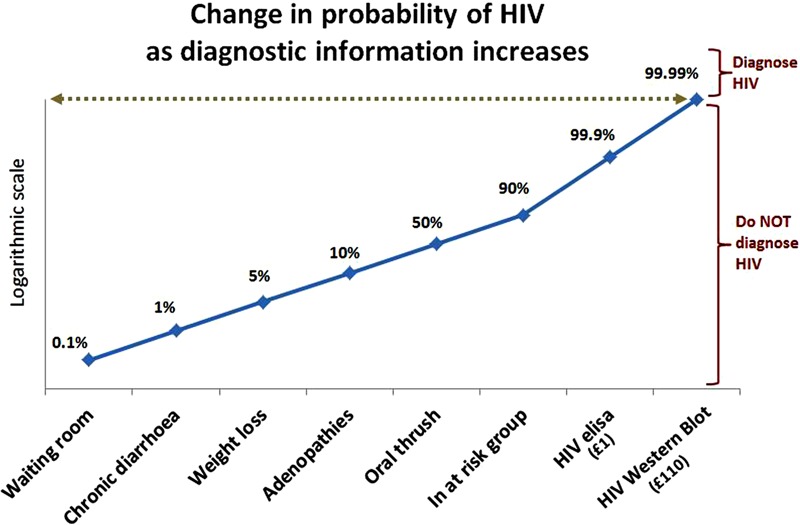
Verification
Claims the paper makes
The claims and statistics of this paper haven’t been checked yet.
Run the check — free, no account needed. It reads the open-access text and checks the sources it cites.
Claims other papers make about this one
Each is checked against this paper’s own text: does it say what the citing paper says it does?
The cited source says what the claim attributes to it.
In the citing paper
“Given that the summation of Se and Sp for oPMN levels was <1.5, 45 our results suggest that an oPMN level >1.43 × 10⁶/mL is a potentially useful test to differentiate S3P and GCP from S2P and GBP; however, this requires further investigation.”
From Prognostic utility of oral neutrophil counts in high-risk periodontitis: A retrospective study (2025) · cites this paper as [45]
Self-check
Percentages, sums and reported differences re-computed from the paper’s own numbers.
The self-check needs the paper’s full text.
Citations
Cites
Pencina, M. J., D' Agostino, R. B., D' Agostino, R. B., & Vasan, R. S. (2008) · Statistics in Medicine · doi:10.1002/sim.2929 · Cited by 6,493
Husby, S., Koletzko, S., Korponay‐Szabó, I. R., Mearin, M. L., Phillips, A., Shamir, R., Troncone, R., Giersiepen, K., Branski, D., Catassi, C., et al. (2012) · Journal of Pediatric Gastroenterology and Nutrition · doi:10.1097/mpg.0b013e31821a23d0 · Cited by 2,683
The Importance of Cognitive Errors in Diagnosis and Strategies to Minimize Them
Croskerry, P. (2003) · Academic Medicine · doi:10.1097/00001888-200308000-00003 · Cited by 1,675
Shared decision making: really putting patients at the centre of healthcare
Stiggelbout, A. M., Weijden, T. V. D., Wit, M. P. T. D., Frosch, D., Legare, F., Montori, V. M., Trevena, L., & Elwyn, G. (2012) · BMJ · doi:10.1136/bmj.e256 · Cited by 1,014
Preventing overdiagnosis: how to stop harming the healthy
Moynihan, R., Doust, J., & Henry, D. (2012) · BMJ · doi:10.1136/bmj.e3502 · Cited by 675
Cognitive interventions to reduce diagnostic error: a narrative review
Graber, M. L., KISSAM, S. M., Payne, V. L., Meyer, A. N. D., Sorensen, A. V., Lenfestey, N. F., Tant, E. M., Henriksen, K., LaBresh, K. A., & Singh, H. (2012) · BMJ Quality & Safety · doi:10.1136/bmjqs-2011-000149 · Cited by 474
(2012) · Journal of Pediatric Gastroenterology and Nutrition · doi:10.1097/01.mpg.0000413582.61110.4a · Cited by 454
Cognitive forcing strategies in clinical decisionmaking
Croskerry, P. (2003) · Annals of Emergency Medicine · doi:10.1067/mem.2003.22 · Cited by 440
How to read a paper: Papers that report diagnostic or screening tests
Greenhalgh, T. (1997) · BMJ · doi:10.1136/bmj.315.7107.540 · Cited by 396
Checklists to Reduce Diagnostic Errors
Ely, J. W., Graber, M. L., & Croskerry, P. (2011) · Academic Medicine · doi:10.1097/acm.0b013e31820824cd · Cited by 366
Cited by
Sorted by citations
Kourtesis, P., Linnell, J., Amir, R., Argelaguet, F., & MacPherson, S. E. (2023) · Virtual Worlds · doi:10.3390/virtualworlds2010002 · Cited by 208
The epic sepsis model falls short-the importance of external validation
Habib, A. R., Lin, A. L., & Grant, R. W. (2021) · JAMA Internal Medicine · doi:10.1001/jamainternmed.2021.3333 · Cited by 101
A Review on Mastitis in Dairy Cows Research: Current Status and Future Perspectives
STANEK, P., Żółkiewski, P., & Januś, E. (2024) · Agriculture · doi:10.3390/agriculture14081292 · Cited by 105
Kim, D. H., Kim, S. W., Basurrah, M. A., Lee, J., & Hwang, S. H. (2023) · American Journal of Roentgenology · doi:10.2214/ajr.22.28556 · Cited by 81
Kasim, S. S., Ibrahim, N., Malek, S., Ibrahim, K. S., Aziz, M. F., Song, C., Chia, Y. C., Ramli, A. S., Negishi, K., & Nasir, N. M. (2023) · The Lancet Regional Health - Western Pacific · doi:10.1016/j.lanwpc.2023.100742 · Cited by 60
Metadata
- Authors
- Power, M., Fell, G., & Wright, M.
- Affiliations
- Newcastle upon Tyne Hospitals NHS Foundation Trust (GB)
- Airedale NHS Foundation Trust (GB)
- Corresponding author
- Power, Michael
- Venue
- Evidence Based Medicine
- Publisher
- BMJ
- Published
- 2012-06-27
- Volume
- 18
- Issue
- 1
- Pages
- 5-10
- ISSN
- 1356-5524 (ISSN-L)
- 1473-6810
- PMC
- PMC3585491
- OpenAlex
- W2051681038
- Cited by
- 394
- References
- 24
- Citations by year
- 2026: 40 · 2025: 84 · 2024: 82 · 2023: 83 · 2022: 58 · 2021: 33 · 2020: 4 · 2019: 2 · 2018: 4 · 2014: 2 · 2013: 2
- FWCI
- 2.27
- Type
- journal article
- Language
- en
- Open access
- hybrid
- doi.org
- Licence
- cc-by-nc
- Locations
- BMJ Evidence-Based Medicine (publishedVersion, cc-by-nc)
- Europe PMC (PubMed Central) (publishedVersion, other-oa)
- PubMed Central (publishedVersion, cc-by-nc)
- PubMed (publishedVersion)
- Topics
- Health Sciences › Health Professions › General Health Professions › Healthcare cost, quality, practices
- Health Sciences › Medicine › Family Practice › Clinical Reasoning and Diagnostic Skills
- Health Sciences › Health Professions › Medical Laboratory Technology › Clinical Laboratory Practices and Quality Control
- Keywords
- overuse of diagnostic testing, high-value care, evidence-based practice, test performance, overdiagnosis, patient-centered care, cognitive biases, medical training, NHS doctors, diagnostic imaging
- MeSH terms
- Cost-Benefit Analysis, Diagnostic Tests, Routine, Humans, Predictive Value of Tests, Quality of Health Care, Sensitivity and Specificity, Evidence-Based Medicine, Uncertainty
About these checks
Registry, retraction, Cites and statistics results are computed, not judged, with one exception: a printed reference that no index lists is read once by a model before it counts as a citation error. Claims are extracted by a model and kept only when their quote appears verbatim in the text; each cited source is then checked, with a model’s help, for whether it says what the claim relies on. Those verdicts can be wrong — read the claim’s quote and the cited source before relying on one.
Statistics and arithmetic are recomputed, not judged.
Confidence bands are shown only for fields calibrated on our annotated test set. None is calibrated yet, so no band is shown.
What counts as a claim ›How we measure confidence ›How we check this ›
Are you an author, or do you see a problem with this page? Request a review
