

The DOI matches its Crossref record; 96 of the 97 references it cites were found in a registry or an index.
The ripple of fear, sympathy and solidarity during the Boston bombings
Open accessAbstract
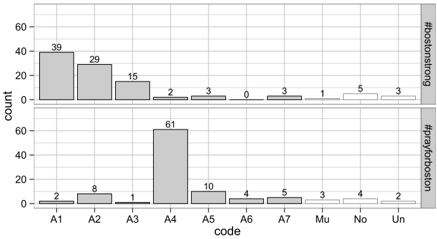
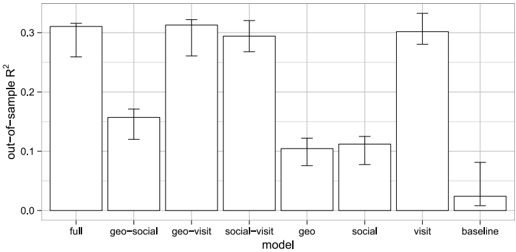
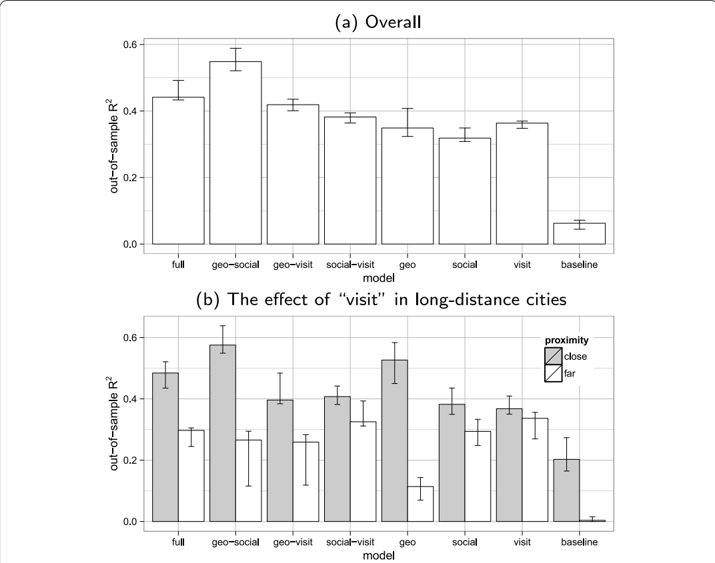
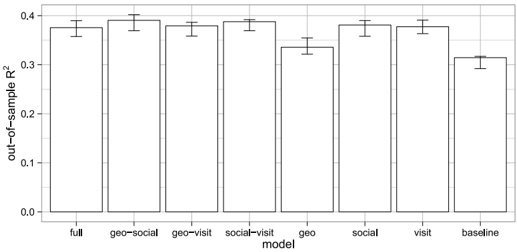
The Boston Marathon bombing presents a rare opportunity to study how a disruptive event can trigger inter-communal emotions and expressions - where members of one community express feelings about and support for members of a distant community. In this work, we use over 180 million geocoded tweets over an entire month to study how Twitter users from different cities expressed three different emotions: fear , sympathy and solidarity , in reaction to the bombings. We capture spikes in fear in different cities by using sentiment and time-series analyses, and track expressions of sympathy and solidarity based on the emergent use of two hashtags, #prayforboston and #bostonstrong, widely adopted after the bombings. We find first that the extent to which communities outside Boston express these emotions is correlated with their geographic proximity, social network connections, and residents’ direct, physical experiences with Boston (captured by the number of citizens who had visited Boston recently). This general effect shows interesting differences across the different kinds of emotions, however. Analyses show that the extent to which residents of a city visit Boston is the best predictor of fear and solidarity expression, as well as a strong predictor of the expression of sympathy. The expression of fear is also directly related to the expression of solidarity. Our study has theoretical implications regarding the diffusion of information and emotional contagion as well as practical implications for understanding how important information and social support can be effectively collected and distributed to populations in need.
Overview
The claims and statistics of this paper haven’t been checked yet.
Run the check — free, no account needed. It reads the open-access text and checks the sources it cites.
Integrity signals
Registry
Cites
Statistics
Figures

Verification
Claims the paper makes
The claims and statistics of this paper haven’t been checked yet.
Run the check — free, no account needed. It reads the open-access text and checks the sources it cites.
Claims other papers make about this one
Each is checked against this paper’s own text: does it say what the citing paper says it does?
The source backs part of the claim, not all of it — or backs it for a different population, condition or comparison.
In the citing paper
“This tool is known to work well with short text and social media data, as revealed in a large body of social computing and crisis informatics literature (Lin and Margolin, 2014; Mark et al., 2012; Saha and De Choudhury, 2017).”
From Impacts of school shooter drills on the psychological well-being of American K-12 school communities: a social media study (2021) · cites this paper as Lin and Margolin, 2014
Experimental — accuracy not yet measured
Self-check
Percentages, sums and reported differences re-computed from the paper’s own numbers.
The self-check needs the paper’s full text.
Citations
Cites
(2005) · Springer eBooks · doi:10.1007/0-387-27255-0_9 · Cited by 20,333
McCullagh, P., & Nelder, J. A. (1989) · doi:10.1007/978-1-4899-3242-6 · Cited by 16,836
An Analysis of Transformations
Box, G. E. P., & Cox, D. R. (1964) · Journal of the Royal Statistical Society Series B (Statistical Methodology) · doi:10.1111/j.2517-6161.1964.tb00553.x · Cited by 15,356
An Integrative Theory of Intergroup Conflict
Tajfel, H., & Turner, J. C. (2000) · Oxford University Press eBooks · doi:10.1093/oso/9780199269464.003.0005 · Cited by 12,701
The Social psychology of intergroup relations
Austin, W. G., & Worchel, S. (1979) · Medical Entomology and Zoology · Cited by 11,577
Slovic, P. (1987) · Science · doi:10.1126/science.3563507 · Cited by 9,271
Social psychology of intergroup relations
Tajfel, H. (1982) · Annual Review of Psychology · doi:10.1146/annurev.ps.33.020182.000245 · Cited by 7,949
Recursive Deep Models for Semantic Compositionality Over a Sentiment Treebank
Socher, R., Perelygin, A., Wu, J., Chuang, J., Manning, C. D., Ng, A., & Potts, C. (2013) · Proceedings of the 2013 Conference on Empirical Methods in Natural Language Processing · doi:10.18653/v1/d13-1170 · Cited by 6,878
The Information Age: Economy, Society and Culture
Castells, M. (1999) · Cited by 6,045
Experimental evidence of massive-scale emotional contagion through social networks
Kramer, A. D. I., Guillory, J. E., & Hancock, J. T. (2014) · Proceedings of the National Academy of Sciences · doi:10.1073/pnas.1320040111 · Cited by 3,687
Research works printed but not linked: 7
- Sutton J, Palen L, Shklovski I: Backchannels on the front lines: emergent uses of social media in the 2007 southern California wildfires. ISCRAM2008 2008, 624–632.
- Globe Staff (2013) 102 hours in pursuit of Marathon bombing suspects - The Boston Globe. Accessed 2014-04-10, [ https://www.bostonglobe.com/metro/2013/04/28/bombreconstruct/VbSZhzHm35yR88EVmVdbDM/story.html ]
- Markon J, Horwitz S, Johnson J (2013) Dzhokhar Tsarnaev charged with using ‘weapon of mass destruction’11. The Washington Post. Chap. National. Accessed 2013–09–15
- Feinsand M (2013) Boston Marathon bombings: Yankees play Neil Diamond’s ’Sweet Caroline,’ a staple at Fenway. Accessed 2014-04-10, [ http://www.nydailynews.com/sports/baseball/yankees-honor-boston-play-sweet-caroline-wake-bombings-article-1.1318805 ]
- Dudek M (2013) Chicagoans run to show solidarity with Boston Marathon victims - Chicago Sun-Times. Accessed 2014-04-10, [ http://www.suntimes.com/news/metro/19530547–418/chicagoans-run-to-show-solidarity-with-boston-marathon-victims.html ]
- Chew C, Eysenbach G: Pandemics in the age of Twitter: content analysis of Tweets during the 2009 H1N1 outbreak. PLoS ONE 2010., 5(11): 10.1371/journal.pone.0014118 · DOI
- Zimmer B (2013) ‘Boston Strong,’ the phrase that rallied a city. Boston Globe Zimmer B (2013) ‘Boston Strong,’ the phrase that rallied a city. Boston Globe
Cited by
Sorted by citations
Social media use in disaster recovery: A systematic literature review
Ogie, R., James, S., Moore, A. R., Dilworth, T.-L., Amirghasemi, M., & Whittaker, J. (2022) · International Journal of Disaster Risk Reduction · doi:10.1016/j.ijdrr.2022.102783 · Cited by 199
Systematic literature review of sentiment analysis on Twitter using soft computing techniques
Kumar, A., & Jaiswal, A. (2019) · Concurrency and Computation Practice and Experience · doi:10.1002/cpe.5107 · Cited by 166
Population Bias in Geotagged Tweets
Malik, M. M., Lamba, H., Nakos, C., & Pfeffer, J. (2021) · Proceedings of the International AAAI Conference on Web and Social Media · doi:10.1609/icwsm.v9i4.14688 · Cited by 172
Modeling Stress with Social Media Around Incidents of Gun Violence on College Campuses
Saha, K., & De Choudhury, M. (2017) · Proceedings of the ACM on Human-Computer Interaction · doi:10.1145/3134727 · Cited by 124
Whose Lives Matter? Mass Shootings and Social Media Discourses of Sympathy and Policy, 2012–2014
Zhang, Y., Shah, D. V., Foley, J. M., Abhishek, A., Lukito, J., Suk, J., Kim, S. J., Sun, Z., Pevehouse, J. C. W., & Garlough, C. (2019) · Journal of Computer-Mediated Communication · doi:10.1093/jcmc/zmz009 · Cited by 92
Metadata
- Authors
- Lin, Y.-R., & Margolin, D.
- Affiliations
- University of Pittsburgh (US)
- Cornell University (US)
- Corresponding author
- Lin, Yu-Ru
- Venue
- EPJ Data Science
- Published
- 2014-11-05
- Volume
- 3
- Issue
- 1
- ISSN
- 2193-1127 (ISSN-L)
- OpenAlex
- W2149307575
- Cited by
- 72
- References
- 97
- Citations by year
- 2026: 1 · 2025: 2 · 2024: 3 · 2023: 5 · 2022: 9 · 2021: 13 · 2020: 7 · 2019: 7 · 2018: 11 · 2017: 7 · 2016: 4 · 2015: 1 · 2014: 1
- FWCI
- 12.77
- Type
- journal article
- Language
- en
- Open access
- gold
- doi.org
- Licence
- Locations
- EPJ Data Science (publishedVersion, cc-by)
- D-Scholarship@Pitt (University of Pittsburgh) (acceptedVersion)
- Funders
- National Science Foundation (1423697)
- Topics
- Social Sciences › Communication › Public Relations and Crisis Communication
- Physical Sciences › Computer Science › Artificial Intelligence › Sentiment Analysis and Opinion Mining
- Physical Sciences › Physics and Astronomy › Statistical and Nonlinear Physics › Complex Network Analysis Techniques
- Keywords
- Boston Marathon bombing, fear, sympathy, solidarity, emotional contagion, hashtags, Twitter, geographic proximity, disaster response, social support
About these checks
Registry, retraction, Cites and statistics results are computed, not judged, with one exception: a printed reference that no index lists is read once by a model before it counts as a citation error. Claims are extracted by a model and kept only when their quote appears verbatim in the text; each cited source is then checked, with a model’s help, for whether it says what the claim relies on. Those verdicts can be wrong — read the claim’s quote and the cited source before relying on one.
Statistics and arithmetic are recomputed, not judged.
Confidence bands are shown only for fields calibrated on our annotated test set. None is calibrated yet, so no band is shown.
What counts as a claim ›How we measure confidence ›How we check this ›
Are you an author, or do you see a problem with this page? Request a review
