

The DOI matches its Crossref record; 65 of the 65 references it cites were found in a registry or an index; 3 of the 38 sources its claims cite were checked for support.
VoxLens: Making Online Data Visualizations Accessible with an Interactive JavaScript Plug-In
Open accessAbstract
JavaScript visualization libraries are widely used to create online data visualizations but provide limited access to their information for screen-reader users. Building on prior findings about the experiences of screen-reader users with online data visualizations, we present VoxLens, an open-source JavaScript plug-in that—with a single line of code—improves the accessibility of online data visualizations for screen-reader users using a multi-modal approach. Specifically, VoxLens enables screen-reader users to obtain a holistic summary of presented information, play sonified versions of the data, and interact with visualizations in a “drill-down” manner using voice-activated commands. Through task-based experiments with 21 screen-reader users, we show that VoxLens improves the accuracy of information extraction and interaction time by 122% and 36%, respectively, over existing conventional interaction with online data visualizations. Our interviews with screen-reader users suggest that VoxLens is a “game-changer” in making online data visualizations accessible to screen-reader users, saving them time and effort.
Overview
CoChat Summary
## TL;DR
VoxLens is an open-source JavaScript plug-in that makes online data visualizations more accessible to screen-reader users through question-and-answer, summary, and sonification modes. In a task-based experiment with 21 screen-reader users, VoxLens improved information-extraction accuracy by 122% and reduced interaction time by 36% compared with no VoxLens.
## Key findings
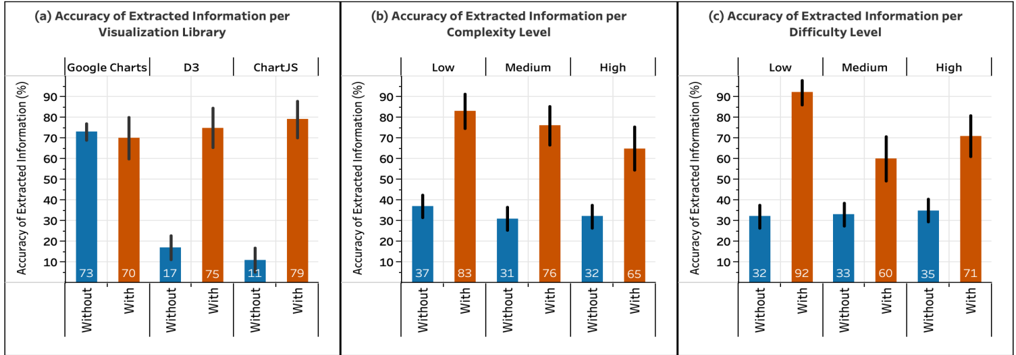
- With VoxLens, screen-reader users achieved 75% accuracy in extracting information, compared with 34% without VoxLens, a 122% improvement.
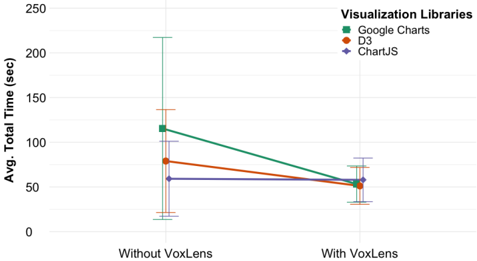
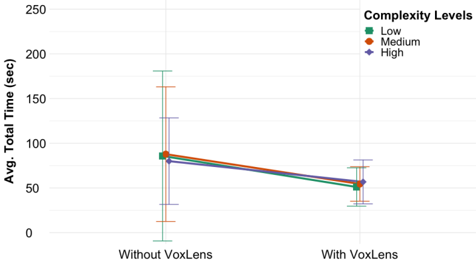
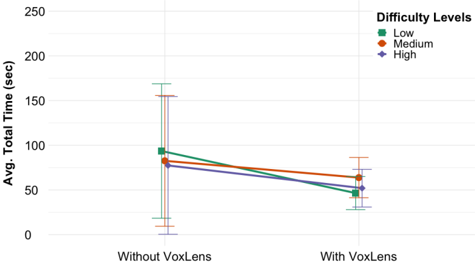
- VoxLens reduced mean interaction time to 54.1 seconds (SD = 21.9) versus 84.6 seconds (SD = 75.2) without VoxLens, a 36% reduction.
- The effect of VoxLens on accuracy was statistically significant (χ²(1, N = 57) = 38.16, p < .001, Cramer's V = .14).
- The effect of VoxLens on interaction time was statistically significant (F(4, 54) = 12.66, p = .001, η² = .19), and interviewees described VoxLens as a “game-changer,” with question-and-answer, sonification, and summary modes all valued.
## Methods
- The paper presents the design of VoxLens, an open-source JavaScript plug-in built with a user-centered iterative process and three interaction modes: Question-and-Answer, Summary, and Sonification.
- Evaluation used an online mixed-factorial experiment with 22 screen-reader users recruited, of whom 21 were analyzed for the task-based study; the comparison baseline for the non-VoxLens condition used prior work’s data (N = 36).
- Main analysis used a mixed logistic regression for Accuracy of Extracted Information and a linear mixed model for Interaction Time, with factors for VoxLens, visualization library, data complexity, question difficulty, and age; the paper also conducted follow-up interviews with 6 participants and a NASA-TLX workload survey.
## Limitations
- The paper states VoxLens is currently limited to two-dimensional, single-series data visualizations.
- The paper states VoxLens is only fully functional on Google Chrome because Web Speech API support is limited there.
- Evident from the text: the evaluation is constrained to the specific visualization libraries and task types tested (Google Charts, D3, ChartJS; three chart types), so the results may not generalize beyond those settings.
Model-written summary. Check it against the paper before relying on it.
Integrity signals
Registry
Cites
Statistics
Figures
Verification
Claims the paper makes
3 Valid · 1 Not valid · 27 Not checked · 87 Own results and interpretations
The sources with a verdict support this claim; the rest weren’t checked yet, have no full text we could read, or their verdicts aren’t rated yet.
In the paper
“However, the visual nature of data visualizations inherently disenfranchises screen-reader users, who may not be able to see or recognize visual patterns [52,57].”
§ VoxLens: Making Online Data Visualizations Accessible with an Interactive JavaScript Plug-In > 1 INTRODUCTION
What the sources say
- Not checked — no full text of the sourcecites [52] 52. Eckhard Limpert, Werner A. Stahel, and Markus Abbt. 2001. Log-normal distri- butions across the sciences: keys and clues: on the charms of statistics, and how mechanical models resembling gambling machines ofer a link to a handy way to characterize log-normal distributions, which can provide deeper insight into variability and probability-normal or log-normal: that is the question. BioScience 51, 5 (2001), 341-352. source
- Supportedcites [57] 57. David K. McGookin and Stephen A. Brewster. 2006. SoundBar: Exploiting Multiple Views in Multimodal Graph Browsing. In Proceedings of the 4th Nordic Conference on Human-Computer Interaction: Changing Roles (Oslo, Norway) (NordiCHI '06). Association for Computing Machinery, New York, NY, USA, 145-154. https: //doi.org/10.1145/1182475.1182491 source
In “Attitudes to Graphs” (p. 3), the paper says screen readers can read graph values but do not provide the quick comparisons available from a visual graph; it says ineffective access limits opportunities for visually impaired people. The Introduction (p. 2) also describes the difficulty visually impaired users face accessing nontextual graphs. (LLM, conf=0.89)
plainstates a cause- Asserted: passes — The authors put it forward as true.
- Checkable: passes — It can be checked against evidence.
- Load-bearing: passes — The paper’s conclusions depend on it.
- Based: passes — The paper gives a reason why it holds.
Every source the paper cites for this claim was checked and supports it.
In the paper
“Non-screen-reader users utilize their visual system's power to quickly recognize patterns and extrapolate information from graphs, such as overall trends and extrema [57].”
§ VoxLens: Making Online Data Visualizations Accessible with an Interactive JavaScript Plug-In > 6.1 Simultaneous Improvement In Accuracy and Interaction Times
What the sources say
- Supportedcites [57] 57. David K. McGookin and Stephen A. Brewster. 2006. SoundBar: Exploiting Multiple Views in Multimodal Graph Browsing. In Proceedings of the 4th Nordic Conference on Human-Computer Interaction: Changing Roles (Oslo, Norway) (NordiCHI '06). Association for Computing Machinery, New York, NY, USA, 145-154. https: //doi.org/10.1145/1182475.1182491 source
The Graph Browsing Theory section (p. 4) says visual processing rapidly builds a description of a graph and enables users to identify trends by comparing bar heights. Attitudes to Graphs (p. 3) says graphs allow multiple data points to be compared quickly, while Standard View Condition Usage (p. 8) contrasts visual inspection with a slower search for relevant bars. Together, these support the paraphrase, including its examples of trends and extrema. (LLM, conf=0.88)
plainstates a cause- Asserted: passes — The authors put it forward as true.
- Checkable: passes — It can be checked against evidence.
- Load-bearing: passes — The paper’s conclusions depend on it.
- Based: passes — The paper gives a reason why it holds.
- Supported
A result the paper reports from its own data — it cites no other source for it, so there is none to check. The quote shows it is in the paper.
In the paper
“At the same time, screen-reader users preferred concisely stated information.”
§ VoxLens: Making Online Data Visualizations Accessible with an Interactive JavaScript Plug-In > 3.1.3 Summary Mode.
plain- Asserted: passes — The authors put it forward as true.
- Checkable: passes — It can be checked against evidence.
- Load-bearing: passes — The paper’s conclusions depend on it.
- Based: passes — The paper gives a reason why it holds.
A result the paper reports from its own data — it cites no other source for it, so there is none to check. The quote shows it is in the paper.
In the paper
“Through task-based experiments with 21 screen-reader users, we show that VoxLens improves the accuracy of information extraction and interaction time by 122% and 36%, respectively, over existing conventional interaction with online data visualizations.”
- Also stated in: § 1 INTRODUCTION · plain
“Our results show that with VoxLens, compared to without it, screen-reader users improved their accuracy of extracting information by 122% and reduced their overall interaction time by 36%.”
- Also stated in: § 1 INTRODUCTION · plain
“VoxLens increased their accuracy of extracting information by 122% and decreased their interaction time by 36% compared to not using VoxLens.”
§ VoxLens: Making Online Data Visualizations Accessible with an Interactive JavaScript Plug-In > Abstract
boostedstates a cause- Asserted: passes — The authors put it forward as true.
- Checkable: passes — It can be checked against evidence.
- Load-bearing: passes — The paper’s conclusions depend on it.
- Based: passes — The paper gives a reason why it holds.
- Also stated in: § 1 INTRODUCTION · plain
A result the paper reports from its own data — it cites no other source for it, so there is none to check. The quote shows it is in the paper.
In the paper
“Additionally, we conducted followup semi-structured interviews with six participants, fnding that VoxLens is a positive step forward in making online data visualizations accessible, interactive dialogue is one of the 'top' features, sonifcation helps in 'visualizing' data, and data summary is a good starting point.”
§ VoxLens: Making Online Data Visualizations Accessible with an Interactive JavaScript Plug-In > 1 INTRODUCTION
plainn = 6- Asserted: passes — The authors put it forward as true.
- Checkable: passes — It can be checked against evidence.
- Load-bearing: unclear — It is unclear whether the paper’s conclusions depend on it.
- Based: passes — The paper gives a reason why it holds.
44 more claims
Create a free account to see all 118 claims and to verify the 2 references still open.
- Probably not a substantial claim. 36
- It may state two separate claims as one. 48
Claims other papers make about this one
Each is checked against this paper’s own text: does it say what the citing paper says it does?
The source backs part of the claim, not all of it — or backs it for a different population, condition or comparison.
In the citing paper
“The performance of users with VoxLens did not significantly differ between visualization libraries [70].”
From Understanding and Improving Drilled-Down Information Extraction from Online Data Visualizations for Screen-Reader Users (2023) · cites this paper as [70]
Experimental — accuracy not yet measuredThe source backs part of the claim, not all of it — or backs it for a different population, condition or comparison.
In the citing paper
“Through a second controlled experiment, they found that screen reader users extracted information 61% less accurately and spent 211% more time interacting with online data visualizations compared to non-screen-reader users due to inaccessibility of the visualizations explored.”
From The Accessibility of Data Visualizations on the Web for Screen Reader Users: Practices and Experiences During COVID-19 (2023) · cites this paper as [102]
Experimental — accuracy not yet measuredThe source backs part of the claim, not all of it — or backs it for a different population, condition or comparison.
In the citing paper
“Sharif et al. found that many visualizations were not discoverable through screen reader access and identifed several needs and techniques of screen reader users [102].”
From The Accessibility of Data Visualizations on the Web for Screen Reader Users: Practices and Experiences During COVID-19 (2023) · cites this paper as [102]
Experimental — accuracy not yet measuredThe source backs part of the claim, not all of it — or backs it for a different population, condition or comparison.
In the citing paper
“Several studies conducted around the same time validate these observations [62,102].”
From The Accessibility of Data Visualizations on the Web for Screen Reader Users: Practices and Experiences During COVID-19 (2023) · cites this paper as [102]
Experimental — accuracy not yet measuredThe source backs part of the claim, not all of it — or backs it for a different population, condition or comparison.
In the citing paper
“While these tools, libraries, and services provide convenient ways to organize and convey large quantities of data and visualizations, both our audit and other recent work [102] found that they are mostly inaccessible to screen reader users, even two years after the beginning of the pandemic.”
From The Accessibility of Data Visualizations on the Web for Screen Reader Users: Practices and Experiences During COVID-19 (2023) · cites this paper as [102]
Experimental — accuracy not yet measured
10 more claims about this paper
Create a free account to see every claim other papers make about this one.
Statistics recomputed
Every reported test result, recomputed from its test statistic and degrees of freedom. A result shows as not adding up only once an independent check has confirmed it.
- ConsistentF(4, 54) = 12.66reported p < .05 · recomputed p < .001
“F (4,54)=12.66,p < .05”
- ConsistentF(4, 444) = 33.89reported p < .001 · recomputed p < .001
“F (4,444)=33.89,p < .001”
- ConsistentF(1, 54) = 5.03reported p < .05 · recomputed p = .029
“F (1,54)=5.03,p < .05”
- ConsistentF(4, 54) = 48.84reported p < .001 · recomputed p < .001
“F (4,54)=48.84,p < .001”
Self-check
Percentages, sums and reported differences re-computed from the paper’s own numbers.
Self-check results appear here once an independent check has confirmed them.
Citations
Cites
Using thematic analysis in psychology
Braun, V., & Clarke, V. (2006) · Qualitative Research in Psychology · doi:10.1191/1478088706qp063oa · Cited by 194,414
The Measurement of Observer Agreement for Categorical Data
Landis, J. R., & Koch, G. G. (1977) · Biometrics · doi:10.2307/2529310 · Cited by 81,148 · cited 1×
“As suggested by Lombard et al. [51], we calculated inter-rater reliability (IRR) using pairwise percentage agreement together with Krippendorf’s α [49].”
MethodQualitative evaluation and research methods
Ellis, D. (1990) · International Journal of Information Management · doi:10.1016/0268-4012(90)90041-p · Cited by 17,943
Content Analysis: An Introduction to Its Methodology
Krippendorff, K. (2019) · doi:10.4135/9781071878781 · Cited by 15,448 · cited 1×
“81, indicating a high level of reliability [50].”
BackgroundDevelopment of NASA-TLX (Task Load Index): Results of Empirical and Theoretical Research
(1988) · Advances in Psychology · doi:10.1016/s0166-4115(08)62386-9 · Cited by 15,003
Bostock, M., Ogievetsky, V., & Heer, J. (2011) · IEEE Transactions on Visualization and Computer Graphics · doi:10.1109/tvcg.2011.185 · Cited by 3,165 · cited 1×
“Bostock et al. [11] developed D3—a powerful visualization library that uses web standards to generate graphs.”
MethodStatistical analysis of repeated measures data using SAS procedures.
Littell, R. C., Henry, P. R., & Ammerman, C. B. (1998) · Journal of Animal Science · doi:10.2527/1998.7641216x · Cited by 2,825 · cited 2×
“For Interaction Time ( IT ), we used a linear mixed model [30, 54] with the same model terms as for AEI .”
MethodLog-normal distributions across the sciences: keys and clues
LIMPERT, E., STAHEL, W. A., & ABBT, M. (2001) · BioScience · doi:10.1641/0006-3568(2001)051[0341:lndats]2.0.co;2 · Cited by 2,621 · cited 1×
“To achieve normality, we applied logarithmic transformation prior to analysis, as is common practice for time measures [9, 41, 53].”
MethodAnderson, T. W., & Darling, D. A. (1954) · Journal of the American Statistical Association · doi:10.1080/01621459.1954.10501232 · Cited by 2,450
Proceedings of the 2020 CHI Conference on Human Factors in Computing Systems
(2020) · doi:10.1145/3313831 · Cited by 1,951
Research works printed but not linked: 7
- Ronald J. Baken and Robert F. Orlikoff . 2000. Clinical Measurement of Speech and Voice. Singular Thomson Learning , San Diego , California, USA. https://books.google.com/books?id=ElPyvaJbDiwC Ronald J. Baken and Robert F. Orlikoff. 2000. Clinical Measurement of Speech and Voice. Singular Thomson Learning, San Diego, California, USA. https://books.google.com/books?id=ElPyvaJbDiwC
- Lorna M. Brown , Stephen A. Brewster , Ramesh Ramloll , Mike Burton , and Beate Riedel . 2003 . Design guidelines for audio presentation of graphs and tables . In Proceedings of the 9th International Conference on Auditory Display. Citeseer , Boston University, USA, 284–287. Lorna M. Brown, Stephen A. Brewster, Ramesh Ramloll, Mike Burton, and Beate Riedel. 2003. Design guidelines for audio presentation of graphs and tables. In Proceedings of the 9th International Conference on Auditory Display. Citeseer, Boston University, USA, 284–287.
- John H. Flowers . 2005 . Thirteen years of reflection on auditory graphing: Promises, pitfalls, and potential new directions . In Proceedings of the 11th Meeting of the International Conference on Auditory Display. Citeseer , Limerick, Ireland, 406–409. John H. Flowers. 2005. Thirteen years of reflection on auditory graphing: Promises, pitfalls, and potential new directions. In Proceedings of the 11th Meeting of the International Conference on Auditory Display. Citeseer, Limerick, Ireland, 406–409.
- Brigitte N. Frederick . 1999. Fixed- , random-, and mixed-effects ANOVA models: A user-friendly guide for increasing the generalizability of ANOVA results . In Advances in Social Science Methodology, B. Thompson (Ed.) . JAI Press, Stamford , Connecticut , 111–122. Brigitte N. Frederick. 1999. Fixed-, random-, and mixed-effects ANOVA models: A user-friendly guide for increasing the generalizability of ANOVA results. In Advances in Social Science Methodology, B. Thompson (Ed.). JAI Press, Stamford, Connecticut, 111–122.
- Deen G. Freelon . 2010 . ReCal: Intercoder reliability calculation as a web service . International Journal of Internet Science 5 , 1 (2010), 20 – 33 . Deen G. Freelon. 2010. ReCal: Intercoder reliability calculation as a web service. International Journal of Internet Science 5, 1 (2010), 20–33.
- Melita Hajdinjak and France Mihelic . 2004. Conducting the Wizard-of-Oz Experiment.Informatica (Slovenia) 28, 4 ( 2004 ), 425–429. Melita Hajdinjak and France Mihelic. 2004. Conducting the Wizard-of-Oz Experiment.Informatica (Slovenia) 28, 4 (2004), 425–429.
- Frances Van Scoy , Don McLaughlin , and Angela Fullmer . 2005 . Auditory augmentation of haptic graphs: Developing a graphic tool for teaching precalculus skill to blind students . In Proceedings of the 11th Meeting of the International Conference on Auditory Display, Vol. 5. Citeseer , Limerick, Ireland, 5 pages. Frances Van Scoy, Don McLaughlin, and Angela Fullmer. 2005. Auditory augmentation of haptic graphs: Developing a graphic tool for teaching precalculus skill to blind students. In Proceedings of the 11th Meeting of the International Conference on Auditory Display, Vol. 5. Citeseer, Limerick, Ireland, 5 pages.
Cited by
Sharif, A., McCall, A. L., & Bolante, K. R. (2022) · Proceedings of the 24th International ACM SIGACCESS Conference on Computers and Accessibility · doi:10.1145/3517428.3544813 · Cited by 85
“We used VoxLens [58], an open-source JavaScript plug-in that improves the accessibility of online data visualizations using a multimodal approach.”
MethodInfluentialSelf-citationGenAssist: Making Image Generation Accessible
Huh, M., Peng, Y.-H., & Pavel, A. (2023) · Proceedings of the 36th Annual ACM Symposium on User Interface Software and Technology · doi:10.1145/3586183.3606735 · Cited by 67
“However, both text-to-image generation and GenAssist do not yet support images that are information-rich or densely structured such as information visualizations [64, 65] or diagrams [3, 66].”
BackgroundFan, D., Fay Siu, A., Rao, H., Kim, G. S.-H., Vazquez, X., Greco, L., O'Modhrain, S., & Follmer, S. (2023) · ACM Transactions on Accessible Computing · doi:10.1145/3557899 · Cited by 46
“Voxlens is a library that makes JavaScript-based visualizations more accessible through only one line of code [103].”
BackgroundChart Reader: Accessible Visualization Experiences Designed with Screen Reader Users
Thompson, J. R., Martinez, J. J., Sarıkaya, A., Cutrell, E. B., & Lee, B. (2023) · CHI Conference on Human Factors in Computing Systems · doi:10.1145/3544548.3581186 · Cited by 73
“Combining the designs of the state-ofthe-art work [29, 30, 38], Chart Reader incorporates narration with non-speech audio (e.”
BackgroundMethodInfluentialVizAbility: Enhancing Chart Accessibility with LLM-based Conversational Interaction
Gorniak, J., Kim, Y., Wei, D., & Kim, N. W. (2024) · ACM Symposium on User Interface Software and Technology (UIST) · doi:10.1145/3654777.3676414 · Cited by 66
Metadata
- Authors
- Sharif, A., Wang, O. H., Muongchan, A. T., Reinecke, K., & Wobbrock, J. O.
- Affiliations
- University of Washington (US)
- Venue
- CHI Conference on Human Factors in Computing Systems
- Publisher
- ACM
- Published
- 2022-04-29
- Pages
- 1-19
- OpenAlex
- W4225166214
- Semantic Scholar
- 64c688a03b9042b796e1e850bd352df2b0da7f40
- Cited by
- 86
- References
- 47
- Citations by year
- 2026: 12 · 2025: 15 · 2024: 30 · 2023: 24 · 2022: 5
- FWCI
- 26.96
- Type
- conference paper
- Language
- en
- Open access
- hybrid
- doi.org
- Licence
- Locations
- CHI Conference on Human Factors in Computing Systems (publishedVersion, cc-by)
- Funders
- University of Washington
- Topics
- Social Sciences › Human Factors and Ergonomics › Digital Accessibility for Disabilities
- Physical Sciences › Computer Science › Computer Graphics and Computer-Aided Design › Data Visualization and Analytics
- Life Sciences › Neuroscience › Cognitive Neuroscience › Tactile and Sensory Interactions
- Keywords
- web-based visualization, accessibility, sonification, multimodal interaction, assistive technology, information extraction
About these checks
Registry, retraction, Cites and statistics results are computed, not judged, with one exception: a printed reference that no index lists is read once by a model before it counts as a citation error. Claims are extracted by a model and kept only when their quote appears verbatim in the text; each cited source is then checked, with a model’s help, for whether it says what the claim relies on. Those verdicts can be wrong — read the claim’s quote and the cited source before relying on one.
The claim verdicts this report counts are experimental: their accuracy is not yet measured.
A language model drew the claims from the paper on 2026-10-10, under version 3 of the claim definition (model deepseek-v4.1-flash, prompt extract-v3).
A second model labelled each claim on 2026-10-10 (model jev-1.13-20260917, definition revision gold-guideline-v0.2).
Cited sources are checked with a language model’s help (gpt-6-sol).
Statistics and arithmetic are recomputed, not judged.
Confidence bands are shown only for fields calibrated on our annotated test set. None is calibrated yet, so no band is shown.
What counts as a claim ›How we measure confidence ›How we check this ›
Are you an author, or do you see a problem with this page? Request a review
How to cite
Cite CoChat for the checks on this page, and the paper for its own findings.
- This page
- CoChat. (2026). Citation check: VoxLens: Making Online Data Visualizations Accessible with an Interactive JavaScript Plug-In. https://app.cochat.ai/papers/10.1145/3491102.3517431
- The paper
- Sharif, A., Wang, O. H., Muongchan, A. T., Reinecke, K., & Wobbrock, J. O. (2022). VoxLens: Making Online Data Visualizations Accessible with an Interactive JavaScript Plug-In. CHI Conference on Human Factors in Computing Systems. https://doi.org/10.1145/3491102.3517431
Data sources
Bibliographic data: Semantic Scholar, OpenAlex, Crossref.
Contains information from the Semantic Scholar Academic Graph Datasets, made available under the ODC Attribution License (ODC-BY 1.0).
Semantic Scholar’s data is described in: Kinney, R., et al. (2023). The Semantic Scholar Open Data Platform. arXiv:2301.10140.
