

Multi-Variate Time Series Forecasting on Variable Subsets
Open accessThe DOI matches its Crossref record; 35 of the 35 references it cites were found in a registry or an index.
Abstract
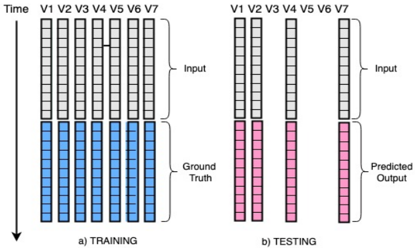
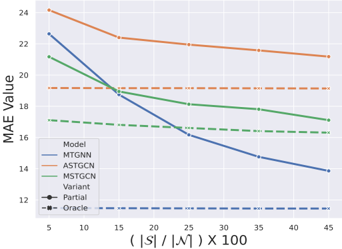
We formulate a new inference task in the domain of multivariate time series forecasting (MTSF), called Variable Subset Forecast (VSF), where only a small subset of the variables is available during inference. Variables are absent during inference because of long-term data loss (eg. sensor failures) or high -> low-resource domain shift between train / test. To the best of our knowledge, robustness of MTSF models in presence of such failures, has not been studied in the literature. Through extensive evaluation, we first show that the performance of state of the art methods degrade significantly in the VSF setting. We propose a non-parametric, wrapper technique that can be applied on top any existing forecast models. Through systematic experiments across 4 datasets and 5 forecast models, we show that our technique is able to recover close to 95% performance of the models even when only 15% of the original variables are present.
Overview
The claims and statistics of this paper haven’t been checked yet.
Free: it reads the open-access text and checks the first 5 claims that cite a source we can check. Create a free account to check every claim.
Integrity signals
Registry
Cites
Statistics
Figures
Verification
Claims the paper makes
The claims and statistics of this paper haven’t been checked yet.
Free: it reads the open-access text and checks the first 5 claims that cite a source we can check. Create a free account to check every claim.
Self-check
Percentages, sums and reported differences re-computed from the paper’s own numbers.
The self-check needs the paper’s full text.
Citations
Cites
Spatial Temporal Graph Convolutional Networks for Skeleton-Based Action Recognition
Yan, S., Xiong, Y., & Lin, D. (2018) · Proceedings of the AAAI Conference on Artificial Intelligence · doi:10.1609/aaai.v32i1.12328 · Cited by 5,410
An Empirical Evaluation of Generic Convolutional and Recurrent Networks for Sequence Modeling
Bai, S., Kolter, J. Z., & Koltun, V. (2018) · arXiv · doi:10.48550/arxiv.1803.01271 · Cited by 4,655
Billion-scale similarity search with GPUs
Johnson, J., Douze, M., & Jegou, H. (2021) · IEEE Transactions on Big Data · doi:10.1109/tbdata.2019.2921572 · Cited by 4,228
Billion-scale similarity search with GPUs
Johnson, J., Douze, M., & Jégou, H. (2017) · arXiv · doi:10.48550/arxiv.1702.08734 · Cited by 4,140
Attention Based Spatial-Temporal Graph Convolutional Networks for Traffic Flow Forecasting
Guo, S., Lin, Y., Feng, N., Song, C., & Wan, H. (2019) · Proceedings of the AAAI Conference on Artificial Intelligence · doi:10.1609/aaai.v33i01.3301922 · Cited by 3,123 · cited 5×
“(iii) MSTGCN [8]: This method utilizes”
BackgroundMethodInfluentialGraph WaveNet for Deep Spatial-Temporal Graph Modeling
Wu, Z., Pan, S., Long, G., Jiang, J., & Zhang, C. (2019) · Proceedings of the Twenty-Eighth International Joint Conference on Artificial Intelligence · doi:10.24963/ijcai.2019/264 · Cited by 2,948
Modeling Long- and Short-Term Temporal Patterns with Deep Neural Networks
Lai, G., Chang, W.-C., Yang, Y., & Liu, H. (2018) · The 41st International ACM SIGIR Conference on Research & Development in Information Retrieval · doi:10.1145/3209978.3210006 · Cited by 2,152
Connecting the Dots: Multivariate Time Series Forecasting with Graph Neural Networks
Wu, Z., Pan, S., Long, G., Jiang, J., Chang, X., & Zhang, C. (2020) · Proceedings of the 26th ACM SIGKDD International Conference on Knowledge Discovery & Data Mining · doi:10.1145/3394486.3403118 · Cited by 2,001
A Transformer-based Framework for Multivariate Time Series Representation Learning
Zerveas, G., Jayaraman, S., Patel, D., Bhamidipaty, A., & Eickhoff, C. (2021) · Proceedings of the 27th ACM SIGKDD Conference on Knowledge Discovery & Data Mining · doi:10.1145/3447548.3467401 · Cited by 1,278
Deep State Space Models for Time Series Forecasting
Rangapuram, S. S., Seeger, M., Gasthaus, J. A., Stella, L., Wang, Y., & Januschowski, T. (2018) · neural information processing systems · Cited by 1,097
Research works printed but not linked: 3
- Defu Cao Yujing Wang Juanyong Duan Ce Zhang Xia Zhu Congrui Huang Yunhai Tong Bixiong Xu Jing Bai Jie Tong and Qi Zhang. 2020. Spectral Temporal Graph Neural Network for Multivariate Time-series Forecasting. In Advances in Neural Information Processing Systems .
- 10.5555/3104482.3104599 · doi:10.5555/3104482.3104599
- Yaguang Li, Rose Yu, Cyrus Shahabi, and Yan Liu. 2018. Diffusion Convolutional Recurrent Neural Network: Data-Driven Traffic Forecasting. In International Conference on Learning Representations .
Cited by
Jin, M., Koh, H. Y., Wen, Q., Zambon, D., Alippi, C., Webb, G. I., King, I., & Pan, S. (2024) · IEEE Transactions on Pattern Analysis and Machine Intelligence · doi:10.1109/tpami.2024.3443141 · Cited by 567
Self-Supervised Learning for Time Series Analysis: Taxonomy, Progress, and Prospects
Zhang, K., Wen, Q., Zhang, C., Cai, R., Jin, M., Liu, Y., Zhang, J. Y., Liang, Y., Pang, G., Song, D., et al. (2024) · IEEE Transactions on Pattern Analysis and Machine Intelligence · doi:10.1109/tpami.2024.3387317 · Cited by 295
“[73], who defined a new time series forecasting task called variable subset forecast (VSF).”
Background
Metadata
- Authors
- Chauhan, J., Raghuveer, A., Saket, R., Nandy, J., & Ravindran, B.
- Affiliations
- Google (United States) (US)
- Indian Institute of Technology Madras (IN)
- Venue
- Proceedings of the 28th ACM SIGKDD Conference on Knowledge Discovery and Data Mining
- Publisher
- ACM
- Published
- 2022-08-14
- Pages
- 76-86
- OpenAlex
- W4283706581
- Cited by
- 21
- References
- 35
- Citations by year
- 2026: 3 · 2025: 11 · 2024: 4 · 2023: 3
- FWCI
- 3.20
- Type
- conference paper
- Language
- en
- Open access
- hybrid
- doi.org
- Licence
- Locations
- ACM SIGKDD Conference on Knowledge Discovery and Data Mining (KDD) (publishedVersion, cc-by)
- arXiv (Cornell University) (submittedVersion)
- arXiv (Cornell University)
- Topics
- Physical Sciences › Computer Science › Signal Processing › Time Series Analysis and Forecasting
- Social Sciences › Decision Sciences › Management Science and Operations Research › Forecasting Techniques and Applications
- Social Sciences › Transportation › Traffic Prediction and Management Techniques
- Keywords
- multivariate time series forecasting, missing variables, sensor faults, domain shift, model robustness, data loss
About these checks
Registry, retraction, Cites and statistics results are computed, not judged, with one exception: a printed reference that no index lists is read once by a model before it counts as a citation error. Claims are extracted by a model and kept only when their quote appears verbatim in the text; each cited source is then checked, with a model’s help, for whether it says what the claim relies on. Those verdicts can be wrong — read the claim’s quote and the cited source before relying on one.
Statistics and arithmetic are recomputed, not judged.
Confidence bands are shown only for fields calibrated on our annotated test set. None is calibrated yet, so no band is shown.
What counts as a claim ›How we measure confidence ›How we check this ›
Are you an author, or do you see a problem with this page? Request a review
How to cite
Cite CoChat for the checks on this page, and the paper for its own findings.
- This page
- CoChat. (2026). Citation check: Multi-Variate Time Series Forecasting on Variable Subsets. https://app.cochat.ai/papers/10.1145/3534678.3539394
- The paper
- Chauhan, J., Raghuveer, A., Saket, R., Nandy, J., & Ravindran, B. (2022). Multi-Variate Time Series Forecasting on Variable Subsets. Proceedings of the 28th ACM SIGKDD Conference on Knowledge Discovery and Data Mining. https://doi.org/10.1145/3534678.3539394
Data sources
Bibliographic data: Semantic Scholar, OpenAlex, Crossref.
Contains information from the Semantic Scholar Academic Graph Datasets, made available under the ODC Attribution License (ODC-BY 1.0).
Semantic Scholar’s data is described in: Kinney, R., et al. (2023). The Semantic Scholar Open Data Platform. arXiv:2301.10140.
