

The DOI matches its Crossref record; 21 of the 23 references it cites were found in a registry or an index, and 2 are not checked yet; none of the 58 sources its claims cite is checked for support yet.
Context, Reasoning, and Hierarchy: A Cost-Performance Study of Compound LLM Agent Design in an Adversarial POMDP
Open accessAbstract
Deploying compound LLM agents in adversarial, partially observable sequential environments requires navigating several interacting design dimensions: (1) what the agent sees, (2) how it reasons, and (3) how tasks are decomposed across components. Yet practitioners lack guidance on which design choices improve performance versus merely increase inference costs. We present a controlled study of compound LLM agent design in CybORG CAGE-2, a cyber defense environment modeled as a Partially Observable Markov Decision Process (POMDP). Reward is non-positive, so all configurations operate in a failure-mitigation mode and errors compound over time. Our evaluation spans five model families, six models, and twelve configurations (3,475 episodes) with token-level cost accounting. We systematically vary context representation (raw observations vs. a deterministic, programmatic environment state-tracking layer with compressed history), deliberation (self-questioning, self-critique, and self-improvement tools, with optional chain-of-thought prompting), and hierarchical decomposition (monolithic ReAct vs. delegation to specialized sub-agents). We find that: (1) Programmatic state abstraction delivers the largest returns per token spent (RPTS), improving mean return by up to 76% over raw observations. (2) Distributing deliberation tools across a hierarchy degrades performance relative to hierarchy alone for all five model families, reaching up to 3.4 × worse mean return while using 1.8-2.7 × more tokens. We call this destructive interaction pattern a deliberation cascade. (3) Hierarchical decomposition without deliberation tools achieves the best absolute performance for most models, and context engineering is generally more cost-effective than deliberation. These findings suggest a design principle for structured adversarial POMDPs: invest in programmatic infrastructure and clean task decomposition rather than deeper per-agent reasoning, as these strategies can interfere when combined.
Checked 2026-11-10 · 2 references not checked yet
Overview
AI snapshot
Written from the paper’s full text.
TL;DR
This paper is a controlled cost-performance study of compound LLM agent design in the adversarial POMDP CybORG CAGE-2, ablating context representation, deliberation, and hierarchy across six models and 3,475 episodes. It finds that deterministic programmatic context gives the largest gains per token, while distributing deliberation tools across a hierarchy causes a “deliberation cascade” that worsens returns and increases token use.
Key findings
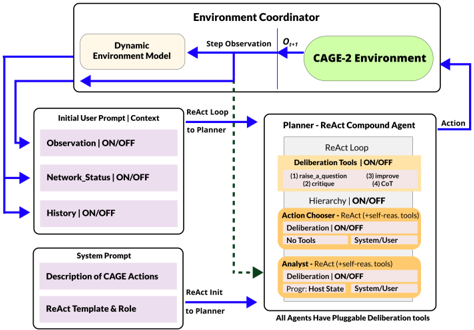
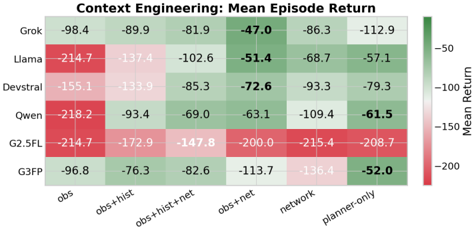
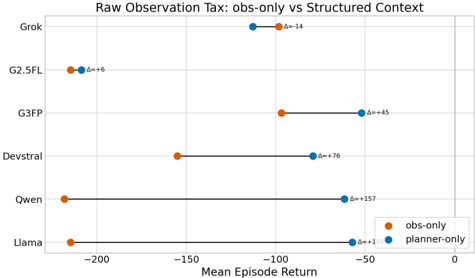
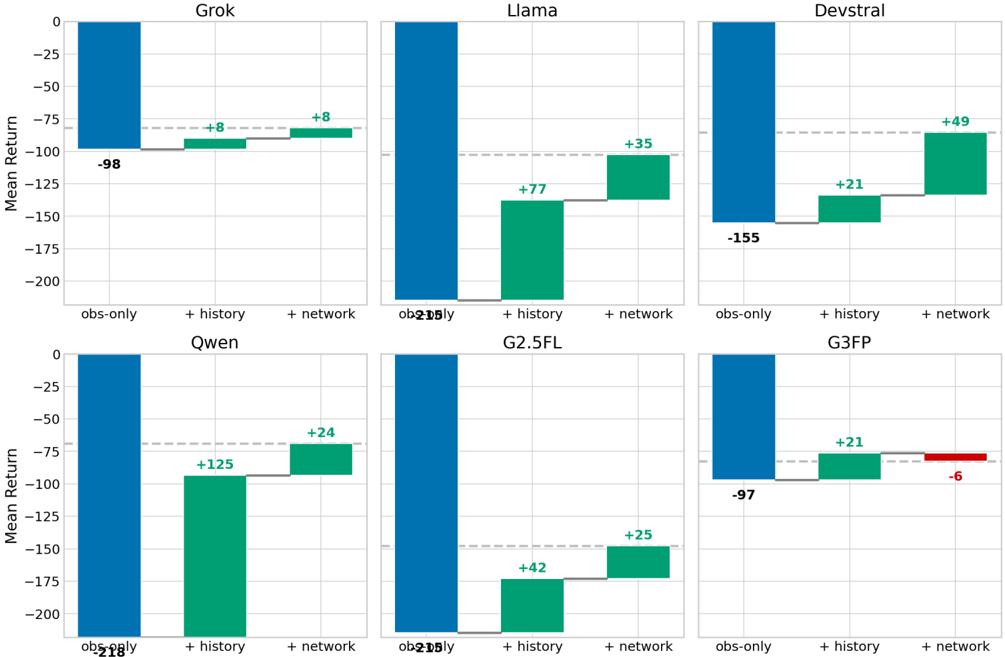
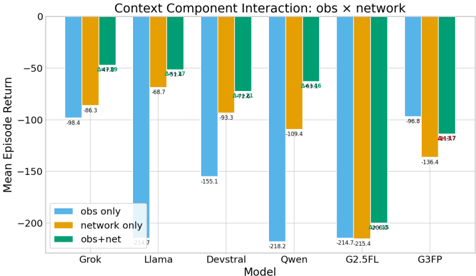
- Programmatic state abstraction delivers the largest returns per token spent (RPTS): adding a deterministic `{network_status}` layer to raw observations improves mean return by up to 76% (Llama: -214.7 → -51.4; Qwen by 71%; Devstral by 53%), and context configurations dominate the cost-performance frontier.
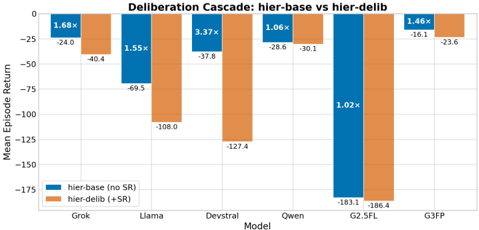
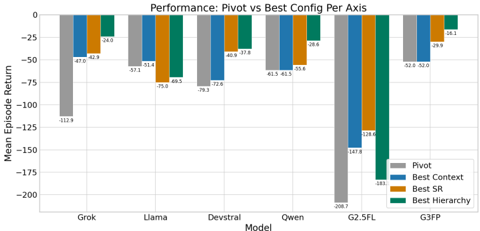
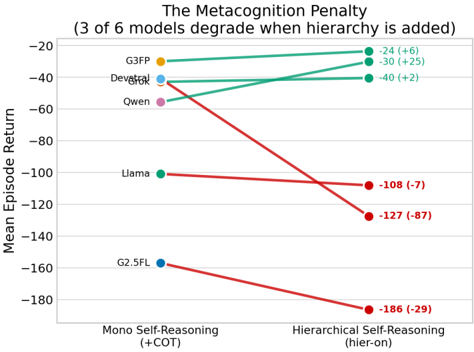
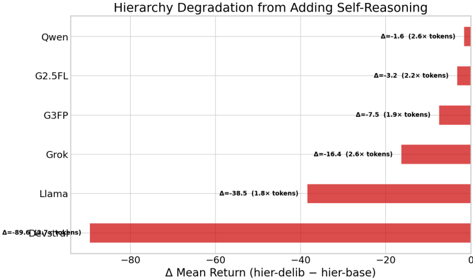
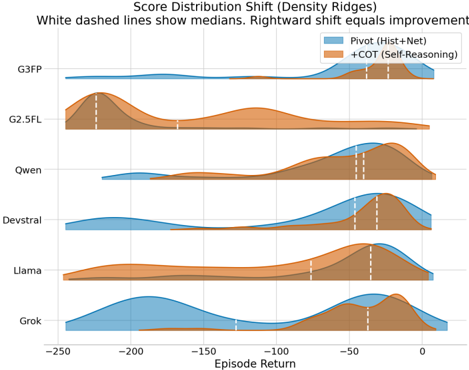
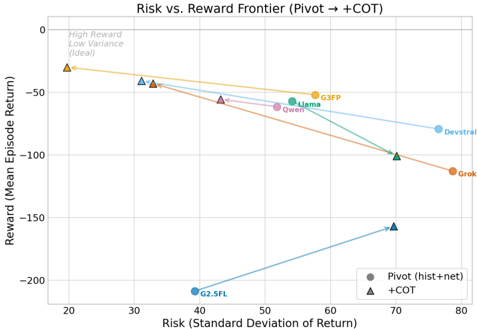
- Deliberation distributed across the hierarchy degrades performance for all six models relative to hierarchy alone, with up to 3.4× worse mean return (Devstral: -37.8 → -127.4) while using 1.8–2.7× more tokens; the authors call this a deliberation cascade.
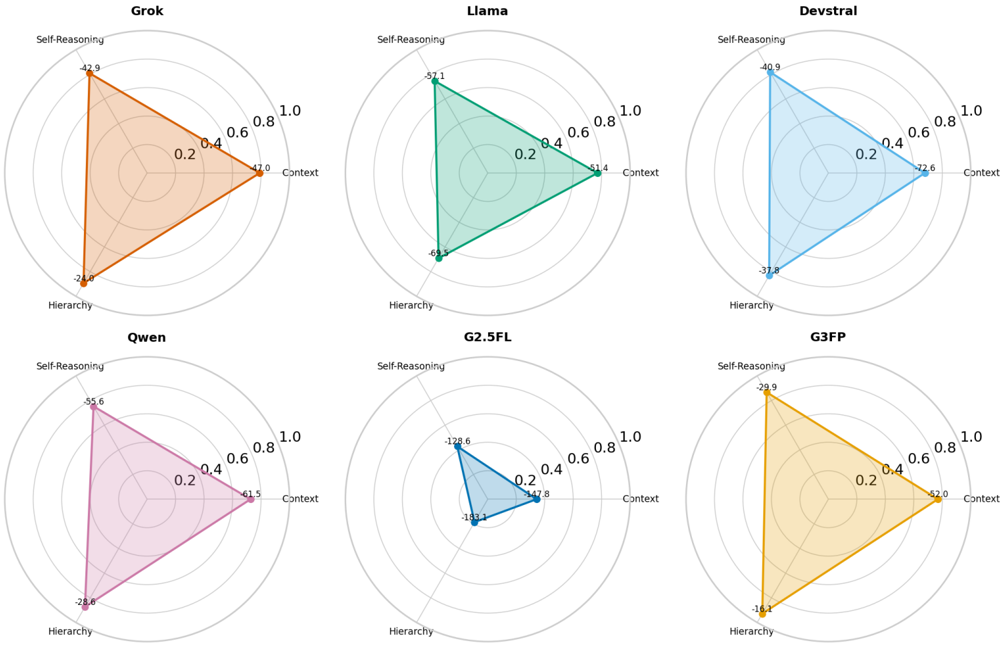
- Hierarchy without deliberation (`hier-base`) achieves the best or near-best absolute performance for four of six models (e.g., G3FP -16.1, Grok -24.0, Qwen -28.6), approaching the top published DRL result of -3.47, while monolithic deliberation is model-dependent and often costly.
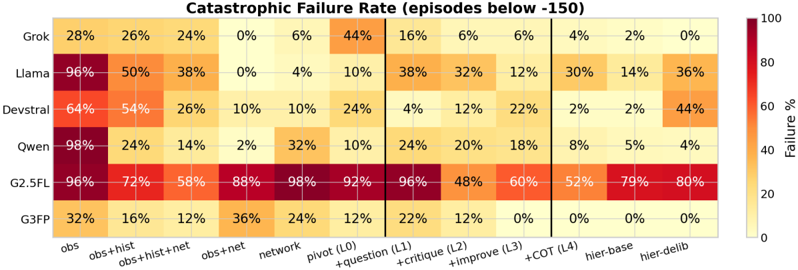
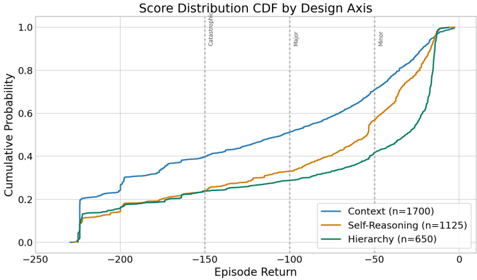
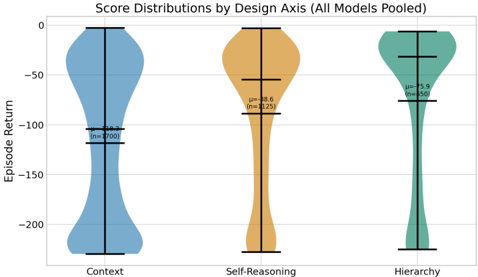
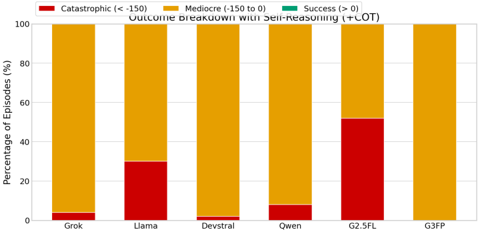
- Context engineering also compresses tail risk: catastrophic failure rates (return < -150) drop from >90% under raw observations to <10% in the strongest cases, whereas `hier-delib` increases variance (e.g., Devstral SD rises from 37 to 72 and catastrophic rate from 2% to 44%).
Methods
- Controlled three-axis ablation in CybORG CAGE-2, a 30-step adversarial POMDP with a 13-host network, scripted attacker kill chain, five defender actions, and non-positive rewards; configurations vary context (6 configs), deliberation (4 cumulative levels: question, critique, improve, COT), and hierarchy (2 configs: `hier-base`, `hier-delib`).
- Six models from five families (Grok, Llama, Devstral, Qwen, G2.5FL, G3FP) evaluated on all 12 configurations, yielding 72 model-configuration pairs, 3,475 episodes, and 283.9M tokens; standard allocation is 10 instances × 5 runs = 50 episodes per pair, with some reduced or extended batches.
- Main metrics are mean episode return (closer to zero better), total tokens per episode (prompt + completion), returns per token spent (RPTS), standard deviation, catastrophic failure rate (< -150), and per-model Pareto frontiers; all models use deterministic decoding (temperature 0) and identical prompts/tools.
Limitations
- The paper states claims are scoped to structured adversarial POMDPs where deterministic state abstraction is feasible; it uses a single environment (fixed topology, scripted adversary, 30-step horizon) and a single three-agent hierarchy, so alternative topologies may show different deliberation-cascade dynamics.
- The paper states token counts proxy cost but do not capture latency or pricing, knowledge-free prompts isolate architectural effects without fully disentangling pretrained priors, deliberation tools are tested only in cumulative activation order, and model selection spans mid-tier/efficiency-focused families rather than frontier-scale models.
- Evident from the text: G2.5FL fails catastrophically (>48%) across all configurations, suggesting a capability floor, and the authors note positive claims do not depend on it; episode allocations differ across models/configurations (e.g., G3FP uses 25 episodes, some configs use 75–100), though the paper says these differences do not affect qualitative conclusions.
Model-written summary. Check it against the paper before relying on it.
Integrity signals
Registry
Cites
Statistics
Figures
Verification
Claims the paper makes
84 Own result · 32 Own interpretation · 28 Sources not found · 22 Own method · 11 No basis given
A result the paper reports from its own data — it cites no other source for it, so there is none to check. The quote shows it is in the paper.
In the paper
“Hierarchical decomposition without deliberation tools achieves the best absolute performance for most models, and context engineering is generally more cost-effective than deliberation.”
- Also stated in: § 5.2.2 Hierarchy without deliberation wins. · plain
“The hier-base configuration (delegation only, no deliberation tools) achieves the best or near-best absolute performance for four of six models (G3FP at -16.1, Grok at -24.0, approaching the top published DRL result of -3.47 [2]; dark bars in Figure 3).”
§ Context, Reasoning, and Hierarchy: A Cost-Performance Study of Compound LLM Agent Design in an Adversarial POMDP > Abstract
plaindirect- Asserted: passes — The authors put it forward as true.
- Checkable: passes — It can be checked against evidence.
- Load-bearing: passes — The paper’s conclusions depend on it.
- Based: passes — The paper gives a reason why it holds.
- Also stated in: § 5.2.2 Hierarchy without deliberation wins. · plain
A result the paper reports from its own data — it cites no other source for it, so there is none to check. The quote shows it is in the paper.
In the paper
“Hierarchical decomposition without deliberation tools achieves the best absolute performance for most models, and context engineering is generally more cost-effective than deliberation.”
§ Context, Reasoning, and Hierarchy: A Cost-Performance Study of Compound LLM Agent Design in an Adversarial POMDP > Abstract
plaincorrelationaln = 5- Asserted: passes — The authors put it forward as true.
- Checkable: passes — It can be checked against evidence.
- Load-bearing: passes — The paper’s conclusions depend on it.
- Based: passes — The paper gives a reason why it holds.
A result the paper reports from its own data — it cites no other source for it, so there is none to check. The quote shows it is in the paper.
In the paper
“deterministic programmatic context yields large gains at near-zero marginal cost, whereas distributing deliberation across a hierarchy often degrades performance while inflating token consumption.”
§ Context, Reasoning, and Hierarchy: A Cost-Performance Study of Compound LLM Agent Design in an Adversarial POMDP > 1 Introduction
plaindirectn = 5- Asserted: passes — The authors put it forward as true.
- Checkable: passes — It can be checked against evidence.
- Load-bearing: passes — The paper’s conclusions depend on it.
- Based: passes — The paper gives a reason why it holds.
A result the paper reports from its own data — it cites no other source for it, so there is none to check. The quote shows it is in the paper.
In the paper
“When each agent independently runs a deliberation cycle (raise_a_question → critique → improve), each cycle independently converges on the conservative option: investigate further, deploy passive defenses, defer reactive intervention.”
§ Context, Reasoning, and Hierarchy: A Cost-Performance Study of Compound LLM Agent Design in an Adversarial POMDP > G Trajectory Examples
plaindirect- Asserted: passes — The authors put it forward as true.
- Checkable: passes — It can be checked against evidence.
- Load-bearing: passes — The paper’s conclusions depend on it.
- Based: passes — The paper gives a reason why it holds.
The paper states this without a source or data behind it here, so there is nothing to check it against. The quote shows it is in the paper.
In the paper
“The intersection of Axes 2 and 3 reveals the study's central failure mode: deliberation that helps monolithic agents can degrade hierarchical systems.”
§ Context, Reasoning, and Hierarchy: A Cost-Performance Study of Compound LLM Agent Design in an Adversarial POMDP > 5.2 Finding 2: Deliberation Destructively Interferes with Hierarchy
plaindirect- Asserted: passes — The authors put it forward as true.
- Checkable: passes — It can be checked against evidence.
- Load-bearing: passes — The paper’s conclusions depend on it.
- Based: passes — The paper gives a reason why it holds.
A result the paper reports from its own data — it cites no other source for it, so there is none to check. The quote shows it is in the paper.
In the paper
“The hier-delib system, having deployed passive defenses rather than containing active compromise, faces a -13.1/step penalty that persists for the remaining 16 steps.”
§ Context, Reasoning, and Hierarchy: A Cost-Performance Study of Compound LLM Agent Design in an Adversarial POMDP > Additional information
plaindirectSingle case- Asserted: passes — The authors put it forward as true.
- Checkable: passes — It can be checked against evidence.
- Load-bearing: unclear — It is unclear whether the paper’s conclusions depend on it.
- Based: passes — The paper gives a reason why it holds.
A result the paper reports from its own data — it cites no other source for it, so there is none to check. The quote shows it is in the paper.
In the paper
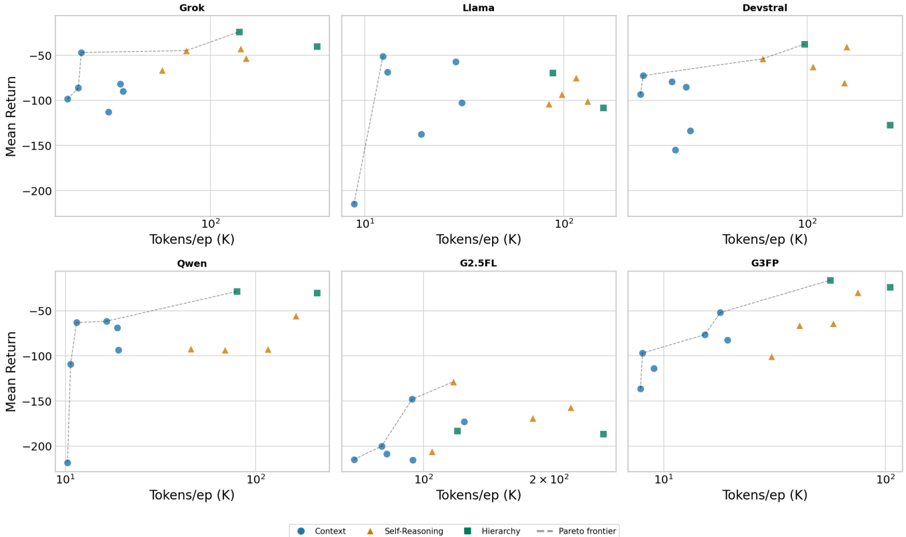
“Across per-model Pareto frontiers, at least one context configuration is efficient for every model, typically obs+net or hist+net.”
§ Context, Reasoning, and Hierarchy: A Cost-Performance Study of Compound LLM Agent Design in an Adversarial POMDP > 5.3 Finding 3: Context Engineering Dominates the Cost-Performance Frontier
plaincorrelational- Asserted: passes — The authors put it forward as true.
- Checkable: passes — It can be checked against evidence.
- Load-bearing: passes — The paper’s conclusions depend on it.
- Based: passes — The paper gives a reason why it holds.
The paper states this without a source or data behind it here, so there is nothing to check it against. The quote shows it is in the paper.
In the paper
“The deliberation and multi-agent literatures remain disconnected, and we show that combining them can introduce failure modes invisible to either in isolation.”
§ Context, Reasoning, and Hierarchy: A Cost-Performance Study of Compound LLM Agent Design in an Adversarial POMDP > 1 Introduction
plaindirect- Asserted: passes — The authors put it forward as true.
- Checkable: passes — It can be checked against evidence.
- Load-bearing: passes — The paper’s conclusions depend on it.
- Based: unclear — It is unclear why the paper says it holds.
A result the paper reports from its own data — it cites no other source for it, so there is none to check. The quote shows it is in the paper.
In the paper
“The hist+net anchor configuration (structured state + history, no raw obs) matches or beats the maximum-information obs+hist+net for four models (Llama, G3FP, Qwen, Devstral).”
§ Context, Reasoning, and Hierarchy: A Cost-Performance Study of Compound LLM Agent Design in an Adversarial POMDP > 5.1.3
plain- Asserted: passes — The authors put it forward as true.
- Checkable: passes — It can be checked against evidence.
- Load-bearing: passes — The paper’s conclusions depend on it.
- Based: passes — The paper gives a reason why it holds.
A result the paper reports from its own data — it cites no other source for it, so there is none to check. The quote shows it is in the paper.
In the paper
“Adding reasoning tools to the monolithic Planner produces model-dependent effects (Table 3, Axis 2).”
§ Context, Reasoning, and Hierarchy: A Cost-Performance Study of Compound LLM Agent Design in an Adversarial POMDP > 5.2.1 Monolithic deliberation is model-dependent.
plaindirect- Asserted: passes — The authors put it forward as true.
- Checkable: passes — It can be checked against evidence.
- Load-bearing: passes — The paper’s conclusions depend on it.
- Based: passes — The paper gives a reason why it holds.
- It may state two separate claims as one. 85
- The quote only partly states this claim. 7
- Probably not a substantial claim. 69
A result the paper reports from its own data — it cites no other source for it, so there is none to check. The quote shows it is in the paper.
In the paper
“Programmatic state abstraction delivers the largest returns per token spent (RPTS), improving mean return by up to 76% over raw observations.”
- Also stated in: § 5.1 Finding 1: Programmatic State Abstraction Delivers the Largest Gains Per Token · plain
“Context engineering ablations reveal that a deterministic layer compiling observations into structured summaries delivers the largest return on token investment.”
§ Context, Reasoning, and Hierarchy: A Cost-Performance Study of Compound LLM Agent Design in an Adversarial POMDP > Abstract
plaindirect- Asserted: passes — The authors put it forward as true.
- Checkable: passes — It can be checked against evidence.
- Load-bearing: passes — The paper’s conclusions depend on it.
- Based: passes — The paper gives a reason why it holds.
It may state two separate claims as one.
- Also stated in: § 5.1 Finding 1: Programmatic State Abstraction Delivers the Largest Gains Per Token · plain
A result the paper reports from its own data — it cites no other source for it, so there is none to check. The quote shows it is in the paper.
In the paper
“deterministic programmatic context yields large gains at near-zero marginal cost, whereas distributing deliberation across a hierarchy often degrades performance while inflating token consumption.”
§ Context, Reasoning, and Hierarchy: A Cost-Performance Study of Compound LLM Agent Design in an Adversarial POMDP > 1 Introduction
plaindirectn = 5- Asserted: passes — The authors put it forward as true.
- Checkable: passes — It can be checked against evidence.
- Load-bearing: passes — The paper’s conclusions depend on it.
- Based: passes — The paper gives a reason why it holds.
It may state two separate claims as one.
A result the paper reports from its own data — it cites no other source for it, so there is none to check. The quote shows it is in the paper.
In the paper
“Enabling deliberation tools on all hierarchical agents (hier-delib) decreases mean return relative to hier-base for all six models (Table 3, Figure 3).”
§ Context, Reasoning, and Hierarchy: A Cost-Performance Study of Compound LLM Agent Design in an Adversarial POMDP > 5.2.3 Deliberation cascade: the destructive interaction.
plaindirectn = 5- Asserted: passes — The authors put it forward as true.
- Checkable: passes — It can be checked against evidence.
- Load-bearing: passes — The paper’s conclusions depend on it.
- Based: passes — The paper gives a reason why it holds.
It may state two separate claims as one. The quote only partly states this claim.
A result the paper reports from its own data — it cites no other source for it, so there is none to check. The quote shows it is in the paper.
In the paper
“For most models, hier-base matches or exceeds the best monolithic deliberation at comparable cost, while hier-delib degrades it.”
§ Context, Reasoning, and Hierarchy: A Cost-Performance Study of Compound LLM Agent Design in an Adversarial POMDP > E Statistical Support
plaindirect- Asserted: passes — The authors put it forward as true.
- Checkable: passes — It can be checked against evidence.
- Load-bearing: passes — The paper’s conclusions depend on it.
- Based: passes — The paper gives a reason why it holds.
It may state two separate claims as one.
- The authors state this as an assumption: Token counts are a valid proxy for cost in comparing configurations.
A result the paper reports from its own data — it cites no other source for it, so there is none to check. The quote shows it is in the paper.
In the paper
“Qualitative effects (context helps, distributed deliberation hurts) are consistent across models, and magnitudes vary by 2-10×.”
§ Context, Reasoning, and Hierarchy: A Cost-Performance Study of Compound LLM Agent Design in an Adversarial POMDP > 5.4 Robustness, Variance, and Tail Risk
plaindirect- Asserted: passes — The authors put it forward as true.
- Checkable: passes — It can be checked against evidence.
- Load-bearing: passes — The paper’s conclusions depend on it.
- Based: passes — The paper gives a reason why it holds.
It may state two separate claims as one.
A result the paper reports from its own data — it cites no other source for it, so there is none to check. The quote shows it is in the paper.
In the paper
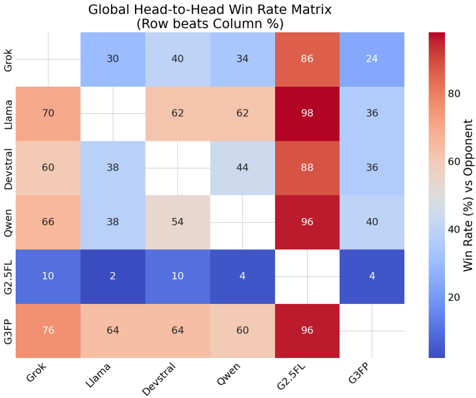
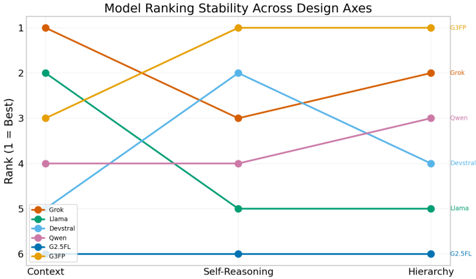
“Models exhibit distinct capability profiles: Grok and G3FP excel across axes, while G2.5FL is uniformly weak.”
§ Context, Reasoning, and Hierarchy: A Cost-Performance Study of Compound LLM Agent Design in an Adversarial POMDP > Contrast: Step 18 (hier-base).
plaincorrelational- Asserted: passes — The authors put it forward as true.
- Checkable: passes — It can be checked against evidence.
- Load-bearing: passes — The paper’s conclusions depend on it.
- Based: passes — The paper gives a reason why it holds.
It may state two separate claims as one.
A result the paper reports from its own data — it cites no other source for it, so there is none to check. The quote shows it is in the paper.
In the paper
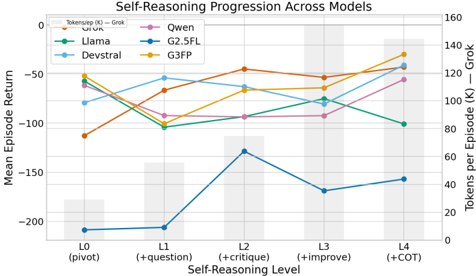
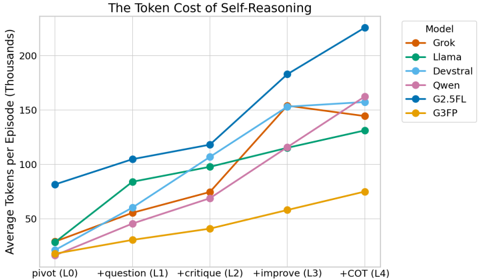
“Performance trajectory across cumulative deliberation levels for each model, showing non-monotonic patterns and model-dependent ceilings.”
§ Context, Reasoning, and Hierarchy: A Cost-Performance Study of Compound LLM Agent Design in an Adversarial POMDP > Contrast: Step 18 (hier-base).
plaincorrelational- Asserted: passes — The authors put it forward as true.
- Checkable: passes — It can be checked against evidence.
- Load-bearing: passes — The paper’s conclusions depend on it.
- Based: passes — The paper gives a reason why it holds.
It may state two separate claims as one.
A result the paper reports from its own data — it cites no other source for it, so there is none to check. The quote shows it is in the paper.
In the paper
“A cross-cutting finding reinforces these conclusions: qualitative effects hold across all six models, but magnitudes vary by 2-10× and some reverse sign (e.g., Llama is harmed by hierarchy), validating multi-model evaluation as essential for compound AI research.”
§ Context, Reasoning, and Hierarchy: A Cost-Performance Study of Compound LLM Agent Design in an Adversarial POMDP > 9 Conclusion
plaindirect- Asserted: passes — The authors put it forward as true.
- Checkable: passes — It can be checked against evidence.
- Load-bearing: passes — The paper’s conclusions depend on it.
- Based: passes — The paper gives a reason why it holds.
It may state two separate claims as one.
A result the paper reports from its own data — it cites no other source for it, so there is none to check. The quote shows it is in the paper.
In the paper
“However, patterns are non-monotonic, and stronger baselines (e.g., Llama on anchor configuration) can be destabilized by additional turns.”
§ Context, Reasoning, and Hierarchy: A Cost-Performance Study of Compound LLM Agent Design in an Adversarial POMDP > 5.2.1 Monolithic deliberation is model-dependent.
plaindirect- Asserted: passes — The authors put it forward as true.
- Checkable: passes — It can be checked against evidence.
- Load-bearing: passes — The paper’s conclusions depend on it.
- Based: passes — The paper gives a reason why it holds.
It may state two separate claims as one.
A result the paper reports from its own data — it cites no other source for it, so there is none to check. The quote shows it is in the paper.
In the paper
“Bounded hierarchy further tightens outcomes: G3FP under hier-base achieves SD = 3, and Grok's SD falls from 79 to 27.”
§ Context, Reasoning, and Hierarchy: A Cost-Performance Study of Compound LLM Agent Design in an Adversarial POMDP > 5.4 Robustness, Variance, and Tail Risk
plaindirect- Asserted: passes — The authors put it forward as true.
- Checkable: passes — It can be checked against evidence.
- Load-bearing: passes — The paper’s conclusions depend on it.
- Based: passes — The paper gives a reason why it holds.
It may state two separate claims as one.
A result the paper reports from its own data — it cites no other source for it, so there is none to check. The quote shows it is in the paper.
In the paper
“| Hierarchy | -72.9 -16.1 -186.4 | 162.4K |”
§ Context, Reasoning, and Hierarchy: A Cost-Performance Study of Compound LLM Agent Design in an Adversarial POMDP > Contrast: Step 18 (hier-base).
plain- Asserted: passes — The authors put it forward as true.
- Checkable: passes — It can be checked against evidence.
- Load-bearing: fails — The paper’s conclusions may not depend on it.
- Based: passes — The paper gives a reason why it holds.
Probably not a substantial claim. The paper’s conclusions may not depend on it. The quote only partly states this claim.
A result the paper reports from its own data — it cites no other source for it, so there is none to check. The quote shows it is in the paper.
In the paper
“Hierarchy often improves absolute return but is less token-efficient: hier-base consumes substantially more tokens than obs+net, yielding lower RPTS despite stronger mean return.”
§ Context, Reasoning, and Hierarchy: A Cost-Performance Study of Compound LLM Agent Design in an Adversarial POMDP > 5.3 Finding 3: Context Engineering Dominates the Cost-Performance Frontier
plaindirect- Asserted: passes — The authors put it forward as true.
- Checkable: passes — It can be checked against evidence.
- Load-bearing: passes — The paper’s conclusions depend on it.
- Based: passes — The paper gives a reason why it holds.
It may state two separate claims as one.
A result the paper reports from its own data — it cites no other source for it, so there is none to check. The quote shows it is in the paper.
In the paper
“G2.5FL fails catastrophically (> 48%) across all configurations, suggesting a capability floor for the structured I/O compliance the architecture requires; positive claims do not depend on G2.5FL.”
§ Context, Reasoning, and Hierarchy: A Cost-Performance Study of Compound LLM Agent Design in an Adversarial POMDP > 5.4 Robustness, Variance, and Tail Risk
hedgeddirect- Asserted: passes — The authors put it forward as true.
- Checkable: passes — It can be checked against evidence.
- Load-bearing: unclear — It is unclear whether the paper’s conclusions depend on it.
- Based: passes — The paper gives a reason why it holds.
It may state two separate claims as one.
The paper states this without a source or data behind it here, so there is nothing to check it against. The quote shows it is in the paper.
In the paper
“The observed Pareto ordering follows our engineering trajectory: (1) context is the most reliable lever; (2) bounded hierarchy sets the ceiling; (3) monolithic deliberation is capability-conditional; (4) distributed deliberation is dominated.”
§ Context, Reasoning, and Hierarchy: A Cost-Performance Study of Compound LLM Agent Design in an Adversarial POMDP > 6 Discussion
plaindirect- Asserted: passes — The authors put it forward as true.
- Checkable: passes — It can be checked against evidence.
- Load-bearing: passes — The paper’s conclusions depend on it.
- Based: passes — The paper gives a reason why it holds.
It may state two separate claims as one.
A result the paper reports from its own data — it cites no other source for it, so there is none to check. The quote shows it is in the paper.
In the paper
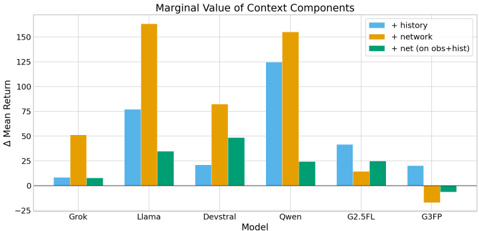
“Adding raw observations to a clean state summary often dilutes the signal; removing them improves Llama's return by 44% (compare the hist+net and obs+hist+net columns in Figure 2).”
§ Context, Reasoning, and Hierarchy: A Cost-Performance Study of Compound LLM Agent Design in an Adversarial POMDP > 5.1.3
plaindirectSingle case- Asserted: passes — The authors put it forward as true.
- Checkable: passes — It can be checked against evidence.
- Load-bearing: passes — The paper’s conclusions depend on it.
- Based: passes — The paper gives a reason why it holds.
It may state two separate claims as one.
A result the paper reports from its own data — it cites no other source for it, so there is none to check. The quote shows it is in the paper.
In the paper
“Devstral worsens by 3.37× (-37.8 → -127.4),Grok by 1.68×, and Llama by 1.55×, while token costs typically double (1.8-2.7×).”
§ Context, Reasoning, and Hierarchy: A Cost-Performance Study of Compound LLM Agent Design in an Adversarial POMDP > 5.2.3 Deliberation cascade: the destructive interaction.
plaindirect- Asserted: passes — The authors put it forward as true.
- Checkable: passes — It can be checked against evidence.
- Load-bearing: passes — The paper’s conclusions depend on it.
- Based: passes — The paper gives a reason why it holds.
It may state two separate claims as one.
A result the paper reports from its own data — it cites no other source for it, so there is none to check. The quote shows it is in the paper.
In the paper
“Moreover, for four of six models (Grok, Devstral, Qwen, G3FP), hier-base matches or outperforms the best monolithic deliberation at comparable or lower token cost, achieving through task decomposition what deliberation attempts through deeper reasoning.”
§ Context, Reasoning, and Hierarchy: A Cost-Performance Study of Compound LLM Agent Design in an Adversarial POMDP > 5.2.3 Deliberation cascade: the destructive interaction.
plaindirect- Asserted: passes — The authors put it forward as true.
- Checkable: passes — It can be checked against evidence.
- Load-bearing: passes — The paper’s conclusions depend on it.
- Based: passes — The paper gives a reason why it holds.
It may state two separate claims as one.
A result the paper reports from its own data — it cites no other source for it, so there is none to check. The quote shows it is in the paper.
In the paper
“Context engineering also compresses tail risk: catastrophic failure (return < -150, roughly the Random Agent level) drops from > 90% under obs to < 10% under obs+net or hist+net in the strongest cases (Figure 5), making it the most reliable lever for average and worst case.”
§ Context, Reasoning, and Hierarchy: A Cost-Performance Study of Compound LLM Agent Design in an Adversarial POMDP > 6 Discussion
plaindirect- Asserted: passes — The authors put it forward as true.
- Checkable: passes — It can be checked against evidence.
- Load-bearing: passes — The paper’s conclusions depend on it.
- Based: passes — The paper gives a reason why it holds.
It may state two separate claims as one.
A result the paper reports from its own data — it cites no other source for it, so there is none to check. The quote shows it is in the paper.
In the paper
“Context engineering compresses both mean and variance.”
§ Context, Reasoning, and Hierarchy: A Cost-Performance Study of Compound LLM Agent Design in an Adversarial POMDP > 5.4 Robustness, Variance, and Tail Risk
plaindirect- Asserted: passes — The authors put it forward as true.
- Checkable: passes — It can be checked against evidence.
- Load-bearing: passes — The paper’s conclusions depend on it.
- Based: passes — The paper gives a reason why it holds.
It may state two separate claims as one.
A result the paper reports from its own data — it cites no other source for it, so there is none to check. The quote shows it is in the paper.
In the paper
“When network status is already available, adding history (obs+net vs. obs+hist+net) hurts four of six models (Table 3), suggesting that {network_status} already encodes much of the decision-relevant temporal signal.”
§ Context, Reasoning, and Hierarchy: A Cost-Performance Study of Compound LLM Agent Design in an Adversarial POMDP > 5.1.4 History provides complementary temporal context.
hedgeddirect- Asserted: passes — The authors put it forward as true.
- Checkable: passes — It can be checked against evidence.
- Load-bearing: passes — The paper’s conclusions depend on it.
- Based: passes — The paper gives a reason why it holds.
It may state two separate claims as one.
A result the paper reports from its own data — it cites no other source for it, so there is none to check. The quote shows it is in the paper.
In the paper
“It does not execute its first (and only) Restore until step 25.”
§ Context, Reasoning, and Hierarchy: A Cost-Performance Study of Compound LLM Agent Design in an Adversarial POMDP > Additional information
plainSingle case- Asserted: passes — The authors put it forward as true.
- Checkable: passes — It can be checked against evidence.
- Load-bearing: fails — The paper’s conclusions may not depend on it.
- Based: passes — The paper gives a reason why it holds.
Probably not a substantial claim. The paper’s conclusions may not depend on it.
A result the paper reports from its own data — it cites no other source for it, so there is none to check. The quote shows it is in the paper.
In the paper
“By step 14, the hier-base system has executed 5 Restore and 3 Remove actions; the hier-delib system has executed 0 Restore, 0 Remove, and 8 Decoy deployments.”
§ Context, Reasoning, and Hierarchy: A Cost-Performance Study of Compound LLM Agent Design in an Adversarial POMDP > Additional information
plainSingle case- Asserted: passes — The authors put it forward as true.
- Checkable: passes — It can be checked against evidence.
- Load-bearing: passes — The paper’s conclusions depend on it.
- Based: passes — The paper gives a reason why it holds.
It may state two separate claims as one.
A result the paper reports from its own data — it cites no other source for it, so there is none to check. The quote shows it is in the paper.
In the paper
“| Hierarchy | -72.9 -16.1 -186.4 | 162.4K |”
§ Context, Reasoning, and Hierarchy: A Cost-Performance Study of Compound LLM Agent Design in an Adversarial POMDP > Contrast: Step 18 (hier-base).
plaincorrelational- Asserted: passes — The authors put it forward as true.
- Checkable: passes — It can be checked against evidence.
- Load-bearing: unclear — It is unclear whether the paper’s conclusions depend on it.
- Based: passes — The paper gives a reason why it holds.
The quote only partly states this claim.
A result the paper reports from its own data — it cites no other source for it, so there is none to check. The quote shows it is in the paper.
In the paper
“The hier-base episode achieves a return of -13.3 (near-optimal defense); the hier-delib episode achieves -211.2 (near-total network loss), a 15.9× degradation on the same environment instance.”
§ Context, Reasoning, and Hierarchy: A Cost-Performance Study of Compound LLM Agent Design in an Adversarial POMDP > G Trajectory Examples
plaindirectSingle case- Asserted: passes — The authors put it forward as true.
- Checkable: passes — It can be checked against evidence.
- Load-bearing: passes — The paper’s conclusions depend on it.
- Based: passes — The paper gives a reason why it holds.
It may state two separate claims as one.
A result the paper reports from its own data — it cites no other source for it, so there is none to check. The quote shows it is in the paper.
In the paper
“hier-delib remains high-cost and low-efficiency relative to hier-base.”
§ Context, Reasoning, and Hierarchy: A Cost-Performance Study of Compound LLM Agent Design in an Adversarial POMDP > 5.3 Finding 3: Context Engineering Dominates the Cost-Performance Frontier
plaincorrelational- Asserted: passes — The authors put it forward as true.
- Checkable: passes — It can be checked against evidence.
- Load-bearing: passes — The paper’s conclusions depend on it.
- Based: passes — The paper gives a reason why it holds.
It may state two separate claims as one.
A result the paper reports from its own data — it cites no other source for it, so there is none to check. The quote shows it is in the paper.
In the paper
“Llama improves by 76% (-214.7 → -51.4),Qwen by 71%, and Devstral by 53% (Table 3).”
§ Context, Reasoning, and Hierarchy: A Cost-Performance Study of Compound LLM Agent Design in an Adversarial POMDP > 5.1.2 Programmatic backbone enables raw data utility.
plaindirect- Asserted: passes — The authors put it forward as true.
- Checkable: passes — It can be checked against evidence.
- Load-bearing: passes — The paper’s conclusions depend on it.
- Based: passes — The paper gives a reason why it holds.
It may state two separate claims as one.
A result the paper reports from its own data — it cites no other source for it, so there is none to check. The quote shows it is in the paper.
In the paper
“| Anchor (net+hist) | -95.2 -52.0 -208.7 | 32.5K |”
§ Context, Reasoning, and Hierarchy: A Cost-Performance Study of Compound LLM Agent Design in an Adversarial POMDP > Contrast: Step 18 (hier-base).
plain- Asserted: passes — The authors put it forward as true.
- Checkable: passes — It can be checked against evidence.
- Load-bearing: fails — The paper’s conclusions may not depend on it.
- Based: passes — The paper gives a reason why it holds.
Probably not a substantial claim. The paper’s conclusions may not depend on it.
A result the paper reports from its own data — it cites no other source for it, so there is none to check. The quote shows it is in the paper.
In the paper
“Conversely, hier-delib increases variance: Devstral's SD rises from 37 to 72 and its catastrophic rate jumps from 2% to 44%, consistent with the deliberation cascade.”
§ Context, Reasoning, and Hierarchy: A Cost-Performance Study of Compound LLM Agent Design in an Adversarial POMDP > 5.4 Robustness, Variance, and Tail Risk
plaindirectSingle case- Asserted: passes — The authors put it forward as true.
- Checkable: passes — It can be checked against evidence.
- Load-bearing: passes — The paper’s conclusions depend on it.
- Based: passes — The paper gives a reason why it holds.
It may state two separate claims as one.
A result the paper reports from its own data — it cites no other source for it, so there is none to check. The quote shows it is in the paper.
In the paper
“| Context | -113.9 -47.0 -218.2 | 30.6K |”
§ Context, Reasoning, and Hierarchy: A Cost-Performance Study of Compound LLM Agent Design in an Adversarial POMDP > Contrast: Step 18 (hier-base).
plain- Asserted: passes — The authors put it forward as true.
- Checkable: passes — It can be checked against evidence.
- Load-bearing: fails — The paper’s conclusions may not depend on it.
- Based: passes — The paper gives a reason why it holds.
Probably not a substantial claim. The paper’s conclusions may not depend on it.
A result the paper reports from its own data — it cites no other source for it, so there is none to check. The quote shows it is in the paper.
In the paper
“| Qwen | hier-base | -28.6 obs | -218.2 189.6 |”
§ Context, Reasoning, and Hierarchy: A Cost-Performance Study of Compound LLM Agent Design in an Adversarial POMDP > Contrast: Step 18 (hier-base).
plain- Asserted: passes — The authors put it forward as true.
- Checkable: passes — It can be checked against evidence.
- Load-bearing: unclear — It is unclear whether the paper’s conclusions depend on it.
- Based: passes — The paper gives a reason why it holds.
It may state two separate claims as one.
A result the paper reports from its own data — it cites no other source for it, so there is none to check. The quote shows it is in the paper.
In the paper
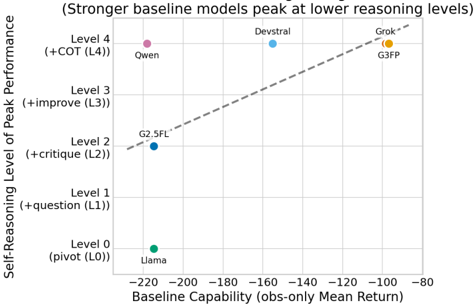
“Explicit chain-of-thought (+COT) is the best deliberation level for four models (Grok, Devstral, Qwen, G3FP), often improving on the anchor configuration.”
§ Context, Reasoning, and Hierarchy: A Cost-Performance Study of Compound LLM Agent Design in an Adversarial POMDP > 5.2.1 Monolithic deliberation is model-dependent.
plaindirect- Asserted: passes — The authors put it forward as true.
- Checkable: passes — It can be checked against evidence.
- Load-bearing: passes — The paper’s conclusions depend on it.
- Based: passes — The paper gives a reason why it holds.
It may state two separate claims as one.
A result the paper reports from its own data — it cites no other source for it, so there is none to check. The quote shows it is in the paper.
In the paper
“| Deliberation | -86.4 -29.9 -206.2 | 106.8K |”
§ Context, Reasoning, and Hierarchy: A Cost-Performance Study of Compound LLM Agent Design in an Adversarial POMDP > Contrast: Step 18 (hier-base).
plain- Asserted: passes — The authors put it forward as true.
- Checkable: passes — It can be checked against evidence.
- Load-bearing: fails — The paper’s conclusions may not depend on it.
- Based: passes — The paper gives a reason why it holds.
Probably not a substantial claim. The paper’s conclusions may not depend on it.
A result the paper reports from its own data — it cites no other source for it, so there is none to check. The quote shows it is in the paper.
In the paper
“First (RQ1), context engineering dominates: deterministic programmatic state abstraction yields the largest and most consistent gains per token, while raw observations alone are destabilizing.”
- Also stated in: § Contrast: Step 18 (hier-base). · plain
“The obs+net and hist+net(Planner-Only) columns are consistently strong across models, while obs alone is typically poor.”
- Also stated in: § Contrast: Step 18 (hier-base). · plain
“Adding {network_status} to raw observation delivers the largest consistent gains.”
§ Context, Reasoning, and Hierarchy: A Cost-Performance Study of Compound LLM Agent Design in an Adversarial POMDP > 9 Conclusion
plaindirectn = 5- Asserted: passes — The authors put it forward as true.
- Checkable: passes — It can be checked against evidence.
- Load-bearing: passes — The paper’s conclusions depend on it.
- Based: passes — The paper gives a reason why it holds.
It may state two separate claims as one.
- The authors state this as an assumption: Token counts are a valid proxy for cost in comparing configurations.
- The authors state this as an assumption: Knowledge-free prompts isolate architectural effects from pretrained priors.
- Also stated in: § Contrast: Step 18 (hier-base). · plain
A result the paper reports from its own data — it cites no other source for it, so there is none to check. The quote shows it is in the paper.
In the paper
“Deliberation configurations reach the frontier for only a minority of models and are often dominated by context or hierarchy.”
§ Context, Reasoning, and Hierarchy: A Cost-Performance Study of Compound LLM Agent Design in an Adversarial POMDP > 5.3 Finding 3: Context Engineering Dominates the Cost-Performance Frontier
plaincorrelational- Asserted: passes — The authors put it forward as true.
- Checkable: passes — It can be checked against evidence.
- Load-bearing: passes — The paper’s conclusions depend on it.
- Based: passes — The paper gives a reason why it holds.
It may state two separate claims as one.
A result the paper reports from its own data — it cites no other source for it, so there is none to check. The quote shows it is in the paper.
In the paper
“Llama, Qwen, and G2.5FL fall below -214 mean return, approaching the Sleeping (no-op) agent (-219), with catastrophic failure rates (< -150) reaching 96-98% (Figure 5).”
§ Context, Reasoning, and Hierarchy: A Cost-Performance Study of Compound LLM Agent Design in an Adversarial POMDP > 5.1.1 Raw observation alone is ineffective.
plaincorrelational- Asserted: passes — The authors put it forward as true.
- Checkable: passes — It can be checked against evidence.
- Load-bearing: passes — The paper’s conclusions depend on it.
- Based: passes — The paper gives a reason why it holds.
It may state two separate claims as one.
A result the paper reports from its own data — it cites no other source for it, so there is none to check. The quote shows it is in the paper.
In the paper
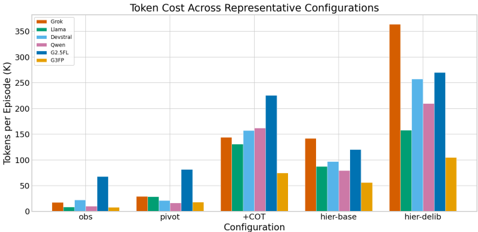
“The degradation under hier-delib is not attributable to token overhead per se: hier-base consumes comparable tokens to monolithic +COT (e.g., Grok: 141.9K vs. 144.5K)yet achieves substantially better returns (-24.0 vs. -42.9),confirming the loss is structural.”
§ Context, Reasoning, and Hierarchy: A Cost-Performance Study of Compound LLM Agent Design in an Adversarial POMDP > 5.2.3 Deliberation cascade: the destructive interaction.
boosteddirectSingle case- Asserted: passes — The authors put it forward as true.
- Checkable: passes — It can be checked against evidence.
- Load-bearing: passes — The paper’s conclusions depend on it.
- Based: passes — The paper gives a reason why it holds.
It may state two separate claims as one.
A result the paper reports from its own data — it cites no other source for it, so there is none to check. The quote shows it is in the paper.
In the paper
“Effect directions (context helps, distributed deliberation hurts) hold across models, but magnitudes vary by 2-10× and some effects flip (e.g., Llama harmed by hierarchy).”
§ Context, Reasoning, and Hierarchy: A Cost-Performance Study of Compound LLM Agent Design in an Adversarial POMDP > 6 Discussion
plaindirect- Asserted: passes — The authors put it forward as true.
- Checkable: passes — It can be checked against evidence.
- Load-bearing: passes — The paper’s conclusions depend on it.
- Based: passes — The paper gives a reason why it holds.
It may state two separate claims as one.
A result the paper reports from its own data — it cites no other source for it, so there is none to check. The quote shows it is in the paper.
In the paper
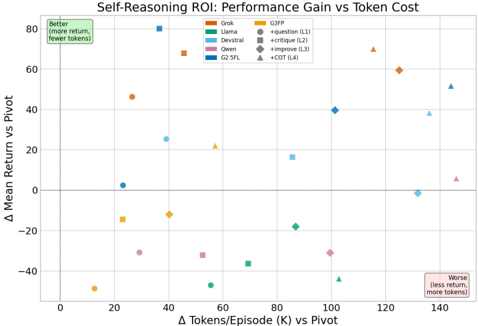
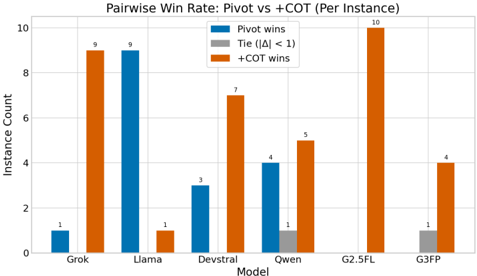
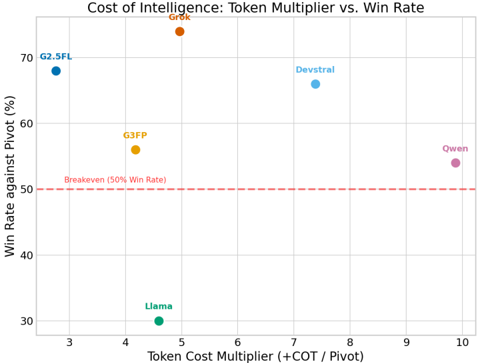
“Figure 29 plots the token-cost multiplier of +COT against its per-instance win rate over the anchor: models where +COT achieves high win rates (Grok, G2.5FL) pay 4-5× more tokens, while models where +COT is harmful (Llama) pay a similar multiplier for worse outcomes.”
§ Context, Reasoning, and Hierarchy: A Cost-Performance Study of Compound LLM Agent Design in an Adversarial POMDP > F Token Consumption
plaincorrelational- Asserted: passes — The authors put it forward as true.
- Checkable: passes — It can be checked against evidence.
- Load-bearing: passes — The paper’s conclusions depend on it.
- Based: passes — The paper gives a reason why it holds.
It may state two separate claims as one.
- The authors state this as an assumption: Token counts are a valid proxy for cost in comparing configurations.
A result the paper reports from its own data — it cites no other source for it, so there is none to check. The quote shows it is in the paper.
In the paper
“Third (RQ3), deliberation is not modular: distributing deliberation tools across a hierarchy (hier-delib) produces a deliberation cascade that degrades returns while increasing token expenditure.”
- Also stated in: § Contrast: Step 18 (hier-base). · plain
“Mean return decreases for all six models.”
§ Context, Reasoning, and Hierarchy: A Cost-Performance Study of Compound LLM Agent Design in an Adversarial POMDP > 9 Conclusion
plaindirect- Asserted: passes — The authors put it forward as true.
- Checkable: passes — It can be checked against evidence.
- Load-bearing: passes — The paper’s conclusions depend on it.
- Based: passes — The paper gives a reason why it holds.
It may state two separate claims as one.
- The authors state this as an assumption: Token counts are a valid proxy for cost in comparing configurations.
- The authors state this as an assumption: Knowledge-free prompts isolate architectural effects from pretrained priors.
- The authors state this as an assumption: The cumulative activation order of deliberation tools is a valid representation of deliberation depth.
- Also stated in: § Contrast: Step 18 (hier-base). · plain
A result the paper reports from its own data — it cites no other source for it, so there is none to check. The quote shows it is in the paper.
In the paper
“| Devstral hier-base | -37.8 obs | -155.1 117.3 |”
§ Context, Reasoning, and Hierarchy: A Cost-Performance Study of Compound LLM Agent Design in an Adversarial POMDP > Contrast: Step 18 (hier-base).
plain- Asserted: passes — The authors put it forward as true.
- Checkable: passes — It can be checked against evidence.
- Load-bearing: unclear — It is unclear whether the paper’s conclusions depend on it.
- Based: passes — The paper gives a reason why it holds.
It may state two separate claims as one.
A result the paper reports from its own data — it cites no other source for it, so there is none to check. The quote shows it is in the paper.
In the paper
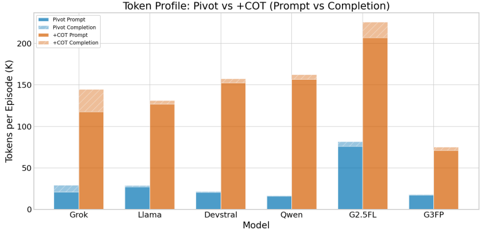
“Deliberation dramatically increases prompt tokens (due to multi-turn tool-call exchanges) and moderately increases completion tokens.”
§ Context, Reasoning, and Hierarchy: A Cost-Performance Study of Compound LLM Agent Design in an Adversarial POMDP > F Token Consumption
plaindirect- Asserted: passes — The authors put it forward as true.
- Checkable: passes — It can be checked against evidence.
- Load-bearing: passes — The paper’s conclusions depend on it.
- Based: passes — The paper gives a reason why it holds.
It may state two separate claims as one.
- The authors state this as an assumption: Token counts are a valid proxy for cost in comparing configurations.
A result the paper reports from its own data — it cites no other source for it, so there is none to check. The quote shows it is in the paper.
In the paper
“At step 18, the network has been losing -13.1 reward per step since step 15 (Op_Server0 is compromised).”
§ Context, Reasoning, and Hierarchy: A Cost-Performance Study of Compound LLM Agent Design in an Adversarial POMDP > G Trajectory Examples
plaindirectSingle case- Asserted: passes — The authors put it forward as true.
- Checkable: passes — It can be checked against evidence.
- Load-bearing: fails — The paper’s conclusions may not depend on it.
- Based: passes — The paper gives a reason why it holds.
Probably not a substantial claim. The paper’s conclusions may not depend on it.
A result the paper reports from its own data — it cites no other source for it, so there is none to check. The quote shows it is in the paper.
In the paper
“| Llama | obs+net | -51.4 obs | -214.7 163.3 |”
§ Context, Reasoning, and Hierarchy: A Cost-Performance Study of Compound LLM Agent Design in an Adversarial POMDP > Contrast: Step 18 (hier-base).
plain- Asserted: passes — The authors put it forward as true.
- Checkable: passes — It can be checked against evidence.
- Load-bearing: unclear — It is unclear whether the paper’s conclusions depend on it.
- Based: passes — The paper gives a reason why it holds.
It may state two separate claims as one.
A result the paper reports from its own data — it cites no other source for it, so there is none to check. The quote shows it is in the paper.
In the paper
“We show that while qualitative effects (context helps, distributed reasoning hurts) are robust, quantitative magnitudes vary, validating multi-model evaluation as essential for compound AI design.”
§ Context, Reasoning, and Hierarchy: A Cost-Performance Study of Compound LLM Agent Design in an Adversarial POMDP > 1 Introduction
plaincorrelationaln = 5- Asserted: passes — The authors put it forward as true.
- Checkable: passes — It can be checked against evidence.
- Load-bearing: passes — The paper’s conclusions depend on it.
- Based: passes — The paper gives a reason why it holds.
It may state two separate claims as one.
A result the paper reports from its own data — it cites no other source for it, so there is none to check. The quote shows it is in the paper.
In the paper
“We demonstrate that enabling deliberation tools across a hierarchy degrades performance in all six models (up to 3.4× worse return) while doubling token costs, producing cascading uncertainty.”
§ Context, Reasoning, and Hierarchy: A Cost-Performance Study of Compound LLM Agent Design in an Adversarial POMDP > 1 Introduction
boosteddirect- Asserted: passes — The authors put it forward as true.
- Checkable: passes — It can be checked against evidence.
- Load-bearing: passes — The paper’s conclusions depend on it.
- Based: passes — The paper gives a reason why it holds.
It may state two separate claims as one.
A result the paper reports from its own data — it cites no other source for it, so there is none to check. The quote shows it is in the paper.
In the paper
“Adding compressed action history to raw observations (obs→obs+hist) improves all six models, with Llama gaining 36% and Qwen 57% (Table 3).”
§ Context, Reasoning, and Hierarchy: A Cost-Performance Study of Compound LLM Agent Design in an Adversarial POMDP > 5.1.4 History provides complementary temporal context.
plaindirect- Asserted: passes — The authors put it forward as true.
- Checkable: passes — It can be checked against evidence.
- Load-bearing: passes — The paper’s conclusions depend on it.
- Based: passes — The paper gives a reason why it holds.
It may state two separate claims as one.
A result the paper reports from its own data — it cites no other source for it, so there is none to check. The quote shows it is in the paper.
In the paper
“Hierarchy provides limited or negative value for two models.Llama worsens under hierarchy (-57.1 → -69.5, 22%) with SD remaining high at 60. G2.5FL improves only marginally (12%; -208.7 → -183.1).”
§ Context, Reasoning, and Hierarchy: A Cost-Performance Study of Compound LLM Agent Design in an Adversarial POMDP > 5.4 Robustness, Variance, and Tail Risk
plaindirect- Asserted: passes — The authors put it forward as true.
- Checkable: passes — It can be checked against evidence.
- Load-bearing: passes — The paper’s conclusions depend on it.
- Based: passes — The paper gives a reason why it holds.
It may state two separate claims as one.
A result the paper reports from its own data — it cites no other source for it, so there is none to check. The quote shows it is in the paper.
In the paper
“We contribute an orthogonal, controlled ablation of context composition (raw vs. structured) in a POMDP, showing that deterministic state abstraction outperforms raw observations at near-zero marginal cost.”
§ Context, Reasoning, and Hierarchy: A Cost-Performance Study of Compound LLM Agent Design in an Adversarial POMDP > Context Engineering.
boosteddirect- Asserted: passes — The authors put it forward as true.
- Checkable: passes — It can be checked against evidence.
- Load-bearing: passes — The paper’s conclusions depend on it.
- Based: passes — The paper gives a reason why it holds.
It may state two separate claims as one.
A result the paper reports from its own data — it cites no other source for it, so there is none to check. The quote shows it is in the paper.
In the paper
“| Grok | hier-base | -24.0 hist+net | -112.9 | 88.8 |”
§ Context, Reasoning, and Hierarchy: A Cost-Performance Study of Compound LLM Agent Design in an Adversarial POMDP > Contrast: Step 18 (hier-base).
plain- Asserted: passes — The authors put it forward as true.
- Checkable: passes — It can be checked against evidence.
- Load-bearing: unclear — It is unclear whether the paper’s conclusions depend on it.
- Based: passes — The paper gives a reason why it holds.
It may state two separate claims as one.
A result the paper reports from its own data — it cites no other source for it, so there is none to check. The quote shows it is in the paper.
In the paper
“| G2.5FL | +critique | -128.6 network | -215.4 | 86.8 |”
§ Context, Reasoning, and Hierarchy: A Cost-Performance Study of Compound LLM Agent Design in an Adversarial POMDP > Contrast: Step 18 (hier-base).
plain- Asserted: passes — The authors put it forward as true.
- Checkable: passes — It can be checked against evidence.
- Load-bearing: unclear — It is unclear whether the paper’s conclusions depend on it.
- Based: passes — The paper gives a reason why it holds.
It may state two separate claims as one.
A result the paper reports from its own data — it cites no other source for it, so there is none to check. The quote shows it is in the paper.
In the paper
“hier-base sets the high-performance frontier where hierarchy helps, while hier-delib is consistently dominated by hier-base, combining higher token cost with worse mean return.”
§ Context, Reasoning, and Hierarchy: A Cost-Performance Study of Compound LLM Agent Design in an Adversarial POMDP > 5.3 Finding 3: Context Engineering Dominates the Cost-Performance Frontier
plaindirect- Asserted: passes — The authors put it forward as true.
- Checkable: passes — It can be checked against evidence.
- Load-bearing: passes — The paper’s conclusions depend on it.
- Based: passes — The paper gives a reason why it holds.
It may state two separate claims as one.
A result the paper reports from its own data — it cites no other source for it, so there is none to check. The quote shows it is in the paper.
In the paper
“| G3FP | hier-base | -16.1 network | -136.4 120.3 |”
§ Context, Reasoning, and Hierarchy: A Cost-Performance Study of Compound LLM Agent Design in an Adversarial POMDP > Contrast: Step 18 (hier-base).
plain- Asserted: passes — The authors put it forward as true.
- Checkable: passes — It can be checked against evidence.
- Load-bearing: unclear — It is unclear whether the paper’s conclusions depend on it.
- Based: passes — The paper gives a reason why it holds.
It may state two separate claims as one.
A result the paper reports from its own data — it cites no other source for it, so there is none to check. The quote shows it is in the paper.
In the paper
“The effect directions (Principles 1-3) replicate across six models from five families, making them directional starting points rather than hard prescriptions; specific magnitudes are tied to CAGE-2 and the models tested.”
§ Context, Reasoning, and Hierarchy: A Cost-Performance Study of Compound LLM Agent Design in an Adversarial POMDP > 6 Discussion
plaincorrelationaln = 6- Asserted: passes — The authors put it forward as true.
- Checkable: passes — It can be checked against evidence.
- Load-bearing: passes — The paper’s conclusions depend on it.
- Based: passes — The paper gives a reason why it holds.
It may state two separate claims as one.
A result the paper reports from its own data — it cites no other source for it, so there is none to check. The quote shows it is in the paper.
In the paper
“Context configurations dominate: obs+net achieves the highest RPTS for Grok, Llama, Devstral, and Qwen, while hist+net leads for G3FP.”
§ Context, Reasoning, and Hierarchy: A Cost-Performance Study of Compound LLM Agent Design in an Adversarial POMDP > 5.3 Finding 3: Context Engineering Dominates the Cost-Performance Frontier
plaincorrelational- Asserted: passes — The authors put it forward as true.
- Checkable: passes — It can be checked against evidence.
- Load-bearing: passes — The paper’s conclusions depend on it.
- Based: passes — The paper gives a reason why it holds.
It may state two separate claims as one.
A result the paper reports from its own data — it cites no other source for it, so there is none to check. The quote shows it is in the paper.
In the paper
“While bounded hierarchy often achieves the best absolute return, context engineering delivers the best returns per token, making it the most cost-effective first investment.”
§ Context, Reasoning, and Hierarchy: A Cost-Performance Study of Compound LLM Agent Design in an Adversarial POMDP > 1 Introduction
plaindirectn = 5- Asserted: passes — The authors put it forward as true.
- Checkable: passes — It can be checked against evidence.
- Load-bearing: passes — The paper’s conclusions depend on it.
- Based: passes — The paper gives a reason why it holds.
It may state two separate claims as one.
The paper states this without a source or data behind it here, so there is nothing to check it against. The quote shows it is in the paper.
In the paper
“G2.5FL is the exception, with +critique performing best, consistent with its difficulty exploiting structured context.”
§ Context, Reasoning, and Hierarchy: A Cost-Performance Study of Compound LLM Agent Design in an Adversarial POMDP > 5.3 Finding 3: Context Engineering Dominates the Cost-Performance Frontier
plaindirectSingle case- Asserted: passes — The authors put it forward as true.
- Checkable: passes — It can be checked against evidence.
- Load-bearing: passes — The paper’s conclusions depend on it.
- Based: passes — The paper gives a reason why it holds.
It may state two separate claims as one.
A result the paper reports from its own data — it cites no other source for it, so there is none to check. The quote shows it is in the paper.
In the paper
“By step 14, the hier-base system has executed 5 Restore and 3 Remove actions; the hier-delib system has executed 0 Restore, 0 Remove, and 8 Decoy deployments.”
§ Context, Reasoning, and Hierarchy: A Cost-Performance Study of Compound LLM Agent Design in an Adversarial POMDP > Additional information
plainSingle case- Asserted: passes — The authors put it forward as true.
- Checkable: passes — It can be checked against evidence.
- Load-bearing: fails — The paper’s conclusions may not depend on it.
- Based: passes — The paper gives a reason why it holds.
Probably not a substantial claim. The paper’s conclusions may not depend on it.
A result the paper reports from its own data — it cites no other source for it, so there is none to check. The quote shows it is in the paper.
In the paper
“Programmatic state abstraction reduces SD alongside mean return (e.g., Grok: 70 to 40, Devstral: 65 to 48) and reduces catastrophic failure (< -150) from > 90% under obs to < 10% in the strongest cases (Figure 5).”
§ Context, Reasoning, and Hierarchy: A Cost-Performance Study of Compound LLM Agent Design in an Adversarial POMDP > 5.4 Robustness, Variance, and Tail Risk
plaindirect- Asserted: passes — The authors put it forward as true.
- Checkable: passes — It can be checked against evidence.
- Load-bearing: passes — The paper’s conclusions depend on it.
- Based: passes — The paper gives a reason why it holds.
It may state two separate claims as one.
A result the paper reports from its own data — it cites no other source for it, so there is none to check. The quote shows it is in the paper.
In the paper
“The total across all models and configurations is 3,475 episodes (104,250 agent-environment interaction steps, consuming 283.9M tokens).”
§ Context, Reasoning, and Hierarchy: A Cost-Performance Study of Compound LLM Agent Design in an Adversarial POMDP > Additional information
plain- Asserted: passes — The authors put it forward as true.
- Checkable: passes — It can be checked against evidence.
- Load-bearing: fails — The paper’s conclusions may not depend on it.
- Based: passes — The paper gives a reason why it holds.
Probably not a substantial claim. The paper’s conclusions may not depend on it.
A result the paper reports from its own data — it cites no other source for it, so there is none to check. The quote shows it is in the paper.
In the paper
“| obs | 28.0% | 96.0% | 64.0% | 98.0% | 96.0% | 32.0% |”
- Also stated in: § Contrast: Step 18 (hier-base). · plain
“| +COT | 4.0% | 30.0% | 2.0% | 8.0% | 52.0% | 0.0% |”
§ Context, Reasoning, and Hierarchy: A Cost-Performance Study of Compound LLM Agent Design in an Adversarial POMDP > Contrast: Step 18 (hier-base).
plaindirect- Asserted: passes — The authors put it forward as true.
- Checkable: passes — It can be checked against evidence.
- Load-bearing: unclear — It is unclear whether the paper’s conclusions depend on it.
- Based: passes — The paper gives a reason why it holds.
The quote only partly states this claim.
- Also stated in: § Contrast: Step 18 (hier-base). · plain
A result the paper reports from its own data — it cites no other source for it, so there is none to check. The quote shows it is in the paper.
In the paper
“| obs | 28.0% | 96.0% | 64.0% | 98.0% | 96.0% | 32.0% |”
- Also stated in: § Contrast: Step 18 (hier-base). · plain
“| +COT | 4.0% | 30.0% | 2.0% | 8.0% | 52.0% | 0.0% |”
§ Context, Reasoning, and Hierarchy: A Cost-Performance Study of Compound LLM Agent Design in an Adversarial POMDP > Contrast: Step 18 (hier-base).
plaindirect- Asserted: passes — The authors put it forward as true.
- Checkable: passes — It can be checked against evidence.
- Load-bearing: unclear — It is unclear whether the paper’s conclusions depend on it.
- Based: passes — The paper gives a reason why it holds.
The quote only partly states this claim.
- Also stated in: § Contrast: Step 18 (hier-base). · plain
A result the paper reports from its own data — it cites no other source for it, so there is none to check. The quote shows it is in the paper.
In the paper
“| obs | 28.0% | 96.0% | 64.0% | 98.0% | 96.0% | 32.0% |”
- Also stated in: § Contrast: Step 18 (hier-base). · plain
“| hier-base | 2.0% | 14.0% | 2.0% | 5.0% | 78.7% | 0.0% |”
§ Context, Reasoning, and Hierarchy: A Cost-Performance Study of Compound LLM Agent Design in an Adversarial POMDP > Contrast: Step 18 (hier-base).
plaindirect- Asserted: passes — The authors put it forward as true.
- Checkable: passes — It can be checked against evidence.
- Load-bearing: passes — The paper’s conclusions depend on it.
- Based: passes — The paper gives a reason why it holds.
The quote only partly states this claim.
- Also stated in: § Contrast: Step 18 (hier-base). · plain
A conclusion the paper draws from its own results — it cites no other source for it, so there is none to check. The quote shows it is in the paper.
In the paper
“The consuming agent cannot distinguish these from genuine warnings about the environment, so caution accumulates through the hierarchy.”
§ Context, Reasoning, and Hierarchy: A Cost-Performance Study of Compound LLM Agent Design in an Adversarial POMDP > 6 Discussion
plaindirect- Asserted: passes — The authors put it forward as true.
- Checkable: passes — It can be checked against evidence.
- Load-bearing: passes — The paper’s conclusions depend on it.
- Based: fails — The paper may give no reason why it holds.
Probably not a substantial claim. The paper may give no reason why it holds. It may state two separate claims as one.
A conclusion the paper draws from its own results — it cites no other source for it, so there is none to check. The quote shows it is in the paper.
In the paper
“Our deliberation cascade finding extends the single-agent self-correction limitation to compound systems, identifying a compositional failure mode invisible to either literature in isolation.”
§ Context, Reasoning, and Hierarchy: A Cost-Performance Study of Compound LLM Agent Design in an Adversarial POMDP > Context Engineering.
plaindirect- Asserted: passes — The authors put it forward as true.
- Checkable: passes — It can be checked against evidence.
- Load-bearing: passes — The paper’s conclusions depend on it.
- Based: passes — The paper gives a reason why it holds.
It may state two separate claims as one.
What the paper did — it cites no source for this, so there is none to check. The quote shows it is in the paper.
In the paper
“The initial user prompt template itself contributes nothing beyond a step counter and a closing question.All environment understanding comes from the content injected into these placeholders.”
§ Context, Reasoning, and Hierarchy: A Cost-Performance Study of Compound LLM Agent Design in an Adversarial POMDP > 3.3 Layer 3: Context Engineering
plain- Asserted: passes — The authors put it forward as true.
- Checkable: passes — It can be checked against evidence.
- Load-bearing: fails — The paper’s conclusions may not depend on it.
- Based: passes — The paper gives a reason why it holds.
Probably not a substantial claim. The paper’s conclusions may not depend on it. It may state two separate claims as one.
A conclusion the paper draws from its own results — it cites no other source for it, so there is none to check. The quote shows it is in the paper.
In the paper
“Our design space is static.”
§ Context, Reasoning, and Hierarchy: A Cost-Performance Study of Compound LLM Agent Design in an Adversarial POMDP > 8 Limitations and Future Work
plain- Asserted: passes — The authors put it forward as true.
- Checkable: passes — It can be checked against evidence.
- Load-bearing: fails — The paper’s conclusions may not depend on it.
- Based: passes — The paper gives a reason why it holds.
Probably not a substantial claim. The paper’s conclusions may not depend on it.
None of the sources cited for this claim could be matched to a paper in Crossref, so there is nothing to check it against.
In the paper
“Recent work shows that self-correction without external feedback can be harmful in monolithic agents [5], and Renze and Guven [17] decompose reflection components but evaluate only monolithic settings.”
§ Context, Reasoning, and Hierarchy: A Cost-Performance Study of Compound LLM Agent Design in an Adversarial POMDP > Context Engineering.
What the sources say
- Not matchedcites [5]
Couldn’t be matched to a paper in Crossref, so it can’t be checked.
- Not matchedcites [17]
Couldn’t be matched to a paper in Crossref, so it can’t be checked.
plaindirect- Asserted: passes — The authors put it forward as true.
- Checkable: passes — It can be checked against evidence.
- Load-bearing: passes — The paper’s conclusions depend on it.
- Based: passes — The paper gives a reason why it holds.
Probably not a substantial claim. It may state two separate claims as one.
- Not matched
What the paper did — it cites no source for this, so there is none to check. The quote shows it is in the paper.
In the paper
“This file is empty, confirming that no shared domain heuristics are injected across agents.”
§ Context, Reasoning, and Hierarchy: A Cost-Performance Study of Compound LLM Agent Design in an Adversarial POMDP > , reflection_knowledge:
boosted- Asserted: passes — The authors put it forward as true.
- Checkable: passes — It can be checked against evidence.
- Load-bearing: fails — The paper’s conclusions may not depend on it.
- Based: passes — The paper gives a reason why it holds.
Probably not a substantial claim. The paper’s conclusions may not depend on it.
None of the sources cited for this claim could be matched to a paper in Crossref, so there is nothing to check it against.
In the paper
“Recent work categorizes coordination protocols [16,21], derives topology scaling laws [9], and proposes structured communication formats [7,20].”
§ Context, Reasoning, and Hierarchy: A Cost-Performance Study of Compound LLM Agent Design in an Adversarial POMDP > Multi-Agent Architecture and Scaling.
What the sources say
- Not matchedcites [16]
Couldn’t be matched to a paper in Crossref, so it can’t be checked.
- Not matchedcites [21]
Couldn’t be matched to a paper in Crossref, so it can’t be checked.
- Not matchedcites [9]
Couldn’t be matched to a paper in Crossref, so it can’t be checked.
- Not matchedcites [7]
Couldn’t be matched to a paper in Crossref, so it can’t be checked.
- Not matchedcites [20]
Couldn’t be matched to a paper in Crossref, so it can’t be checked.
plain- Asserted: passes — The authors put it forward as true.
- Checkable: passes — It can be checked against evidence.
- Load-bearing: fails — The paper’s conclusions may not depend on it.
- Based: passes — The paper gives a reason why it holds.
Probably not a substantial claim. The paper’s conclusions may not depend on it. It may state two separate claims as one.
- Not matched
A conclusion the paper draws from its own results — it cites no other source for it, so there is none to check. The quote shows it is in the paper.
In the paper
“Our claims are scoped to structured adversarial POMDPs where deterministic state abstraction is feasible.”
§ Context, Reasoning, and Hierarchy: A Cost-Performance Study of Compound LLM Agent Design in an Adversarial POMDP > 8 Limitations and Future Work
plain- Asserted: passes — The authors put it forward as true.
- Checkable: passes — It can be checked against evidence.
- Load-bearing: passes — The paper’s conclusions depend on it.
- Based: passes — The paper gives a reason why it holds.
Probably not a substantial claim.
What the paper did — it cites no source for this, so there is none to check. The quote shows it is in the paper.
In the paper
“No per-model tuning is performed.”
§ Context, Reasoning, and Hierarchy: A Cost-Performance Study of Compound LLM Agent Design in an Adversarial POMDP > Models.
plain- Asserted: passes — The authors put it forward as true.
- Checkable: passes — It can be checked against evidence.
- Load-bearing: passes — The paper’s conclusions depend on it.
- Based: passes — The paper gives a reason why it holds.
Probably not a substantial claim.
In the paper
“The attacker does not respond to the defender's actions, but host attributes, processes, and the progression of the kill chain vary stochastically across runs.”
§ Context, Reasoning, and Hierarchy: A Cost-Performance Study of Compound LLM Agent Design in an Adversarial POMDP > 2 Background & Problem Definition
What the sources say
- Not matchedcites [8]
Couldn’t be matched to a paper in Crossref, so it can’t be checked.
plain- Asserted: passes — The authors put it forward as true.
- Checkable: passes — It can be checked against evidence.
- Load-bearing: passes — The paper’s conclusions depend on it.
- Based: passes — The paper gives a reason why it holds.
Probably not a substantial claim. It may state two separate claims as one.
- Not matched
What the paper did — it cites no source for this, so there is none to check. The quote shows it is in the paper.
In the paper
“Agents receive only a one-sentence role instruction and a compact action reference table.No network topology, attacker kill-chain details, host-value assignments, or defense heuristics are provided, and the prompt never mentions the environment by name.”
§ Context, Reasoning, and Hierarchy: A Cost-Performance Study of Compound LLM Agent Design in an Adversarial POMDP > Knowledge-Free Initialization.
plain- Asserted: passes — The authors put it forward as true.
- Checkable: passes — It can be checked against evidence.
- Load-bearing: passes — The paper’s conclusions depend on it.
- Based: passes — The paper gives a reason why it holds.
Probably not a substantial claim. It may state two separate claims as one.
- The authors state this as an assumption: Models' internal knowledge may include information about CAGE-2 acquired during pre-training.
In the paper
“To ground the reward scale, we reference the public CAGE-2 leaderboard [22] (30-step, B_line setting).”
§ Context, Reasoning, and Hierarchy: A Cost-Performance Study of Compound LLM Agent Design in an Adversarial POMDP > Reward-Scale Reference Points.
What the sources say
- Not matchedcites [22]
Couldn’t be matched to a paper in Crossref, so it can’t be checked.
plain- Asserted: passes — The authors put it forward as true.
- Checkable: passes — It can be checked against evidence.
- Load-bearing: fails — The paper’s conclusions may not depend on it.
- Based: passes — The paper gives a reason why it holds.
Probably not a substantial claim. The paper’s conclusions may not depend on it.
- Rests on an assumption: The public CAGE-2 leaderboard reference values are comparable to the study's setting.
- Not matched
What the paper did — it cites no source for this, so there is none to check. The quote shows it is in the paper.
In the paper
“Step-level instantiation ensures no hidden conversational state accumulates across steps.”
§ Context, Reasoning, and Hierarchy: A Cost-Performance Study of Compound LLM Agent Design in an Adversarial POMDP > 4. Reasoning
plaindirect- Asserted: passes — The authors put it forward as true.
- Checkable: passes — It can be checked against evidence.
- Load-bearing: fails — The paper’s conclusions may not depend on it.
- Based: fails — The paper may give no reason why it holds.
Probably not a substantial claim. The paper’s conclusions may not depend on it. The paper may give no reason why it holds.
A conclusion the paper draws from its own results — it cites no other source for it, so there is none to check. The quote shows it is in the paper.
In the paper
“{history} thus serves a dual function: it provides temporal context for intervention sequencing and supplies the Planner's own prior reasoning through programmatically extracted justifications, creating a compressed log of past decisions with explanations.”
§ Context, Reasoning, and Hierarchy: A Cost-Performance Study of Compound LLM Agent Design in an Adversarial POMDP > 3.3 Layer 3: Context Engineering
plaindirect- Asserted: passes — The authors put it forward as true.
- Checkable: passes — It can be checked against evidence.
- Load-bearing: fails — The paper’s conclusions may not depend on it.
- Based: passes — The paper gives a reason why it holds.
Probably not a substantial claim. The paper’s conclusions may not depend on it. It may state two separate claims as one.
A conclusion the paper draws from its own results — it cites no other source for it, so there is none to check. The quote shows it is in the paper.
In the paper
“A cross-cutting finding reinforces these conclusions: qualitative effects hold across all six models, but magnitudes vary by 2-10× and some reverse sign (e.g., Llama is harmed by hierarchy), validating multi-model evaluation as essential for compound AI research.”
§ Context, Reasoning, and Hierarchy: A Cost-Performance Study of Compound LLM Agent Design in an Adversarial POMDP > 9 Conclusion
boosted- Asserted: passes — The authors put it forward as true.
- Checkable: fails — It may be too vague to check against evidence.
- Load-bearing: passes — The paper’s conclusions depend on it.
- Based: passes — The paper gives a reason why it holds.
Probably not a substantial claim. It may be too vague to check against evidence.
A conclusion the paper draws from its own results — it cites no other source for it, so there is none to check. The quote shows it is in the paper.
In the paper
“Knowledge-free agents rely solely on this scaffolding, so gains come from presentation and uncertainty compression, not domain expertise.”
§ Context, Reasoning, and Hierarchy: A Cost-Performance Study of Compound LLM Agent Design in an Adversarial POMDP > 6 Discussion
plaindirect- Asserted: passes — The authors put it forward as true.
- Checkable: passes — It can be checked against evidence.
- Load-bearing: passes — The paper’s conclusions depend on it.
- Based: passes — The paper gives a reason why it holds.
It may state two separate claims as one.
The paper states this without a source or data behind it here, so there is nothing to check it against. The quote shows it is in the paper.
In the paper
“The deliberation and multi-agent literatures remain disconnected, and we show that combining them can introduce failure modes invisible to either in isolation.”
§ Context, Reasoning, and Hierarchy: A Cost-Performance Study of Compound LLM Agent Design in an Adversarial POMDP > 1 Introduction
plain- Asserted: passes — The authors put it forward as true.
- Checkable: fails — It may be too vague to check against evidence.
- Load-bearing: passes — The paper’s conclusions depend on it.
- Based: fails — The paper may give no reason why it holds.
Probably not a substantial claim. It may be too vague to check against evidence. The paper may give no reason why it holds.
What the paper did — it cites no source for this, so there is none to check. The quote shows it is in the paper.
In the paper
“Deliberation tools are tested only in cumulative activation order; independent activation may yield different interaction patterns.”
§ Context, Reasoning, and Hierarchy: A Cost-Performance Study of Compound LLM Agent Design in an Adversarial POMDP > 8 Limitations and Future Work
plain- Asserted: passes — The authors put it forward as true.
- Checkable: passes — It can be checked against evidence.
- Load-bearing: fails — The paper’s conclusions may not depend on it.
- Based: passes — The paper gives a reason why it holds.
Probably not a substantial claim. The paper’s conclusions may not depend on it.
- The authors state this as an assumption: The cumulative activation order of deliberation tools is a valid representation of deliberation depth.
A conclusion the paper draws from its own results — it cites no other source for it, so there is none to check. The quote shows it is in the paper.
In the paper
“More broadly, our findings suggest that the science of compound AI systems requires studying topology, node internals, and the interaction effects that arise when individually sensible components are composed.”
§ Context, Reasoning, and Hierarchy: A Cost-Performance Study of Compound LLM Agent Design in an Adversarial POMDP > 9 Conclusion
hedged- Asserted: passes — The authors put it forward as true.
- Checkable: fails — It may be too vague to check against evidence.
- Load-bearing: passes — The paper’s conclusions depend on it.
- Based: passes — The paper gives a reason why it holds.
Probably not a substantial claim. It may be too vague to check against evidence.
- The authors state this as an assumption: Knowledge-free prompts isolate architectural effects from pretrained priors.
- The authors state this as an assumption: The cumulative activation order of deliberation tools is a valid representation of deliberation depth.
A conclusion the paper draws from its own results — it cites no other source for it, so there is none to check. The quote shows it is in the paper.
In the paper
“The trajectories reveal a failure mode we term distributed caution bias, a concrete instantiation of the cascading-uncertainty mechanism discussed in Section 5.2.3.”
§ Context, Reasoning, and Hierarchy: A Cost-Performance Study of Compound LLM Agent Design in an Adversarial POMDP > G Trajectory Examples
plaindirect- Asserted: passes — The authors put it forward as true.
- Checkable: passes — It can be checked against evidence.
- Load-bearing: passes — The paper’s conclusions depend on it.
- Based: passes — The paper gives a reason why it holds.
It may state two separate claims as one.
What the paper did — it cites no source for this, so there is none to check. The quote shows it is in the paper.
In the paper
“Step-level fresh instantiation ensures token accounting is precise and isolated.”
§ Context, Reasoning, and Hierarchy: A Cost-Performance Study of Compound LLM Agent Design in an Adversarial POMDP > Models.
plaindirect- Asserted: passes — The authors put it forward as true.
- Checkable: passes — It can be checked against evidence.
- Load-bearing: fails — The paper’s conclusions may not depend on it.
- Based: fails — The paper may give no reason why it holds.
Probably not a substantial claim. The paper’s conclusions may not depend on it. The paper may give no reason why it holds.
In the paper
“Unlike cross-episode reflection (e.g., Reflexion [18]), all deliberation occurs within a single step and carries no memory to future steps.”
§ Context, Reasoning, and Hierarchy: A Cost-Performance Study of Compound LLM Agent Design in an Adversarial POMDP > 3.4 Deliberation Tools
What the sources say
- Not matchedcites [18]
Couldn’t be matched to a paper in Crossref, so it can’t be checked.
plain- Asserted: passes — The authors put it forward as true.
- Checkable: passes — It can be checked against evidence.
- Load-bearing: fails — The paper’s conclusions may not depend on it.
- Based: passes — The paper gives a reason why it holds.
Probably not a substantial claim. The paper’s conclusions may not depend on it. It may state two separate claims as one.
- Not matched
What the paper did — it cites no source for this, so there is none to check. The quote shows it is in the paper.
In the paper
“All structured injections are fully deterministic and their cost is limited to the marginal tokens they add to the prompt (examples in Appendix B).”
§ Context, Reasoning, and Hierarchy: A Cost-Performance Study of Compound LLM Agent Design in an Adversarial POMDP > 3.3 Layer 3: Context Engineering
plain- Asserted: passes — The authors put it forward as true.
- Checkable: passes — It can be checked against evidence.
- Load-bearing: fails — The paper’s conclusions may not depend on it.
- Based: fails — The paper may give no reason why it holds.
Probably not a substantial claim. The paper’s conclusions may not depend on it. The paper may give no reason why it holds. It may state two separate claims as one.
A conclusion the paper draws from its own results — it cites no other source for it, so there is none to check. The quote shows it is in the paper.
In the paper
“Token counts proxy cost but do not capture latency or pricing, and knowledge-free prompts isolate architectural effects without fully disentangling pretrained priors.”
§ Context, Reasoning, and Hierarchy: A Cost-Performance Study of Compound LLM Agent Design in an Adversarial POMDP > 8 Limitations and Future Work
plain- Asserted: passes — The authors put it forward as true.
- Checkable: passes — It can be checked against evidence.
- Load-bearing: fails — The paper’s conclusions may not depend on it.
- Based: passes — The paper gives a reason why it holds.
Probably not a substantial claim. The paper’s conclusions may not depend on it. It may state two separate claims as one.
- The authors state this as an assumption: Token counts are a valid proxy for cost in comparing configurations.
What the paper did — it cites no source for this, so there is none to check. The quote shows it is in the paper.
In the paper
“These allocation differences do not affect qualitative conclusions, which are validated across all six models (Appendix I).”
§ Context, Reasoning, and Hierarchy: A Cost-Performance Study of Compound LLM Agent Design in an Adversarial POMDP > Models.
plain- Asserted: passes — The authors put it forward as true.
- Checkable: passes — It can be checked against evidence.
- Load-bearing: passes — The paper’s conclusions depend on it.
- Based: passes — The paper gives a reason why it holds.
Probably not a substantial claim. It may state two separate claims as one.
None of the sources cited for this claim could be matched to a paper in Crossref, so there is nothing to check it against.
In the paper
“Intra-step deliberation techniques, such as chain-of-thought [10,23], self-interrogation [15], and selfrefinement [13], operate within a single inference call, unlike crossepisode methods such as Reflexion [18].”
§ Context, Reasoning, and Hierarchy: A Cost-Performance Study of Compound LLM Agent Design in an Adversarial POMDP > Context Engineering.
What the sources say
- Not matchedcites [10]
Couldn’t be matched to a paper in Crossref, so it can’t be checked.
- Not matchedcites [23]
Couldn’t be matched to a paper in Crossref, so it can’t be checked.
- Not matchedcites [15]
Couldn’t be matched to a paper in Crossref, so it can’t be checked.
- Not matchedcites [13]
Couldn’t be matched to a paper in Crossref, so it can’t be checked.
plain- Asserted: passes — The authors put it forward as true.
- Checkable: passes — It can be checked against evidence.
- Load-bearing: passes — The paper’s conclusions depend on it.
- Based: passes — The paper gives a reason why it holds.
Probably not a substantial claim.
- Not matched
A conclusion the paper draws from its own results — it cites no other source for it, so there is none to check. The quote shows it is in the paper.
In the paper
“Each layer builds on the previous, and the value of hierarchy and deliberation is conditional on the quality of infrastructure and context.”
§ Context, Reasoning, and Hierarchy: A Cost-Performance Study of Compound LLM Agent Design in an Adversarial POMDP > 6 Discussion
plainconditional- Asserted: passes — The authors put it forward as true.
- Checkable: passes — It can be checked against evidence.
- Load-bearing: passes — The paper’s conclusions depend on it.
- Based: passes — The paper gives a reason why it holds.
It may state two separate claims as one.
A conclusion the paper draws from its own results — it cites no other source for it, so there is none to check. The quote shows it is in the paper.
In the paper
“The deliberation cascade identified in this study is one such interaction effect, and designing inter-agent uncertainty arbitration protocols to prevent it is a promising direction for future work.”
§ Context, Reasoning, and Hierarchy: A Cost-Performance Study of Compound LLM Agent Design in an Adversarial POMDP > 9 Conclusion
plaincorrelational- Asserted: passes — The authors put it forward as true.
- Checkable: passes — It can be checked against evidence.
- Load-bearing: passes — The paper’s conclusions depend on it.
- Based: passes — The paper gives a reason why it holds.
Probably not a substantial claim.
- The authors state this as an assumption: The cumulative activation order of deliberation tools is a valid representation of deliberation depth.
A conclusion the paper draws from its own results — it cites no other source for it, so there is none to check. The quote shows it is in the paper.
In the paper
“Our model selection spans mid-tier and efficiency-focused families; frontier-scale models may respond differently.”
§ Context, Reasoning, and Hierarchy: A Cost-Performance Study of Compound LLM Agent Design in an Adversarial POMDP > 8 Limitations and Future Work
plain- Asserted: passes — The authors put it forward as true.
- Checkable: passes — It can be checked against evidence.
- Load-bearing: fails — The paper’s conclusions may not depend on it.
- Based: passes — The paper gives a reason why it holds.
Probably not a substantial claim. The paper’s conclusions may not depend on it.
In the paper
“Our results complement topology-focused scaling [9] by showing that internal configuration determines whether decomposition helps or hurts, revealing failure modes invisible to topology-only analyses.”
§ Context, Reasoning, and Hierarchy: A Cost-Performance Study of Compound LLM Agent Design in an Adversarial POMDP > 6 Discussion
What the sources say
- Not matchedcites [9]
Couldn’t be matched to a paper in Crossref, so it can’t be checked.
plaindirect- Asserted: passes — The authors put it forward as true.
- Checkable: passes — It can be checked against evidence.
- Load-bearing: passes — The paper’s conclusions depend on it.
- Based: passes — The paper gives a reason why it holds.
It may state two separate claims as one.
- Not matched
What the paper did — it cites no source for this, so there is none to check. The quote shows it is in the paper.
In the paper
“All three agents share the same engine-personality separation logic, ensuring the observed hierarchy effects reflect role decomposition.”
§ Context, Reasoning, and Hierarchy: A Cost-Performance Study of Compound LLM Agent Design in an Adversarial POMDP > 3.1 Layer 1: Hierarchical Decomposition
plaindirect- Asserted: passes — The authors put it forward as true.
- Checkable: passes — It can be checked against evidence.
- Load-bearing: passes — The paper’s conclusions depend on it.
- Based: fails — The paper may give no reason why it holds.
Probably not a substantial claim. The paper may give no reason why it holds. It may state two separate claims as one.
A conclusion the paper draws from its own results — it cites no other source for it, so there is none to check. The quote shows it is in the paper.
In the paper
“This layer embeds domain-informed observation processing.The engineering choices that form the model shape what the agent perceives.Although the layer prescribes no action-selection decisions (no threat rubrics, no host priorities, and no response heuristics), it still carries inductive bias that may influence the agent's reasoning.”
§ Context, Reasoning, and Hierarchy: A Cost-Performance Study of Compound LLM Agent Design in an Adversarial POMDP > 3.2 Layer 2: Deterministic Environment Model
hedgedconditional- Asserted: passes — The authors put it forward as true.
- Checkable: passes — It can be checked against evidence.
- Load-bearing: fails — The paper’s conclusions may not depend on it.
- Based: passes — The paper gives a reason why it holds.
Probably not a substantial claim. The paper’s conclusions may not depend on it. It may state two separate claims as one.
In the paper
“Multiagent research emphasizes topology (wiring) over internal agent design [9], leaving the interaction between internal configuration and hierarchy underexplored.”
§ Context, Reasoning, and Hierarchy: A Cost-Performance Study of Compound LLM Agent Design in an Adversarial POMDP > 1 Introduction
What the sources say
- Not matchedcites [9]
Couldn’t be matched to a paper in Crossref, so it can’t be checked.
plain- Asserted: passes — The authors put it forward as true.
- Checkable: passes — It can be checked against evidence.
- Load-bearing: passes — The paper’s conclusions depend on it.
- Based: passes — The paper gives a reason why it holds.
It may state two separate claims as one.
- Not matched
In the paper
“A defender protects a 13-host network against an attacker that follows a scripted, non-adaptive multi-stage kill chain [8] over 𝑇 =30 steps.”
§ Context, Reasoning, and Hierarchy: A Cost-Performance Study of Compound LLM Agent Design in an Adversarial POMDP > 2 Background & Problem Definition
What the sources say
- Not matchedcites [8]
Couldn’t be matched to a paper in Crossref, so it can’t be checked.
plain- Asserted: passes — The authors put it forward as true.
- Checkable: passes — It can be checked against evidence.
- Load-bearing: passes — The paper’s conclusions depend on it.
- Based: passes — The paper gives a reason why it holds.
Probably not a substantial claim.
- Not matched
What the paper did — it cites no source for this, so there is none to check. The quote shows it is in the paper.
In the paper
“Each run is launched with a unique seed and fresh agent state.”
§ Context, Reasoning, and Hierarchy: A Cost-Performance Study of Compound LLM Agent Design in an Adversarial POMDP > Models.
plain- Asserted: passes — The authors put it forward as true.
- Checkable: passes — It can be checked against evidence.
- Load-bearing: passes — The paper’s conclusions depend on it.
- Based: passes — The paper gives a reason why it holds.
Probably not a substantial claim.
What the paper did — it cites no source for this, so there is none to check. The quote shows it is in the paper.
In the paper
“This safeguards against reliance on single-model results.”
§ Context, Reasoning, and Hierarchy: A Cost-Performance Study of Compound LLM Agent Design in an Adversarial POMDP > Models.
plaindirectn = 5- Asserted: passes — The authors put it forward as true.
- Checkable: passes — It can be checked against evidence.
- Load-bearing: passes — The paper’s conclusions depend on it.
- Based: passes — The paper gives a reason why it holds.
Probably not a substantial claim. The quote only partly states this claim.
What the paper did — it cites no source for this, so there is none to check. The quote shows it is in the paper.
In the paper
“All models use deterministic decoding (temperature 0).”
§ Context, Reasoning, and Hierarchy: A Cost-Performance Study of Compound LLM Agent Design in an Adversarial POMDP > Models.
plainn = 5- Asserted: passes — The authors put it forward as true.
- Checkable: passes — It can be checked against evidence.
- Load-bearing: fails — The paper’s conclusions may not depend on it.
- Based: passes — The paper gives a reason why it holds.
Probably not a substantial claim. The paper’s conclusions may not depend on it.
What the paper did — it cites no source for this, so there is none to check. The quote shows it is in the paper.
In the paper
“Critically, this model is computed exclusively from the agent's own observations and past actions.”
§ Context, Reasoning, and Hierarchy: A Cost-Performance Study of Compound LLM Agent Design in an Adversarial POMDP > 3.2 Layer 2: Deterministic Environment Model
plaindirect- Asserted: passes — The authors put it forward as true.
- Checkable: passes — It can be checked against evidence.
- Load-bearing: fails — The paper’s conclusions may not depend on it.
- Based: passes — The paper gives a reason why it holds.
Probably not a substantial claim. The paper’s conclusions may not depend on it.
What the paper did — it cites no source for this, so there is none to check. The quote shows it is in the paper.
In the paper
“We adopt multi-model replication as the primary validity guard: findings must replicate across the majority of the tested models.”
§ Context, Reasoning, and Hierarchy: A Cost-Performance Study of Compound LLM Agent Design in an Adversarial POMDP > Models.
plain- Asserted: passes — The authors put it forward as true.
- Checkable: passes — It can be checked against evidence.
- Load-bearing: passes — The paper’s conclusions depend on it.
- Based: fails — The paper may give no reason why it holds.
Probably not a substantial claim. The paper may give no reason why it holds.
The paper states this without a source or data behind it here, so there is nothing to check it against. The quote shows it is in the paper.
In the paper
“These studies vary wiring while treating nodes as fixed; we hold wiring fixed and ablate internal configuration, revealing failure modes like deliberation cascades that are invisible to topology-only analyses.”
§ Context, Reasoning, and Hierarchy: A Cost-Performance Study of Compound LLM Agent Design in an Adversarial POMDP > Multi-Agent Architecture and Scaling.
plaindirect- Asserted: passes — The authors put it forward as true.
- Checkable: passes — It can be checked against evidence.
- Load-bearing: passes — The paper’s conclusions depend on it.
- Based: passes — The paper gives a reason why it holds.
It may state two separate claims as one.
What the paper did — it cites no source for this, so there is none to check. The quote shows it is in the paper.
In the paper
“These mechanisms ensure format compliance.They are designed to minimize harm when invoked.”
§ Context, Reasoning, and Hierarchy: A Cost-Performance Study of Compound LLM Agent Design in an Adversarial POMDP > Reliability Mechanisms.
plaindirect- Asserted: passes — The authors put it forward as true.
- Checkable: passes — It can be checked against evidence.
- Load-bearing: passes — The paper’s conclusions depend on it.
- Based: passes — The paper gives a reason why it holds.
Probably not a substantial claim. It may state two separate claims as one.
None of the sources cited for this claim could be matched to a paper in Crossref, so there is nothing to check it against.
In the paper
“Partial observability requires sustaining situational awareness under noisy indicators.”
§ Context, Reasoning, and Hierarchy: A Cost-Performance Study of Compound LLM Agent Design in an Adversarial POMDP > 2 Background & Problem Definition
What the sources say
- Not matchedcites [19]
Couldn’t be matched to a paper in Crossref, so it can’t be checked.
- Not matchedcites [22]
Couldn’t be matched to a paper in Crossref, so it can’t be checked.
plaindirect- Asserted: passes — The authors put it forward as true.
- Checkable: fails — It may be too vague to check against evidence.
- Load-bearing: fails — The paper’s conclusions may not depend on it.
- Based: passes — The paper gives a reason why it holds.
Probably not a substantial claim. It may be too vague to check against evidence. The paper’s conclusions may not depend on it.
- Not matched
What the paper did — it cites no source for this, so there is none to check. The quote shows it is in the paper.
In the paper
“All inter-step continuity is explicit in the deterministic state structures and compiled context.”
§ Context, Reasoning, and Hierarchy: A Cost-Performance Study of Compound LLM Agent Design in an Adversarial POMDP > 4. Reasoning
plain- Asserted: passes — The authors put it forward as true.
- Checkable: passes — It can be checked against evidence.
- Load-bearing: fails — The paper’s conclusions may not depend on it.
- Based: passes — The paper gives a reason why it holds.
Probably not a substantial claim. The paper’s conclusions may not depend on it.
The paper states this without a source or data behind it here, so there is nothing to check it against. The quote shows it is in the paper.
In the paper
“No prior work studies deliberation distributed across a hierarchy.”
§ Context, Reasoning, and Hierarchy: A Cost-Performance Study of Compound LLM Agent Design in an Adversarial POMDP > Context Engineering.
plain- Asserted: passes — The authors put it forward as true.
- Checkable: passes — It can be checked against evidence.
- Load-bearing: passes — The paper’s conclusions depend on it.
- Based: fails — The paper may give no reason why it holds.
Probably not a substantial claim. The paper may give no reason why it holds.
None of the sources cited for this claim could be matched to a paper in Crossref, so there is nothing to check it against.
In the paper
“Context design is a critical lever [6], supported by tooling ecosystems [11] and algorithmic context evolution [25].”
§ Context, Reasoning, and Hierarchy: A Cost-Performance Study of Compound LLM Agent Design in an Adversarial POMDP > Context Engineering.
What the sources say
- Not matchedcites [6]
Couldn’t be matched to a paper in Crossref, so it can’t be checked.
- Not matchedcites [11]
Couldn’t be matched to a paper in Crossref, so it can’t be checked.
- Not matchedcites [25]
Couldn’t be matched to a paper in Crossref, so it can’t be checked.
plaindirect- Asserted: passes — The authors put it forward as true.
- Checkable: fails — It may be too vague to check against evidence.
- Load-bearing: fails — The paper’s conclusions may not depend on it.
- Based: passes — The paper gives a reason why it holds.
Probably not a substantial claim. It may be too vague to check against evidence. The paper’s conclusions may not depend on it. It may state two separate claims as one.
- Not matched
What the paper did — it cites no source for this, so there is none to check. The quote shows it is in the paper.
In the paper
“All LLMs receive an identical set of prompts and tools.”
§ Context, Reasoning, and Hierarchy: A Cost-Performance Study of Compound LLM Agent Design in an Adversarial POMDP > Knowledge-Free Initialization.
plain- Asserted: passes — The authors put it forward as true.
- Checkable: passes — It can be checked against evidence.
- Load-bearing: passes — The paper’s conclusions depend on it.
- Based: passes — The paper gives a reason why it holds.
Probably not a substantial claim.
None of the sources cited for this claim could be matched to a paper in Crossref, so there is nothing to check it against.
In the paper
“The deliberation tools implement a self-questioning, self-critique, and self-refinement cycle inspired by Self-Refine [13] and selfinterrogation techniques [15]; the CoT injection follows Wei et al. [23] and Kojima et al. [10].”
§ Context, Reasoning, and Hierarchy: A Cost-Performance Study of Compound LLM Agent Design in an Adversarial POMDP > 3.4 Deliberation Tools
What the sources say
- Not matchedcites [13]
Couldn’t be matched to a paper in Crossref, so it can’t be checked.
- Not matchedcites [15]
Couldn’t be matched to a paper in Crossref, so it can’t be checked.
- Not matchedcites [23]
Couldn’t be matched to a paper in Crossref, so it can’t be checked.
plain- Asserted: passes — The authors put it forward as true.
- Checkable: passes — It can be checked against evidence.
- Load-bearing: fails — The paper’s conclusions may not depend on it.
- Based: passes — The paper gives a reason why it holds.
Probably not a substantial claim. The paper’s conclusions may not depend on it. It may state two separate claims as one.
- Not matched
None of the sources cited for this claim could be matched to a paper in Crossref, so there is nothing to check it against.
In the paper
“LLM-based defenders [3,14] are newer but lack controlled architectural ablations.”
§ Context, Reasoning, and Hierarchy: A Cost-Performance Study of Compound LLM Agent Design in an Adversarial POMDP > Autonomous Cyber Defense.
What the sources say
- Not matchedcites [3]
Couldn’t be matched to a paper in Crossref, so it can’t be checked.
- Not matchedcites [14]
Couldn’t be matched to a paper in Crossref, so it can’t be checked.
plain- Asserted: passes — The authors put it forward as true.
- Checkable: passes — It can be checked against evidence.
- Load-bearing: passes — The paper’s conclusions depend on it.
- Based: passes — The paper gives a reason why it holds.
It may state two separate claims as one.
- Not matched
What the paper did — it cites no source for this, so there is none to check. The quote shows it is in the paper.
In the paper
“As a pricing sensitivity check, we re-weighted token costs using provider-specific input/output pricing ratios (Appendix F); this did not reverse any qualitative conclusion, although it narrowed the relative cost advantage of context over hierarchy.”
§ Context, Reasoning, and Hierarchy: A Cost-Performance Study of Compound LLM Agent Design in an Adversarial POMDP > 5.3 Finding 3: Context Engineering Dominates the Cost-Performance Frontier
plaindirect- Asserted: passes — The authors put it forward as true.
- Checkable: passes — It can be checked against evidence.
- Load-bearing: unclear — It is unclear whether the paper’s conclusions depend on it.
- Based: passes — The paper gives a reason why it holds.
It may state two separate claims as one.
The paper states this without a source or data behind it here, so there is nothing to check it against. The quote shows it is in the paper.
In the paper
“In an adversarial sequential environment, every invalid action is a wasted step during which the attacker advances unopposed.”
§ Context, Reasoning, and Hierarchy: A Cost-Performance Study of Compound LLM Agent Design in an Adversarial POMDP > Reliability Mechanisms.
plaindirect- Asserted: passes — The authors put it forward as true.
- Checkable: passes — It can be checked against evidence.
- Load-bearing: passes — The paper’s conclusions depend on it.
- Based: fails — The paper may give no reason why it holds.
Probably not a substantial claim. The paper may give no reason why it holds.
What the paper did — it cites no source for this, so there is none to check. The quote shows it is in the paper.
In the paper
“We adopt a full-coverage design: all six models are evaluated on all 12 configurations across three experimental axes (72 unique model-configuration pairs).”
§ Context, Reasoning, and Hierarchy: A Cost-Performance Study of Compound LLM Agent Design in an Adversarial POMDP > Models.
plain- Asserted: passes — The authors put it forward as true.
- Checkable: passes — It can be checked against evidence.
- Load-bearing: passes — The paper’s conclusions depend on it.
- Based: passes — The paper gives a reason why it holds.
Probably not a substantial claim.
In the paper
“While context engineering is widely endorsed [6], controlled evidence on the cost-performance trade-offs of specific context components in sequential settings is limited.”
§ Context, Reasoning, and Hierarchy: A Cost-Performance Study of Compound LLM Agent Design in an Adversarial POMDP > 1 Introduction
What the sources say
- Not matchedcites [6]
Couldn’t be matched to a paper in Crossref, so it can’t be checked.
plain- Asserted: passes — The authors put it forward as true.
- Checkable: passes — It can be checked against evidence.
- Load-bearing: passes — The paper’s conclusions depend on it.
- Based: passes — The paper gives a reason why it holds.
It may state two separate claims as one.
- Not matched
None of the sources cited for this claim could be matched to a paper in Crossref, so there is nothing to check it against.
In the paper
“Reward 𝑟 𝑡 ≤ 0 penalizes compromise and intervention; we report episodic return 𝐺 = 𝑇 𝑡 =1 𝑟 𝑡 (closer to zero is better).”
§ Context, Reasoning, and Hierarchy: A Cost-Performance Study of Compound LLM Agent Design in an Adversarial POMDP > 2 Background & Problem Definition
What the sources say
- Not matchedcites [19]
Couldn’t be matched to a paper in Crossref, so it can’t be checked.
- Not matchedcites [22]
Couldn’t be matched to a paper in Crossref, so it can’t be checked.
plaindirect- Asserted: passes — The authors put it forward as true.
- Checkable: passes — It can be checked against evidence.
- Load-bearing: passes — The paper’s conclusions depend on it.
- Based: passes — The paper gives a reason why it holds.
Probably not a substantial claim. It may state two separate claims as one.
- Not matched
None of the sources cited for this claim could be matched to a paper in Crossref, so there is nothing to check it against.
In the paper
“CybORG CAGE-2 [8,22] has been addressed with RL [1], model-based planning [4], and particle filtering [12].”
§ Context, Reasoning, and Hierarchy: A Cost-Performance Study of Compound LLM Agent Design in an Adversarial POMDP > Autonomous Cyber Defense.
What the sources say
- Not matchedcites [8]
Couldn’t be matched to a paper in Crossref, so it can’t be checked.
- Not matchedcites [22]
Couldn’t be matched to a paper in Crossref, so it can’t be checked.
- Not matchedcites [1]
Couldn’t be matched to a paper in Crossref, so it can’t be checked.
- Not matchedcites [4]
Couldn’t be matched to a paper in Crossref, so it can’t be checked.
plain- Asserted: passes — The authors put it forward as true.
- Checkable: passes — It can be checked against evidence.
- Load-bearing: fails — The paper’s conclusions may not depend on it.
- Based: passes — The paper gives a reason why it holds.
Probably not a substantial claim. The paper’s conclusions may not depend on it.
- Not matched
A conclusion the paper draws from its own results — it cites no other source for it, so there is none to check. The quote shows it is in the paper.
In the paper
“These results suggest a practical starting point for structured adversarial POMDPs, mirroring the trajectory we followed: build deterministic infrastructure to deliver clean structured context, add bounded hierarchy when models can exploit delegation, and treat deliberation as a costly capability-conditional option rather than a universal upgrade.”
§ Context, Reasoning, and Hierarchy: A Cost-Performance Study of Compound LLM Agent Design in an Adversarial POMDP > 9 Conclusion
hedgedconditional- Asserted: passes — The authors put it forward as true.
- Checkable: fails — It may be too vague to check against evidence.
- Load-bearing: passes — The paper’s conclusions depend on it.
- Based: passes — The paper gives a reason why it holds.
Probably not a substantial claim. It may be too vague to check against evidence. It may state two separate claims as one.
- The authors state this as an assumption: Token counts are a valid proxy for cost in comparing configurations.
- The authors state this as an assumption: Knowledge-free prompts isolate architectural effects from pretrained priors.
- The authors state this as an assumption: The cumulative activation order of deliberation tools is a valid representation of deliberation depth.
A conclusion the paper draws from its own results — it cites no other source for it, so there is none to check. The quote shows it is in the paper.
In the paper
“Multi-model evaluation is thus essential: a Llama-only study would conclude hierarchy hurts, whereas a Grok-only study would assert it is important.”
§ Context, Reasoning, and Hierarchy: A Cost-Performance Study of Compound LLM Agent Design in an Adversarial POMDP > 5.4 Robustness, Variance, and Tail Risk
hedgeddirect- Asserted: passes — The authors put it forward as true.
- Checkable: passes — It can be checked against evidence.
- Load-bearing: passes — The paper’s conclusions depend on it.
- Based: passes — The paper gives a reason why it holds.
It may state two separate claims as one.
A conclusion the paper draws from its own results — it cites no other source for it, so there is none to check. The quote shows it is in the paper.
In the paper
“Token counts proxy cost but do not capture latency or pricing, and knowledge-free prompts isolate architectural effects without fully disentangling pretrained priors.”
§ Context, Reasoning, and Hierarchy: A Cost-Performance Study of Compound LLM Agent Design in an Adversarial POMDP > 8 Limitations and Future Work
plaindirect- Asserted: passes — The authors put it forward as true.
- Checkable: passes — It can be checked against evidence.
- Load-bearing: fails — The paper’s conclusions may not depend on it.
- Based: passes — The paper gives a reason why it holds.
Probably not a substantial claim. The paper’s conclusions may not depend on it.
- The authors state this as an assumption: Knowledge-free prompts isolate architectural effects from pretrained priors.
What the paper did — it cites no source for this, so there is none to check. The quote shows it is in the paper.
In the paper
“All models receive identical prompt templates and tool definitions.”
§ Context, Reasoning, and Hierarchy: A Cost-Performance Study of Compound LLM Agent Design in an Adversarial POMDP > Models.
plain- Asserted: passes — The authors put it forward as true.
- Checkable: passes — It can be checked against evidence.
- Load-bearing: passes — The paper’s conclusions depend on it.
- Based: passes — The paper gives a reason why it holds.
Probably not a substantial claim.
A conclusion the paper draws from its own results — it cites no other source for it, so there is none to check. The quote shows it is in the paper.
In the paper
“The state-tracking layer is likely to transfer where observations are structured enough that a program can track what has changed and why, and most steps are routine so history compresses without losing important information.”
§ Context, Reasoning, and Hierarchy: A Cost-Performance Study of Compound LLM Agent Design in an Adversarial POMDP > 6 Discussion
hedgedconditional- Asserted: passes — The authors put it forward as true.
- Checkable: passes — It can be checked against evidence.
- Load-bearing: fails — The paper’s conclusions may not depend on it.
- Based: fails — The paper may give no reason why it holds.
Probably not a substantial claim. The paper’s conclusions may not depend on it. The paper may give no reason why it holds.
A conclusion the paper draws from its own results — it cites no other source for it, so there is none to check. The quote shows it is in the paper.
In the paper
“Performance gains arise from model internal knowledge, runtime context, and deliberation.”
§ Context, Reasoning, and Hierarchy: A Cost-Performance Study of Compound LLM Agent Design in an Adversarial POMDP > Knowledge-Free Initialization.
plaindirect- Asserted: passes — The authors put it forward as true.
- Checkable: passes — It can be checked against evidence.
- Load-bearing: passes — The paper’s conclusions depend on it.
- Based: fails — The paper may give no reason why it holds.
Probably not a substantial claim. The paper may give no reason why it holds. It may state two separate claims as one.
- The authors state this as an assumption: Models' internal knowledge may include information about CAGE-2 acquired during pre-training.
None of the sources cited for this claim could be matched to a paper in Crossref, so there is nothing to check it against.
In the paper
“The defender chooses from five actions (Monitor, Analyse, Remove, Restore, Decoy) with asymmetric costs.”
§ Context, Reasoning, and Hierarchy: A Cost-Performance Study of Compound LLM Agent Design in an Adversarial POMDP > 2 Background & Problem Definition
What the sources say
- Not matchedcites [19]
Couldn’t be matched to a paper in Crossref, so it can’t be checked.
- Not matchedcites [22]
Couldn’t be matched to a paper in Crossref, so it can’t be checked.
plain- Asserted: passes — The authors put it forward as true.
- Checkable: passes — It can be checked against evidence.
- Load-bearing: fails — The paper’s conclusions may not depend on it.
- Based: passes — The paper gives a reason why it holds.
Probably not a substantial claim. The paper’s conclusions may not depend on it.
- Not matched
None of the sources cited for this claim could be matched to a paper in Crossref, so there is nothing to check it against.
In the paper
“The attacker advances one stage per step and selects new targets based on reachability.”
§ Context, Reasoning, and Hierarchy: A Cost-Performance Study of Compound LLM Agent Design in an Adversarial POMDP > Additional information
What the sources say
- Not matchedcites [19]
Couldn’t be matched to a paper in Crossref, so it can’t be checked.
- Not matchedcites [22]
Couldn’t be matched to a paper in Crossref, so it can’t be checked.
plaindirect- Asserted: passes — The authors put it forward as true.
- Checkable: passes — It can be checked against evidence.
- Load-bearing: fails — The paper’s conclusions may not depend on it.
- Based: passes — The paper gives a reason why it holds.
Probably not a substantial claim. The paper’s conclusions may not depend on it. It may state two separate claims as one.
- Not matched
What the paper did — it cites no source for this, so there is none to check. The quote shows it is in the paper.
In the paper
“All models use deterministic decoding (temperature 0 or provider minimum).”
§ Context, Reasoning, and Hierarchy: A Cost-Performance Study of Compound LLM Agent Design in an Adversarial POMDP > Additional information
plain- Asserted: passes — The authors put it forward as true.
- Checkable: passes — It can be checked against evidence.
- Load-bearing: fails — The paper’s conclusions may not depend on it.
- Based: passes — The paper gives a reason why it holds.
Probably not a substantial claim. The paper’s conclusions may not depend on it.
None of the sources cited for this claim could be matched to a paper in Crossref, so there is nothing to check it against.
In the paper
“The blue agent (defender) selects one action per step from a five-type repertoire:”
§ Context, Reasoning, and Hierarchy: A Cost-Performance Study of Compound LLM Agent Design in an Adversarial POMDP > Additional information
What the sources say
- Not matchedcites [19]
Couldn’t be matched to a paper in Crossref, so it can’t be checked.
- Not matchedcites [22]
Couldn’t be matched to a paper in Crossref, so it can’t be checked.
plain- Asserted: passes — The authors put it forward as true.
- Checkable: passes — It can be checked against evidence.
- Load-bearing: fails — The paper’s conclusions may not depend on it.
- Based: passes — The paper gives a reason why it holds.
Probably not a substantial claim. The paper’s conclusions may not depend on it.
- Not matched
None of the sources cited for this claim could be matched to a paper in Crossref, so there is nothing to check it against.
In the paper
“Restore incurs an additional fixed penalty at the step it is applied.”
§ Context, Reasoning, and Hierarchy: A Cost-Performance Study of Compound LLM Agent Design in an Adversarial POMDP > Additional information
What the sources say
- Not matchedcites [19]
Couldn’t be matched to a paper in Crossref, so it can’t be checked.
- Not matchedcites [22]
Couldn’t be matched to a paper in Crossref, so it can’t be checked.
plaindirect- Asserted: passes — The authors put it forward as true.
- Checkable: passes — It can be checked against evidence.
- Load-bearing: fails — The paper’s conclusions may not depend on it.
- Based: passes — The paper gives a reason why it holds.
Probably not a substantial claim. The paper’s conclusions may not depend on it.
- Not matched
None of the sources cited for this claim could be matched to a paper in Crossref, so there is nothing to check it against.
In the paper
“The simulated network comprises 13 hosts organized into three subnets: User (User0-User4, 5 hosts), Enterprise (Enterprise0-Enterprise2 plus a single Enterprise Server, 4 hosts), and Operational (Op_Host0-Op_Host2, Op_Server0, 4 hosts).”
§ Context, Reasoning, and Hierarchy: A Cost-Performance Study of Compound LLM Agent Design in an Adversarial POMDP > Additional information
What the sources say
- Not matchedcites [19]
Couldn’t be matched to a paper in Crossref, so it can’t be checked.
- Not matchedcites [22]
Couldn’t be matched to a paper in Crossref, so it can’t be checked.
plain- Asserted: passes — The authors put it forward as true.
- Checkable: passes — It can be checked against evidence.
- Load-bearing: fails — The paper’s conclusions may not depend on it.
- Based: passes — The paper gives a reason why it holds.
Probably not a substantial claim. The paper’s conclusions may not depend on it. It may state two separate claims as one.
- Not matched
None of the sources cited for this claim could be matched to a paper in Crossref, so there is nothing to check it against.
In the paper
“The scripted policy is fixed across all experiments; no adaptive adversary is used.”
§ Context, Reasoning, and Hierarchy: A Cost-Performance Study of Compound LLM Agent Design in an Adversarial POMDP > Additional information
What the sources say
- Not matchedcites [19]
Couldn’t be matched to a paper in Crossref, so it can’t be checked.
- Not matchedcites [22]
Couldn’t be matched to a paper in Crossref, so it can’t be checked.
plain- Asserted: passes — The authors put it forward as true.
- Checkable: passes — It can be checked against evidence.
- Load-bearing: passes — The paper’s conclusions depend on it.
- Based: passes — The paper gives a reason why it holds.
Probably not a substantial claim. It may state two separate claims as one.
- Not matched
None of the sources cited for this claim could be matched to a paper in Crossref, so there is nothing to check it against.
In the paper
“The red agent follows a scripted kill chain that progresses through five stages: Discovery (scanning for reachable hosts), Access (exploiting vulnerabilities to gain initial foothold), Lateral Movement (pivoting across subnets), Privilege Escalation (gaining root/admin access), and Impact (compromising high-value targets for maximum penalty).”
§ Context, Reasoning, and Hierarchy: A Cost-Performance Study of Compound LLM Agent Design in an Adversarial POMDP > Additional information
What the sources say
- Not matchedcites [19]
Couldn’t be matched to a paper in Crossref, so it can’t be checked.
- Not matchedcites [22]
Couldn’t be matched to a paper in Crossref, so it can’t be checked.
plain- Asserted: passes — The authors put it forward as true.
- Checkable: passes — It can be checked against evidence.
- Load-bearing: fails — The paper’s conclusions may not depend on it.
- Based: passes — The paper gives a reason why it holds.
Probably not a substantial claim. The paper’s conclusions may not depend on it.
- Not matched
None of the sources cited for this claim could be matched to a paper in Crossref, so there is nothing to check it against.
In the paper
“The maximum cumulative return (perfect defense) is 0; all configurations operate in the negative-return regime.”
§ Context, Reasoning, and Hierarchy: A Cost-Performance Study of Compound LLM Agent Design in an Adversarial POMDP > Additional information
What the sources say
- Not matchedcites [19]
Couldn’t be matched to a paper in Crossref, so it can’t be checked.
- Not matchedcites [22]
Couldn’t be matched to a paper in Crossref, so it can’t be checked.
plain- Asserted: passes — The authors put it forward as true.
- Checkable: passes — It can be checked against evidence.
- Load-bearing: fails — The paper’s conclusions may not depend on it.
- Based: passes — The paper gives a reason why it holds.
Probably not a substantial claim. The paper’s conclusions may not depend on it. It may state two separate claims as one.
- Not matched
None of the sources cited for this claim could be matched to a paper in Crossref, so there is nothing to check it against.
In the paper
“Early intervention is rewarded because attacker progress compounds: a compromised User host enables lateral movement to Enterprise, then to Operational targets where penalties are highest.”
§ Context, Reasoning, and Hierarchy: A Cost-Performance Study of Compound LLM Agent Design in an Adversarial POMDP > Additional information
What the sources say
- Not matchedcites [19]
Couldn’t be matched to a paper in Crossref, so it can’t be checked.
- Not matchedcites [22]
Couldn’t be matched to a paper in Crossref, so it can’t be checked.
plaindirect- Asserted: passes — The authors put it forward as true.
- Checkable: passes — It can be checked against evidence.
- Load-bearing: passes — The paper’s conclusions depend on it.
- Based: passes — The paper gives a reason why it holds.
Probably not a substantial claim. It may state two separate claims as one.
- Not matched
None of the sources cited for this claim could be matched to a paper in Crossref, so there is nothing to check it against.
In the paper
“Each episode runs for 𝑇 = 30 steps.”
§ Context, Reasoning, and Hierarchy: A Cost-Performance Study of Compound LLM Agent Design in an Adversarial POMDP > Additional information
What the sources say
- Not matchedcites [19]
Couldn’t be matched to a paper in Crossref, so it can’t be checked.
- Not matchedcites [22]
Couldn’t be matched to a paper in Crossref, so it can’t be checked.
plain- Asserted: passes — The authors put it forward as true.
- Checkable: passes — It can be checked against evidence.
- Load-bearing: fails — The paper’s conclusions may not depend on it.
- Based: passes — The paper gives a reason why it holds.
Probably not a substantial claim. The paper’s conclusions may not depend on it.
- Not matched
None of the sources cited for this claim could be matched to a paper in Crossref, so there is nothing to check it against.
In the paper
“Op_Server0 is the attacker's ultimate high-value target.”
§ Context, Reasoning, and Hierarchy: A Cost-Performance Study of Compound LLM Agent Design in an Adversarial POMDP > Additional information
What the sources say
- Not matchedcites [19]
Couldn’t be matched to a paper in Crossref, so it can’t be checked.
- Not matchedcites [22]
Couldn’t be matched to a paper in Crossref, so it can’t be checked.
plain- Asserted: passes — The authors put it forward as true.
- Checkable: passes — It can be checked against evidence.
- Load-bearing: fails — The paper’s conclusions may not depend on it.
- Based: passes — The paper gives a reason why it holds.
Probably not a substantial claim. The paper’s conclusions may not depend on it.
- Not matched
The authors state this as an assumption.
Models' internal knowledge may include information about CAGE-2 acquired during pre-training.
“Models' internal knowledge may include information about CAGE-2 acquired during pre-training.”
The paper relies on this without support.
Token count correlates with latency.
“We use total number of tokens per episode (prompt + completion) as the primary cost metric, mapping directly to billed usage and correlating with latency.”
The paper relies on this without support.
The public CAGE-2 leaderboard reference values are comparable to the study's setting.
“To ground the reward scale, we reference the public CAGE-2 leaderboard [22] (30-step, B_line setting).”
The authors state this as an assumption.
Token counts are a valid proxy for cost in comparing configurations.
“Token counts proxy cost but do not capture latency or pricing”
The authors state this as an assumption.
Knowledge-free prompts isolate architectural effects from pretrained priors.
“knowledge-free prompts isolate architectural effects without fully disentangling pretrained priors.”
The authors state this as an assumption.
The cumulative activation order of deliberation tools is a valid representation of deliberation depth.
“Deliberation tools are tested only in cumulative activation order; independent activation may yield different interaction patterns.”
Self-check
Percentages, sums and reported differences re-computed from the paper’s own numbers.
Each contradiction between two passages listed here was confirmed by an independent check.
Rated minor: it would not touch a result — a value no result rests on, a p-value that stays on the same side of the significance level, or a conflict that is clerical, resolved elsewhere in the paper, or outside its own findings.
In the paper
§ Context, Reasoning, and Hierarchy: A Cost-Performance Study of Compound LLM Agent Design in an Adversarial POMDP > 5.4 Robustness, Variance, and Tail Risk
“G2.5FL fails catastrophically (> 48%) across all configurations”
§ Context, Reasoning, and Hierarchy: A Cost-Performance Study of Compound LLM Agent Design in an Adversarial POMDP > Contrast: Step 18 (hier-base).
“| +critique | 6.0% | 32.0% | 12.0% | 20.0% | 48.0% | 12.0% |”
Rated minor: it would not touch a result — a value no result rests on, a p-value that stays on the same side of the significance level, or a conflict that is clerical, resolved elsewhere in the paper, or outside its own findings.
In the paper
§ Context, Reasoning, and Hierarchy: A Cost-Performance Study of Compound LLM Agent Design in an Adversarial POMDP > F Token Consumption
“where G = 225+𝐺 converts the non-positive episodic return 𝐺 into a non-negative "defense score"”
§ Context, Reasoning, and Hierarchy: A Cost-Performance Study of Compound LLM Agent Design in an Adversarial POMDP > Contrast: Step 18 (hier-base).
“obs+hist 75.3 -224.8 63.3 -224.7 85.5 -225.3 71.7 -224.8 69.4 -229.5 67.2 -223.8”
Citations
Cites
Chain-Of-Thought Prompting Elicits Reasoning in Large Language Models
Wei, J., Wang, X., Schuurmans, D., Bosma, M., Ichter, B., Xia, F., Chi, E., Le, Q. V., & Zhou, D. (2022) · Advances in Neural Information Processing Systems 35 · doi:10.52202/068431-1800 · Cited by 4,505
Chain-of-Thought Prompting Elicits Reasoning in Large Language Models
Wei, J., Wang, X., Schuurmans, D., Bosma, M., Ichter, B., Xia, F., Chi, E., Le, Q., & Zhou, D. (2022) · arXiv · doi:10.48550/arxiv.2201.11903 · Cited by 4,263
Self-Refine: Iterative Refinement with Self-Feedback
Madaan, A., Tandon, N., Gupta, P., Hallinan, S., Gao, L., Wiegreffe, S., Alon, U., Dziri, N., Prabhumoye, S., Yang, Y., et al. (2023) · arXiv · doi:10.48550/arxiv.2303.17651 · Cited by 2,314
Large language models are zero-shot reasoners
Kojima, T., Gu, S. (., Reid, M., Matsuo, Y., & Iwasawa, Y. (2022) · Advances in Neural Information Processing Systems 35 · doi:10.52202/068431-1613 · Cited by 2,013
Large Language Models are Zero-Shot Reasoners
Kojima, T., Gu, S. S., Reid, M., Matsuo, Y., & Iwasawa, Y. (2022) · arXiv · doi:10.48550/arxiv.2205.11916 · Cited by 2,013
Reflexion: Language Agents with Verbal Reinforcement Learning
Shinn, N., Cassano, F., Berman, E., Gopinath, A., Narasimhan, K., & Yao, S. (2023) · arXiv · doi:10.48550/arxiv.2303.11366 · Cited by 1,087
Large Language Models Cannot Self-Correct Reasoning Yet
Huang, J., Chen, X., Mishra, S., Zheng, H. S., Yu, A. W., Song, X., & Zhou, D. (2023) · arXiv · doi:10.48550/arxiv.2310.01798 · Cited by 712
Multi-Agent Collaboration Mechanisms: A Survey of LLMs
Tran, K.-T., Dao, D., Nguyen, M.-D., Pham, Q.-V., O'Sullivan, B., & Nguyen, H. D. (2025) · arXiv · doi:10.48550/arxiv.2501.06322 · Cited by 680
ReAct: Synergizing Reasoning and Acting in Language Models
Yao, S., Zhao, J., Yu, D., Du, N., Shafran, I., Narasimhan, K., & Cao, Y. (2022) · arXiv · doi:10.48550/arxiv.2210.03629 · Cited by 608
Agentic Context Engineering: Evolving Contexts for Self-Improving Language Models
Zhang, Q., Hu, C., Upasani, S., Ma, B., Hong, F., Kamanuru, V., Rainton, J., Wu, C., Ji, M., Li, H., et al. (2025) · arXiv · doi:10.48550/arxiv.2510.04618 · Cited by 370
Measuring and Narrowing the Compositionality Gap in Language Models
Press, O., Zhang, M., Min, S., Schmidt, L., Smith, N., & Lewis, M. (2023) · Findings of the Association for Computational Linguistics: EMNLP 2023 · doi:10.18653/v1/2023.findings-emnlp.378 · Cited by 303
Towards a Science of Scaling Agent Systems
Kim, Y., Gu, K., Park, C., Park, C., Schmidgall, S., Heydari, A. A., Yan, Y., Zhang, Z., Zhuang, Y., Liu, Y., et al. (2025) · arXiv · doi:10.48550/arxiv.2512.08296 · Cited by 197
Self-Reflection in LLM Agents: Effects on Problem-Solving Performance
Renze, M., & Guven, E. (2024) · arXiv · doi:10.48550/arxiv.2405.06682 · Cited by 89
CybORG: A Gym for the Development of Autonomous Cyber AgentsPreprint
Standen, M., Lucas, M., Bowman, D. B., Richer, T. J., Kim, J., & Marriott, D. A. (2021) · arXiv (Cornell University) · doi:10.48550/arxiv.2108.09118 · Cited by 56
On Autonomous Agents in a Cyber Defence EnvironmentPreprint
Kiely, M., Bowman, D. B., Standen, M., & Moir, C. (2023) · arXiv (Cornell University) · doi:10.48550/arxiv.2309.07388 · Cited by 33
Large Language Models are Autonomous Cyber Defenders
Castro, S. R., Campbell, R., Lau, N., Villalobos, O., Duan, J., & Cárdenas, Á. A. (2025) · IEEE Conference on Artificial Intelligence (CAI) · doi:10.1109/cai64502.2025.00195 · Cited by 31
Reward Shaping for Happier Autonomous Cyber Security Agents
Bates, E., Mavroudis, V., & Hicks, C. (2023) · ACM Workshop on Artificial Intelligence and Security (AISec) · doi:10.1145/3605764.3623916 · Cited by 20
Optimal Defender Strategies for CAGE-2 Using Causal Modeling and Tree Search
Hammar, K., Dhir, N., & Stadler, R. (2026) · IEEE Transactions on Network and Service Management · doi:10.1109/tnsm.2026.3735865 · Cited by 20
Leveraging Large Language Models for Autonomous Cyber Defense: Insights from CAGE-2 Simulations
Mohammadi, H., Davis, J. J., & Kiely, M. (2025) · IEEE Intelligent Systems · doi:10.1109/mis.2025.3568209 · Cited by 11
Scaling Large Language Model-based Multi-Agent Collaboration
Qian, C., Xie, Z., Wang, Y., Liu, W., Zhu, K., Xia, H., Dang, Y., Du, Z., Chen, W., Yang, C., et al. (2024) · arXiv · doi:10.48550/arxiv.2406.07155 · Cited by 8
Augmenting Multi-Agent Communication with State Delta Trajectory
Tang, Y., Su, W., Zhou, Y., Liu, Y., Zhang, M., Ma, S., & Ai, Q. (2025) · Conference on Empirical Methods in Natural Language Processing (EMNLP) · doi:10.18653/v1/2025.emnlp-main.518 · Cited by 5
G2CP: A Graph-Grounded Communication Protocol for Verifiable and Efficient Multi-Agent Reasoning
Khaled, K. B., & Monticolo, D. (2026) · Adaptive Agents and Multi-Agents Systems · doi:10.65109/jhfw8307 · Cited by 3
Learning Optimal Defender Strategies for CAGE-2 using a POMDP Model
Le, D. H., & Stadler, R. (2025) · International Conference on Network and Service Management (CNSM) · doi:10.23919/cnsm67658.2025.11297482 · Cited by 1
Cited by
Sorted by citations
What Does Context Compression Cost an Agent? Interaction Costs Unrevealed by Task-Completion MetricsPreprint
Liu, S. (2026) · arXiv (Cornell University) · doi:10.48550/arxiv.2608.16370 · Cited by 3
Bogdanov, I. (2026) · Carleton University's Institutional Repository (MacOdrum Library, Carleton University) · doi:10.22215/etd/2026-17135
Self-citationHELM: Harness Engineering for LLM Decision-Making Agents in Emergency Operations and ManagementPreprint
Shrestha, A., Lu, L., Jia-peng, X. U., & Fan, C. (2026) · SSRN Electronic Journal · doi:10.2139/ssrn.7583670
Metadata
- Authors
- Bogdanov, I., Lung, C.-H., Kunz, T., Gao, J., Taylor, A., & Zaman, M.
- Affiliations
- Carleton University (CA)
- Defence Research and Development Canada (CA)
- Cistel Technology (Canada) (CA)
- Venue
- Proceedings of the ACM Conference on AI and Agentic Systems
- Publisher
- ACM
- Published
- 2026-05-26
- Pages
- 17-45
- OpenAlex
- W7161646776
- Cited by
- 3
- References
- 21
- Citations by year
- 2026: 3
- FWCI
- 4.08
- Type
- conference paper
- Language
- en
- Open access
- green
- arxiv.org
- Licence
- cc-by-nc-nd
- Locations
- ACM Conference on AI and Agentic Systems (CAIS) (publishedVersion)
- arXiv (Cornell University) (submittedVersion, cc-by-nc-nd)
- arXiv (Cornell University)
- Topics
- Physical Sciences › Computer Science › Artificial Intelligence › Adversarial Robustness in Machine Learning
- Physical Sciences › Computer Science › Artificial Intelligence › AI-based Problem Solving and Planning
- Physical Sciences › Computer Science › Computer Networks and Communications › Network Security and Intrusion Detection
- Keywords
- cyber defense, context representation, self-criticism, chain-of-thought prompting, hierarchical task decomposition, React, token cost, cost-performance trade-off, failure mitigation
About these checks
Registry, retraction, Cites and statistics results are computed, not judged, with one exception: a printed reference that no index lists is read once by a model before it counts as a citation error. Claims are extracted by a model and kept only when their quote appears verbatim in the text; each cited source is then checked, with a model’s help, for whether it says what the claim relies on. Those verdicts can be wrong — read the claim’s quote and the cited source before relying on one.
A language model drew the claims from the paper on 2026-11-10, under version 3 of the claim definition (model deepseek-v4.1-flash, prompt extract-v3).
A second model labelled each claim on 2026-11-10 (model jev-1.13-20260917, definition revision gold-guideline-v0.2).
Statistics and arithmetic are recomputed, not judged.
Confidence bands are shown only for fields calibrated on our annotated test set. None is calibrated yet, so no band is shown.
What counts as a claim ›How we measure confidence ›How we check this ›
Are you an author, or do you see a problem with this page? Request a review
