

Local‐ and Global‐Statistics‐Based Active Contour Model for Image Segmentation
Open accessThe DOI matches its Crossref record; 31 of the 31 references it cites were found in a registry or an index.
Abstract
This paper presents a local‐ and global‐statistics‐based active contour model for image segmentation by applying the globally convex segmentation method. We first propose a convex energy functional with a local‐Gaussian‐distribution‐fitting term with spatially varying means and variances and an auxiliary global‐intensity‐fitting term. A weight function that varies dynamically with the location of the image is applied to adjust the weight of the global‐intensity‐fitting term dynamically. The weighted total variation norm is incorporated into the energy functional to detect boundaries easily. The split Bregman method is then applied to minimize the proposed energy functional more efficiently. Our model has been applied to synthetic and real images with promising results. With the local‐Gaussian‐distribution‐fitting term, our model can also handle some texture images. Comparisons with other models show the advantages of our model.
Overview
The claims and statistics of this paper haven’t been checked yet.
Free: it reads the open-access text and checks the first 5 claims that cite a source we can check. Create a free account to check every claim.
Integrity signals
Registry
Cites
Statistics
Figures
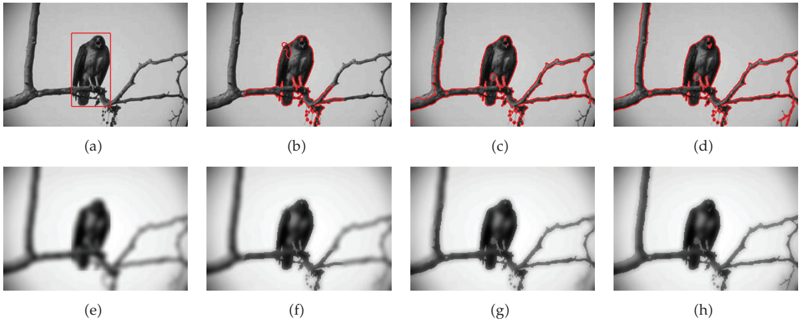
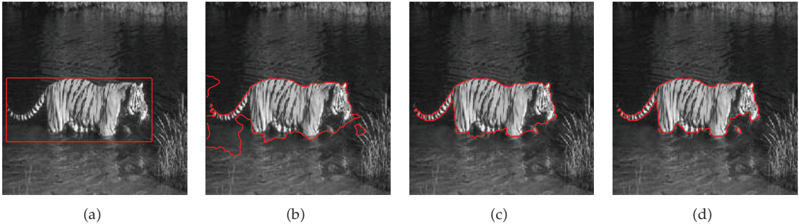
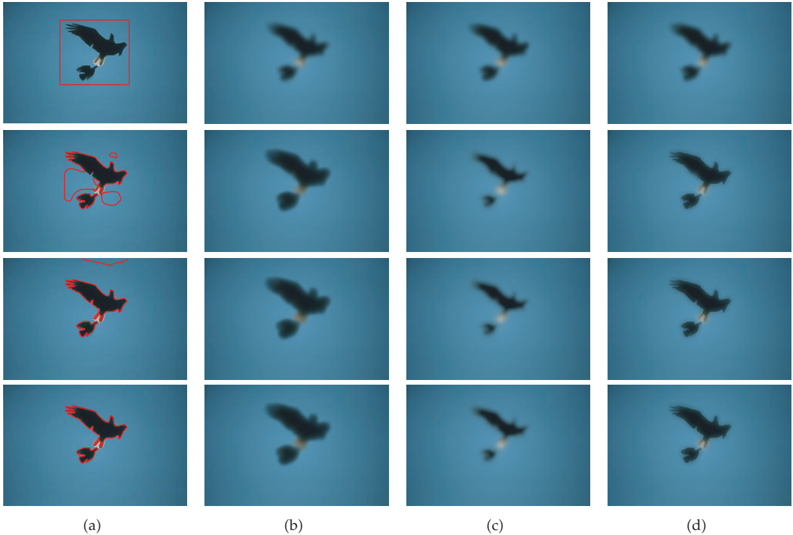
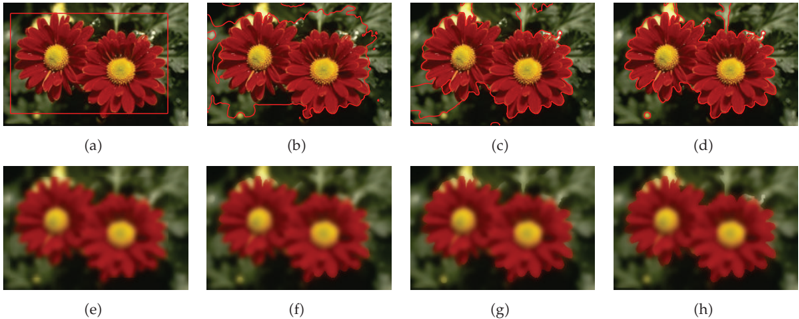


















Verification
Claims the paper makes
The claims and statistics of this paper haven’t been checked yet.
Free: it reads the open-access text and checks the first 5 claims that cite a source we can check. Create a free account to check every claim.
Self-check
Percentages, sums and reported differences re-computed from the paper’s own numbers.
The self-check needs the paper’s full text.
Citations
Cites
Stochastic relaxation, gibbs distributions, and the bayesian restoration of images.
Geman, S., & Geman, D. (1984) · IEEE Transactions on Pattern Analysis and Machine Intelligence · doi:10.1109/tpami.1984.4767596 · Cited by 17,949
Kass, M., Witkin, A., & Terzopoulos, D. (1988) · International Journal of Computer Vision · doi:10.1007/bf00133570 · Cited by 17,070
Chan, T. F., & Vese, L. A. (2001) · IEEE Transactions on Image Processing · doi:10.1109/83.902291 · Cited by 10,304
Caselles, V., Kimmel, R., & Sapiro, G. (1997) · International Journal of Computer Vision · doi:10.1023/a:1007979827043 · Cited by 5,244
Optimal approximations by piecewise smooth functions and associated variational problems
Mumford, D., & Shah, J. (1989) · Communications on Pure and Applied Mathematics · doi:10.1002/cpa.3160420503 · Cited by 5,208
The Split Bregman Method for L1-Regularized Problems
Goldstein, T., & Osher, S. (2009) · SIAM Journal on Imaging Sciences · doi:10.1137/080725891 · Cited by 4,282
Shape modeling with front propagation: a level set approach
Malladi, R., Sethian, J. A., & Vemuri, B. C. (1995) · IEEE Transactions on Pattern Analysis and Machine Intelligence · doi:10.1109/34.368173 · Cited by 3,158
A Multiphase Level Set Framework for Image Segmentation Using the Mumford and Shah Model
Vese, L. A., & Chan, T. F. (2002) · International Journal of Computer Vision · doi:10.1023/a:1020874308076 · Cited by 2,384
An Iterative Regularization Method for Total Variation-Based Image Restoration
Osher, S., Burger, M., Goldfarb, D., Xu, J., & Yin, W. (2005) · Multiscale Modeling & Simulation · doi:10.1137/040605412 · Cited by 1,787
Level Set Evolution without Re-Initialization: A New Variational Formulation
Li, C., Xu, C., Gui, C., & Fox, M. D. (2005) · 2005 IEEE Computer Society Conference on Computer Vision and Pattern Recognition (CVPR'05) · doi:10.1109/cvpr.2005.213 · Cited by 1,783
Research works printed but not linked: 1
- 7. R. Kimmel, A. Amir, and A. Bruckstein, "Finding shortest paths on surfaces using level set propagation," International Journal of Computer Vision, vol. 17, no. 6, pp. 635-640, 1995.
Cited by
Automated Visual Defect Detection for Flat Steel Surface: A Survey
Luo, Q., Fang, X., Liu, L., Yang, C., & Sun, Y. (2020) · IEEE Transactions on Instrumentation and Measurement · doi:10.1109/tim.2019.2963555 · Cited by 559
“ACM is popular in image s e g m e n t a t i o n a s i t c a n a c h i e v e s u b - p i x e l a c c u r a c y o f o b j e c t boundaries [92, 93].”
BackgroundOtsu Based Optimal Multilevel Image Thresholding Using Firefly Algorithm
Raja, N. S. M., Rajinikanth, V., & Latha, K. (2014) · Modelling and Simulation in Engineering · doi:10.1155/2014/794574 · Cited by 165
A performance study of image segmentation techniques
Taneja, A., Ranjan, P., & Ujlayan, A. (2015) · International Conference on Reliability, Infocom Technologies and Optimization (Trends and Future Directions) (ICRITO) · doi:10.1109/icrito.2015.7359305 · Cited by 53
“[9] B. Wu and Y. Yang, "Local-and global-statistics-based active contour model for image segmentation," Mathematical Problems in Engineering, vol. 2012, 2012.”
BackgroundInfluentialUnderwater image restoration: A state‐of‐the‐art review
Fayaz, S., Parah, S. A., Qureshi, G. J., & Kumar, V. (2020) · IET Image Processing · doi:10.1049/ipr2.12041 · Cited by 52
“Picture quality is often influenced by ocular execution of apparatus used for picturing by the din of instruments, prevailing conditions [104], and operations on an image.”
BackgroundAutomated Adjustment of Region-Based Active Contour Parameters Using Local Image Geometry
Mylona, E. A., Savelonas, M. A., & Maroulis, D. (2014) · IEEE Transactions on Cybernetics · doi:10.1109/tcyb.2014.2315293 · Cited by 38
Fang, L., Qiu, T., Liu, Y., & Chen, C. (2018) · Computers & Mathematics with Applications · doi:10.1016/j.camwa.2018.03.029 · Cited by 30
Wang, S., Zou, P., Gong, X., Song, M., Peng, J., & Jiao, J. R. (2023) · Journal of Industrial Information Integration · doi:10.1016/j.jii.2023.100536 · Cited by 25
Fouladivanda, M., Kazemi, K., Helfroush, M. S., & Shakibafard, A. (2018) · Journal of Neuroscience Methods · doi:10.1016/j.jneumeth.2018.07.015 · Cited by 16
Active contour model by combining edge and region information discrete dynamic systems
Wang, Z., & Liu, Y. (2017) · Advances in Mechanical Engineering · doi:10.1177/1687814017692947 · Cited by 16
Variational methods with application to medical image segmentation: A survey
Shu, X., Li, Z., Chang, X., & Yuan, D. (2025) · Neurocomputing · doi:10.1016/j.neucom.2025.130260 · Cited by 16
Structure-preserving surface defect detection for flexible integrated circuit substrates
Zhong, Z., Wang, H., Zhou, C., 康慧, Zhao, J., & Hu, Y. (2026) · Image and Vision Computing · doi:10.1016/j.imavis.2026.106007 · Cited by 15
Yang, Y., Zhao, Y., & Wu, B. (2014) · Journal of Optimization Theory and Applications · doi:10.1007/s10957-014-0597-4 · Cited by 12
Self-citationNew Local Region Based Model for the Segmentation of Medical Images
Badshah, N., Atta, H., Shah, S. İ. A., Attaullah, S., Minallah, N., & Ullah, M. (2020) · IEEE Access · doi:10.1109/access.2020.3026143 · Cited by 11
Automatic Image Segmentation Using Active Contours with Univariate Marginal Distribution
Cruz-Aceves, I., Avina‐Cervantes, J. G., Hernández, J. M. L., García-Hernández, M. G., Torres-Cisneros, M., Estrada-García, H. J., & Hernández-Aguirre, A. (2013) · Mathematical Problems in Engineering · doi:10.1155/2013/419018 · Cited by 11
“In recent years, several techniques have been reported for this purpose including graph cut [1, 2], improved watershed transform [3], suppressed fuzzy c-means [4], supervised fuzzy clustering [5], multithreshold based on differential evolution [6], and active contour model (ACM), which has been applied in different ar…”
A mini review on the design of interactive tool for medical image segmentation
Khaizi, A. S. A., Rosidi, R. A. M., Gan, H., & Sayuti, K. A. (2017) · International Conference on Engineering Technology and Technopreneurship (ICE2T) · doi:10.1109/ice2t.2017.8215985 · Cited by 9
“Invariably, intervention during the initialization of segmentation aims to provide user input through different forms such as free point [12], scribble [13, 14, 15] or contour [16].”
BackgroundHigh speed VLSI architecture for improved region based active contour segmentation technique
Menon, R. V., Kalipatnapu, S., & Chakrabarti, I. (2020) · Integration · doi:10.1016/j.vlsi.2020.11.004 · Cited by 9
Multi-Stage Liver Segmentation in CT Scans Using Gaussian Pseudo Variance Level Set
Zhou, L., Wang, L., Li, W., Lei, B., Mi, J., & Yang, W. (2021) · IEEE Access · doi:10.1109/access.2021.3097387 · Cited by 8
“The combination of local and global constraints is further proposed by some studies [20], [21].”
BackgroundWang, X., Jiang, Z., Li, W., Zarei, R., Huang, G., Ulhaq, A., Yin, X., Zhang, B., Shi, P. J., Guo, M., et al. (2019) · Concurrency and Computation Practice and Experience · doi:10.1002/cpe.5599 · Cited by 7
“Then, its gradient descent flow equation is where Moreover, we can know that, when where 𝛾 is a fixed parameter and C N is the local contrast ratio of an image described in the work of Wu and Yang, 38 which is defined as where N is the size of the local window and is set as 5 in this paper.”
BackgroundAnam, S., Uchino, E., Misawa, H., & Suetake, N. (2013) · IEEE International Workshop on Computational Intelligence and Applications (IWCIA) · doi:10.1109/iwcia.2013.6624782 · Cited by 5
“Evaluating the experiments using a particular set of hand bones radiographs, the proposed method worked well for almost all of the images that we used.”
MethodNiyas, S., Reshma, P., & Thampi, S. M. (2016) · Advances in intelligent systems and computing · doi:10.1007/978-3-319-47952-1_1 · Cited by 5
Brain MR Image Segmentation Based on an Adaptive Combination of Global and Local Fuzzy Energy
Cui, W., Wang, Y., Lei, T., Fan, Y., & Feng, Y. (2013) · Mathematical Problems in Engineering · doi:10.1155/2013/316546 · Cited by 4
A review and proposal of an innovative approach for medical image segmentation
Dahiya, S., & Vijayalakshmi, S. (2017) · International Conference on Computing, Communication and Automation · doi:10.1109/ccaa.2017.8229974 · Cited by 3
“INFORMATION ABOUT DIFFERENT IMAGE SEGMENTATION TECHNIQUES Techniques Author & Ref Year Performance Image Quality measurement Active contour based image segmentation Convex energy function Wu and Yang [18] 2012 A convex optimization function with local Gaussian distributing fitting term with spatially variations of mea…”
MethodRatio- and distribution-metric-based active contours for SAR image segmentation
Tu, S., Yu, L., & Su, Y. (2014) · International Conference on Intelligent Control and Information Processing · doi:10.1109/icicip.2014.7010344 · Cited by 2
Object Segmentation in Texture Images Using Texture Gradient Based Active Contours
Subudhi, P., & Mukhopadhyay, S. (2017) · Lecture notes in computer science · doi:10.1007/978-3-319-69900-4_16 · Cited by 1
An advanced level set method based on Bregman divergence for inhomogeneous image segmentation
Shi, D., Zhu, M., Zhang, Y., & Tian, F. (2017) · International Conference on Machine Learning and Cybernetics · doi:10.1109/icmlc.2017.8108944 · Cited by 1
“The combination of the global and the local information is in principle in favor in solving both the initial sensitivity and the intensity inhomogeneity problems [16].”
BackgroundNew local region-based model for inhomogeneous images with the simplex constraints of landmarks
Saeed, M., Badshah, N., & Atta, H. (2021) · International Conference on Innovative Computing (ICIC) · doi:10.1109/icic53490.2021.9693043 · Cited by 1
Improved segmentation model combining region and edge information for inhomogeneous images
Yang, Y., Zhao, Y., & Wu, B. (2014) · Conference on Information Sciences and Systems · doi:10.1109/ciss.2014.6814165
“Remark 3: In our previous work [11], we did not specify the algorithm solving the proposed minimization problem (2) of our improved model.”
MethodSelf-citationA novel scheme of unsupervised target detection for high-resolution SAR image
Tu, S., Yu, L., & Su, Y. (2014) · International Conference on Signal Processing · doi:10.1109/icosp.2014.7015155
“Where ( ) ( ( )) d = ∇ ∫ Length H x x φ φ Ω is the length term, which has been commonly used for the regularization of the zero level set in order to derive a smooth contour [7]-[12].”
MethodEfficient level set formulation for segmentation and correction with application to medical images
Yang, Y., Jia, W., & Shu, X. (2019) · International Conference on Digital Image Processing · doi:10.1117/12.2540075
“also apply the split Bregman method to solve the multi-phase CV model[12] and the local- and gobal-statistics (LGS) model[13] to improve their computational efficiency.”
MethodSelf-citationKuwar, P. S., & Sinha, S. (2018) · Journal of Emerging Technologies and Innovative Research
Ultrasound image segmentation using local statistics with an adaptative scale selection
Yang, Q. (2013) · theses.fr (ABES) · doi:10.70675/34b98f96z263az42d8z9702z42408aa884c9
“Alternatively, authors of [216, 205] proposed that the contribution of global energy term ω could be de ned dynamically by local contrast of the image.”
Metadata
- Authors
- Wu, B., & Yang, Y.
- Affiliations
- Harbin Institute of Technology (CN)
- Corresponding author
- Yang, Yunyun
- Venue
- Mathematical Problems in Engineering
- Publisher
- Wiley
- Published
- 2012-01
- Volume
- 2012
- Issue
- 1
- ISSN
- 1024-123X (ISSN-L)
- 1563-5147
- OpenAlex
- W2074971040
- Cited by
- 30
- References
- 31
- Citations by year
- 2026: 1 · 2025: 1 · 2023: 1 · 2021: 2 · 2020: 4 · 2019: 2 · 2018: 3 · 2017: 5 · 2016: 1 · 2015: 1 · 2014: 6 · 2013: 3
- FWCI
- 3.29
- Type
- journal article
- Language
- en
- Open access
- hybrid
- doi.org
- Locations
- Mathematical Problems in Engineering (publishedVersion, cc-by)
- RePEc: Research Papers in Economics (submittedVersion)
- DOAJ (DOAJ: Directory of Open Access Journals) (submittedVersion, cc-by-sa)
- Funders
- Natural Science Foundation of Heilongjiang Province (A200909)
- Topics
- Physical Sciences › Computer Science › Computer Vision and Pattern Recognition › Medical Image Segmentation Techniques
- Physical Sciences › Computer Science › Computer Vision and Pattern Recognition › Image and Signal Denoising Methods
- Physical Sciences › Computer Science › Computer Vision and Pattern Recognition › Advanced Neural Network Applications
- Keywords
- snakes, image segmentation, convex energy functional, weighted total variation, split Bregman method, boundary detection, texture images
About these checks
Registry, retraction, Cites and statistics results are computed, not judged, with one exception: a printed reference that no index lists is read once by a model before it counts as a citation error. Claims are extracted by a model and kept only when their quote appears verbatim in the text; each cited source is then checked, with a model’s help, for whether it says what the claim relies on. Those verdicts can be wrong — read the claim’s quote and the cited source before relying on one.
Statistics and arithmetic are recomputed, not judged.
Confidence bands are shown only for fields calibrated on our annotated test set. None is calibrated yet, so no band is shown.
What counts as a claim ›How we measure confidence ›How we check this ›
Are you an author, or do you see a problem with this page? Request a review
Data sources
Bibliographic data: Semantic Scholar, OpenAlex, Crossref.
Contains information from the Semantic Scholar Academic Graph Datasets, made available under the ODC Attribution License (ODC-BY 1.0).
Semantic Scholar’s data is described in: Kinney, R., et al. (2023). The Semantic Scholar Open Data Platform. arXiv:2301.10140.
