

Non-obvious Problems in Clark Electrode Application at Elevated Temperature and Ways of Their Elimination
Open accessThe DOI matches its Crossref record; 18 of the 19 references it cites were found in a registry or an index.
Abstract
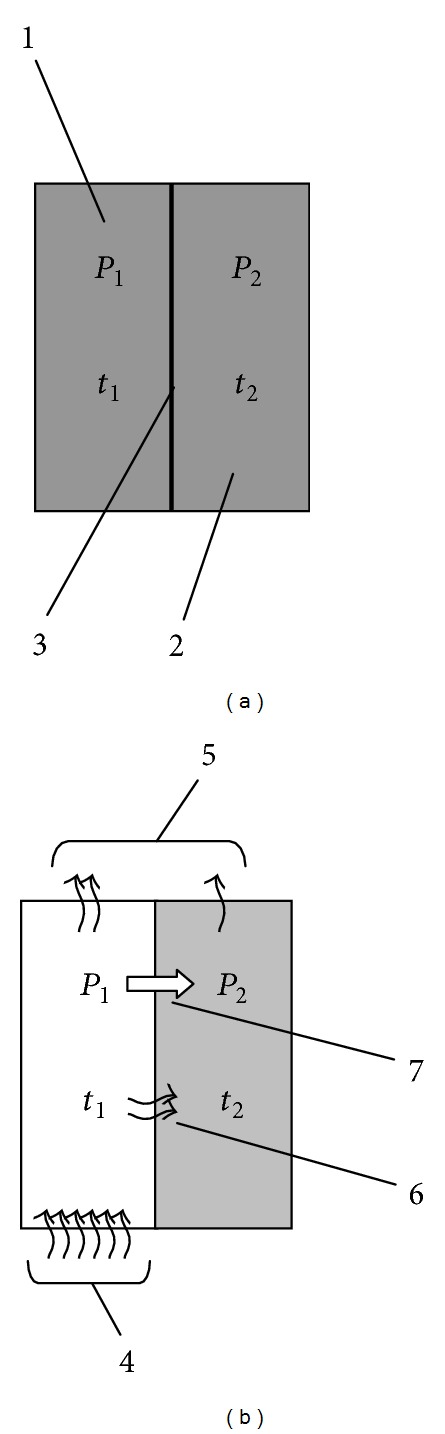
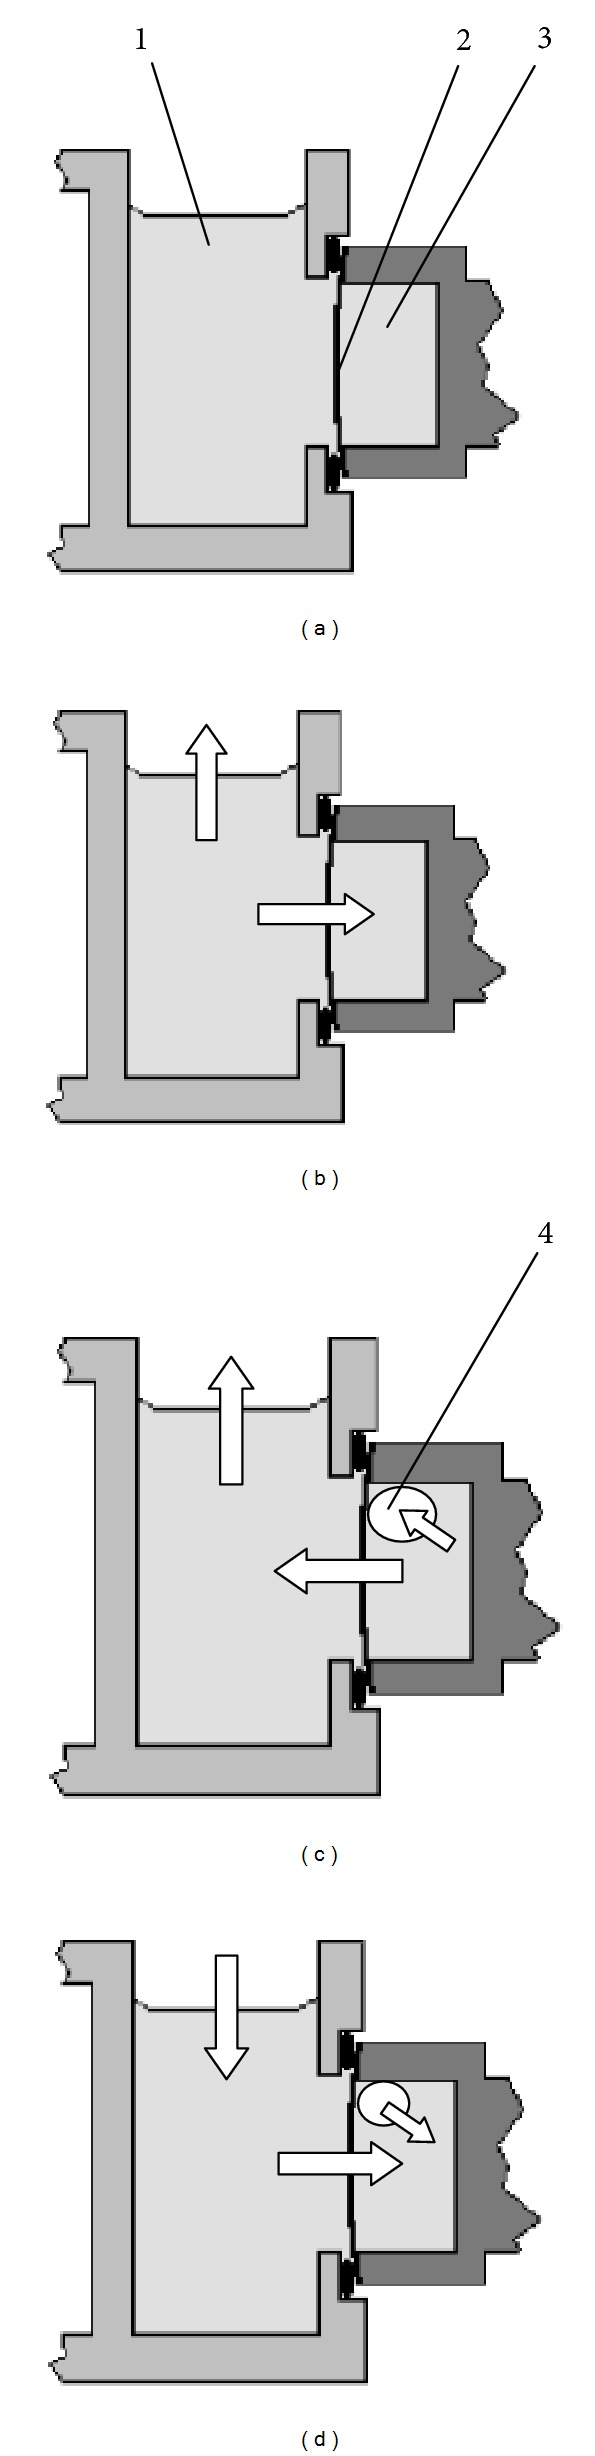
Well-known cause of frequent failures of closed oxygen sensors is the appearance of gas bubbles in the electrolyte. The problem is traditionally associated with insufficient sealing of the sensor that is not always true. Study of a typical temperature regime of measurement system based on Clark sensor showed that spontaneous release of the gas phase is a natural effect caused by periodic warming of the sensor to a temperature of the test liquid. The warming of the sensor together with the incubation medium causes oversaturation of electrolyte by dissolved gases and the allocation of gas bubbles. The lower rate of sensor heating in comparison with the medium reduces but does not eliminate the manifestation of this effect. It is experimentally established, that with each cycle of heating of measuring system up to 37°C followed by cooling the volume of gas phase in the electrolyte (KCl; 60 g/L; 400 μ L) increased by 0.6 μ L approximately. Thus, during just several cycles it can dramatically degrade the characteristics of the sensor. A method was developed in which the oxygen sensor is heated in contact with the liquid, (depleted of dissolved gases), allowing complete exclusion of the above-mentioned effect.
Overview
The claims and statistics of this paper haven’t been checked yet.
Free: it reads the open-access text and checks the first 5 claims that cite a source we can check. Create a free account to check every claim.
Integrity signals
Registry
Cites
Statistics
Figures



Verification
Claims the paper makes
The claims and statistics of this paper haven’t been checked yet.
Free: it reads the open-access text and checks the first 5 claims that cite a source we can check. Create a free account to check every claim.
Claims other papers make about this one
Each is checked against this paper’s own text: does it say what the citing paper says it does?
The source backs part of the claim, not all of it — or backs it for a different population, condition or comparison.
In the citing paper
“It should be noted that there is little consensus in the literature on the most appropriate method to use due to recently documented difficulties/limitations of these methods [23].”
From Direct Measurements of Oxygen Gradients in Spheroid Culture System Using Electron Parametric Resonance Oximetry (2016) · cites this paper as [23]
Experimental — accuracy not yet measuredThe source backs part of the claim, not all of it — or backs it for a different population, condition or comparison.
In the citing paper
“Whilst there are a variety of methods available for determination of oxygen within spheroids, historically it has been acknowledged that the most commonly used method (e.g. micro-electrodes) suffer from several inherent limitations leading to unreliable results (oxygen production/consumption by electrode, signal drift, media requirements etc. [23]).”
From Direct Measurements of Oxygen Gradients in Spheroid Culture System Using Electron Parametric Resonance Oximetry (2016) · cites this paper as [23]
Experimental — accuracy not yet measured
Self-check
Percentages, sums and reported differences re-computed from the paper’s own numbers.
The self-check needs the paper’s full text.
Citations
Cites
Heat and Mass Transfer: Fundamentals & Applications
Çengel, Y. A., & Ghajar, A. J. (2011) · Virtual Defense Library (Ministerio de Defensa) · Cited by 1,248
Pesta, D., & Gnaiger, E. (2012) · Methods in Molecular Biology · doi:10.1007/978-1-61779-382-0_3 · Cited by 987 · cited 2×
“…in Chemistry Volume 2013, Article ID 249752, 8 pages http://dx.doi.org/10.1155/2013/249752 Research Article Non-obvious Problems in Clark Electrode Application at Elevated Temperature and Ways of Their Elimination M. V. Miniaev, M. B. Belyakova, N. V. Kostiuk, D. V. Leshchenko, and T. A.…”
BackgroundInfluentialContinuous Recording of Blood Oxygen Tensions by Polarography
Clark, L. C., Wolf, R., Granger, D., & Taylor, Z. (1953) · Journal of Applied Physiology · doi:10.1152/jappl.1953.6.3.189 · Cited by 886 · cited 1×
“A method was developed in which the oxygen sensor is heated in contact with the liquid, (depleted of dissolved gases), allowing complete exclusion of the above-mentioned effect.”
MethodEstimation of gas solubilities in salt solutions at temperatures from 273 K to 363 K
Weisenberger, S., & Schumpe, A. (1996) · AIChE Journal · doi:10.1002/aic.690420130 · Cited by 394
A galvanic cell oxygen analyzer
Mancy, K. H., Okun, D. A., & Reilley, C. N. (1962) · Journal of Electroanalytical Chemistry (1959) · doi:10.1016/0022-0728(62)80035-7 · Cited by 142
Gnaiger, E. (2008) · Wiley eBooks · doi:10.1002/9780470372531.ch12 · Cited by 121
Gundersen, J. K., Ramsing, N. B., & Glud, R. N. (1998) · Limnology and Oceanography · doi:10.4319/lo.1998.43.8.1932 · Cited by 102
Isoflurane preconditioning uncouples mitochondria and protects against hypoxia-reoxygenation
Ljubković, M., Mio, Y., Marinović, J., Stadnicka, A., Warltier, D. C., Bosnjak, Z. J., & Bienengraeber, M. (2007) · American Journal of Physiology-Cell Physiology · doi:10.1152/ajpcell.00221.2006 · Cited by 88 · cited 1×
“It can be assumed that this is the particular reason why experiments with cells and mitochondria of warm-blooded organisms are usually conducted at room temperature [8, 9], regardless of the fact that ensuring stability at room temperature is”
BackgroundMeasurement Uncertainty Estimation in Amperometric Sensors: A Tutorial Review
Helm, I., Jalukse, L., & Leito, I. (2010) · Sensors · doi:10.3390/s100504430 · Cited by 78
Online monitoring of BALB/3T3 metabolism and adhesion with multiparametric chip-based system
Ceriotti, L., Kob, A., Drechsler, S., Ponti, J., Thedinga, E., Colpo, P., Ehret, R., & Rossi, F. (2007) · Analytical Biochemistry · doi:10.1016/j.ab.2007.07.014 · Cited by 58 · cited 1×
“…Methods in Chemistry Volume 2013, Article ID 249752, 8 pages http://dx.doi.org/10.1155/2013/249752 Research Article Non-obvious Problems in Clark Electrode Application at Elevated Temperature and Ways of Their Elimination M. V. Miniaev, M. B. Belyakova, N. V. Kostiuk, D. V. Leshchenko, and T. A.…”
BackgroundInfluential
Research works printed but not linked: 4
- Forstner H Gnaiger E Polarographic Oxygen Sensors: Aquatic Andphysiological Applications 1983 New York, NY, USA Springer
- Lee FF Comprehensive analysis, Henry’s law constant determination, and photocatalytic degradation of polychlorinated biphenyls (PCBs) and/or other persistent organic pollutants, POPs [Ph.D. dissertation] 2007 State University of New York at Albany
- Smith FL Harvey AH Avoid common pitfalls when using Henry’s law Chemical Engineering Progress 2007 103 9 33 39 2-s2.0-41849099965
- Green DW Perry RH Perry's Chemical Engineers' Handbook 1984 6th edition McGraw-Hill
Cited by
ROS in Platelet Biology: Functional Aspects and Methodological Insights
Masselli, E., Pozzi, G., Vaccarezza, M., Mirandola, P., Galli, D., Vitale, M., Carubbi, C., & Gobbi, G. (2020) · International Journal of Molecular Sciences · doi:10.3390/ijms21144866 · Cited by 229
Langan, L. M., Dodd, N. J. F., Owen, S. F., Purcell, W. M., Jackson, S. K., & Jha, A. N. (2016) · PLOS ONE · doi:10.1371/journal.pone.0149492 · Cited by 104
“It should be noted that there is little consensus in the literature on the most appropriate method to use due to recently documented difficulties/ limitations of these methods [23].”
Adetunji, C. O., Nwankwo, W., Ukhurebor, K. E., Olayinka, A. S., & Makinde, A. S. (2021) · Concepts and strategies in plant sciences · doi:10.1007/978-3-030-66165-6_9 · Cited by 33
Phosphorescent Microneedle Array for the Measurement of Oxygen Partial Pressure in Tissue
Müller, M., Cascales, J. P., Marks, H. L., Evers, M., Manstein, D., & Evans, C. L. (2022) · ACS Sensors · doi:10.1021/acssensors.2c01775 · Cited by 29
Klowss, J. J., Browning, A. P., Murphy, R. J., Carr, E. J., Plank, M. J., Gunasingh, G., Haass, N. K., & Simpson, M. J. (2022) · Journal of The Royal Society Interface · doi:10.1098/rsif.2021.0903 · Cited by 34
Metadata
- Authors
- Miniaev, M. V., Belyakova, M. B., Kostiuk, N. V., Leshchenko, D. V., & Fedotova, T. A.
- Affiliations
- Tver State Medical University (RU)
- Research Center, Department of Chemistry and Biochemistry, and Department of Biology, Tver State Medical Academy, 4 Sovetskaya Street, Tver 170100, Russia
- Corresponding author
- Belyakova, M. B.
- Venue
- Journal of Analytical Methods in Chemistry
- Publisher
- Hindawi Limited
- Published
- 2013
- Volume
- 2013
- Pages
- 1-8
- ISSN
- 2090-8865 (ISSN-L)
- 2090-8873
- PMC
- PMC3747604
- OpenAlex
- W2144651571
- Cited by
- 18
- References
- 19
- Citations by year
- 2025: 1 · 2024: 2 · 2023: 1 · 2022: 3 · 2021: 3 · 2020: 1 · 2019: 1 · 2018: 2 · 2017: 2 · 2016: 1 · 2014: 1
- FWCI
- 0.52
- Type
- journal article
- Language
- en
- Open access
- gold
- doi.org
- Locations
- Journal of Analytical Methods in Chemistry (publishedVersion, cc-by)
- Europe PMC (PubMed Central) (publishedVersion, cc-by)
- PubMed Central (publishedVersion, cc-by)
- PubMed (publishedVersion)
- DOAJ (DOAJ: Directory of Open Access Journals) (submittedVersion, cc-by-sa)
- Topics
- Physical Sciences › Chemistry › Analytical Chemistry › Analytical Chemistry and Sensors
- Physical Sciences › Chemistry › Analytical Chemistry › Electrochemical sensors and biosensors
- Physical Sciences › Environmental Science › Waste Management and Disposal › Water Quality Monitoring and Analysis
- Keywords
- Clark electrode, oxygen sensors, high-temperature measurement, sensor faults, dissolved gases, potassium chloride electrolyte
About these checks
Registry, retraction, Cites and statistics results are computed, not judged, with one exception: a printed reference that no index lists is read once by a model before it counts as a citation error. Claims are extracted by a model and kept only when their quote appears verbatim in the text; each cited source is then checked, with a model’s help, for whether it says what the claim relies on. Those verdicts can be wrong — read the claim’s quote and the cited source before relying on one.
Statistics and arithmetic are recomputed, not judged.
Confidence bands are shown only for fields calibrated on our annotated test set. None is calibrated yet, so no band is shown.
What counts as a claim ›How we measure confidence ›How we check this ›
Are you an author, or do you see a problem with this page? Request a review
Data sources
Bibliographic data: Semantic Scholar, OpenAlex, Crossref.
Contains information from the Semantic Scholar Academic Graph Datasets, made available under the ODC Attribution License (ODC-BY 1.0).
Semantic Scholar’s data is described in: Kinney, R., et al. (2023). The Semantic Scholar Open Data Platform. arXiv:2301.10140.
