

The DOI matches its Crossref record.
A 25 kW, 25 kHz Induction Heating Power Supply for MOVPE System Using L-LC Resonant Inverter
Abstract
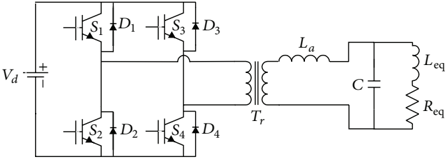
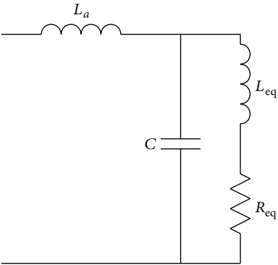
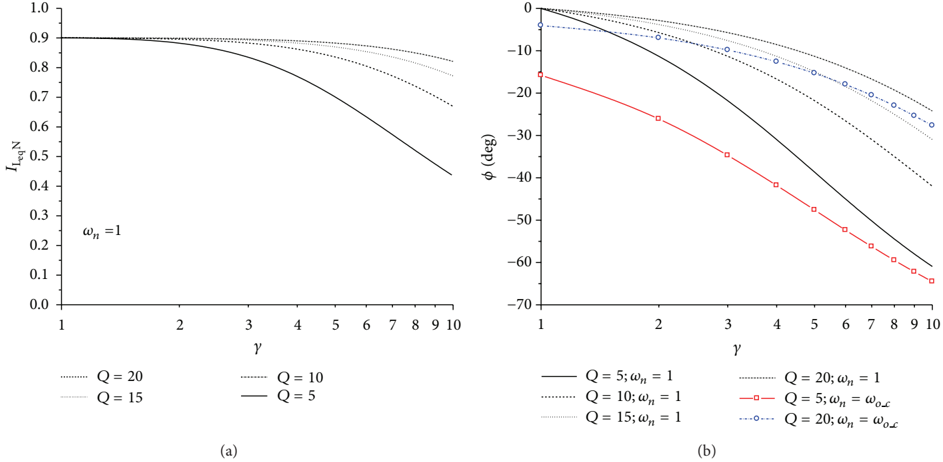
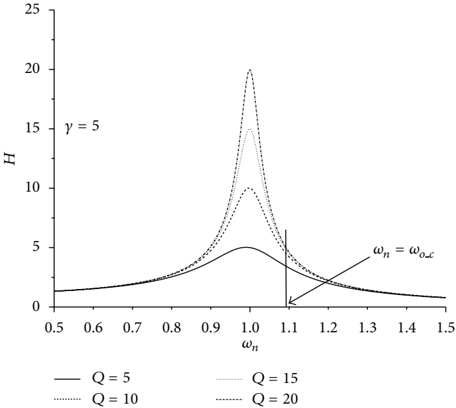
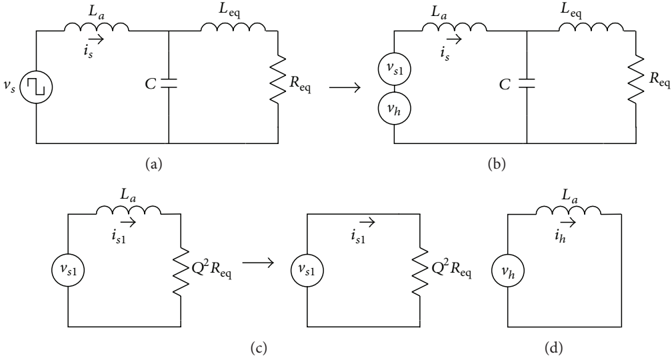
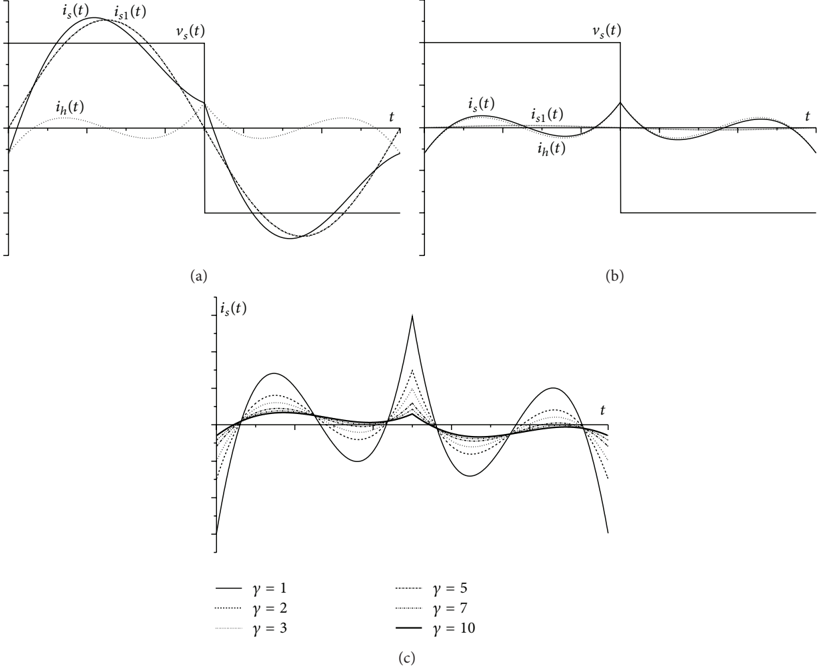
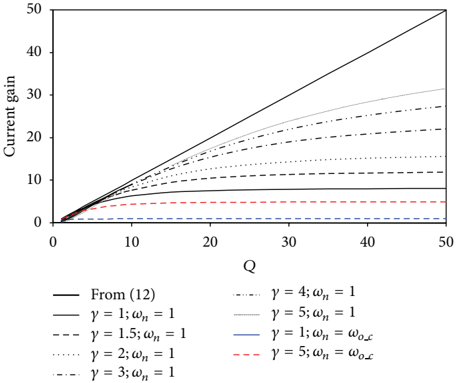
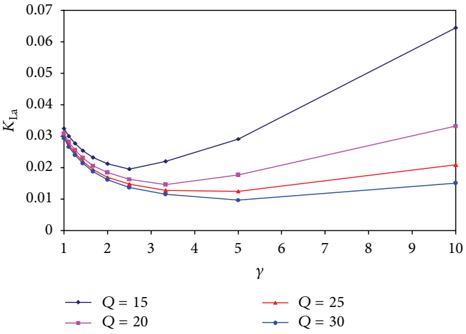
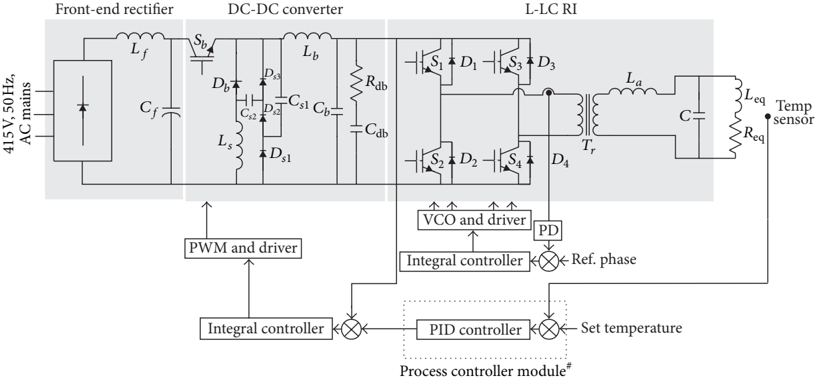
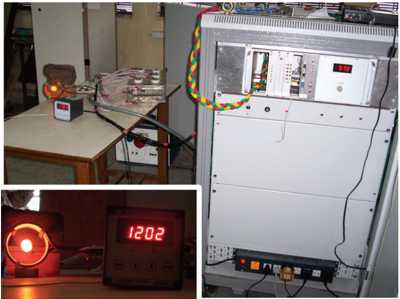
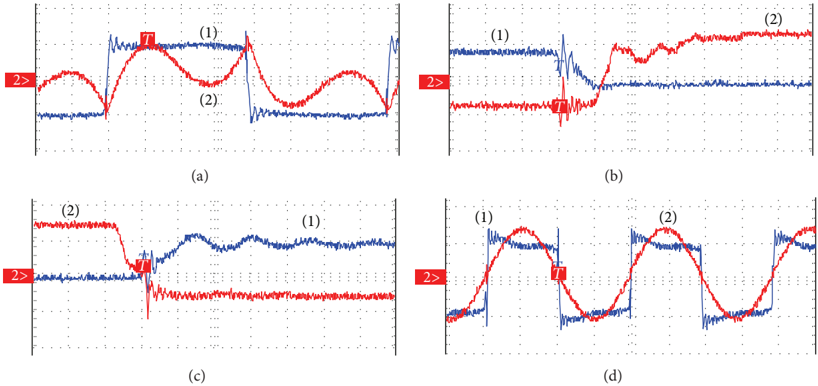
A topology named L-LC resonant inverter (RI) for induction heating (IH) applications takes most of the merits of the conventional series and parallel resonant schemes, while eliminating their limitations. In this paper, fundamental frequency AC analysis of L-LC RI is revisited, and a new operating point is suggested featuring enhanced current gain and near in-phase operation as compared to the conventional operating point. An approximate analysis of the circuit with square-wave voltage source is also described highlighting the effect of auxiliary inductor on the source current waveform. The analysis also leads to an optimum choice of the auxiliary inductance. The requirements of the metal organic vapour phase epitaxy (MOVPE) system in which a graphite susceptor is required to be heated to 1200°C demanding a 25 kW, 25 kHz IH power supply, the configuration of developed IH system, and experimental results are presented.
Overview
The claims and statistics of this paper haven’t been checked yet.
Run the check — free, no account needed. It reads the open-access text and checks the sources it cites.
Integrity signals
Registry
Cites
Statistics
Figures











Verification
Claims the paper makes
The claims and statistics of this paper haven’t been checked yet.
Run the check — free, no account needed. It reads the open-access text and checks the sources it cites.
Claims other papers make about this one
Each is checked against this paper’s own text: does it say what the citing paper says it does?
In the citing paper
“induction heating inverters, with an installed power higher than 10-15 kW for industrial and laboratory research purposes [29][30][31], can be constructed by IGBT transistors connected in parallel”
In the citing paper
“A converter structure with proven application in induction heating, giving high power density and the ability to operate with soft-switching, is the full-bridge circuit with a parallel or series resonant tank, based on different modulation techniques, such as Phase-Shift Modulation (PSM), Pulse-Frequency Modulation (PFM), Pulse-Density Modulation (PDM) and Asymmetrical Duty-Cycle (ADC) [25][26][27”
Self-check
Percentages, sums and reported differences re-computed from the paper’s own numbers.
The self-check needs the paper’s full text.
Citations
Cites
No references could be resolved yet.
Research works printed but not linked: 17
- 10.1049/iet-pel.2010.0107 · DOI
- 10.1109/TIE.2009.2022516 · DOI
- 10.1109/28.673722 · DOI
- 10.1109/TPEL.2011.2146278 · DOI
- 10.1109/63.838094 · DOI
- 10.1109/63.311261 · DOI
- 10.1109/63.558743 · DOI
- 1985, International Journal of Electronics, 59, 543, 10.1080/00207218508920729 · DOI
- 10.1109/63.85911 · DOI
- 1999, International Journal of Electronics, 86, 1205, 10.1080/002072199132752 · DOI
- 10.1109/TIE.2010.2070779 · DOI
- 10.1109/41.87588 · DOI
- 10.1109/TIE.2007.905928 · DOI
- 1997, Journal of Crystal Growth, 170, 312, 10.1016/S0022-0248(96)00598-2 · DOI
- 10.1109/TPEL.2003.823250 · DOI
- 10.1109/TIE.2010.2050752 · DOI
- 10.1109/TIE.2010.2049706 · DOI
Cited by
Dimitrov, B., Hayatleh, K., Barker, S., & Collier, G. (2021) · Electricity · doi:10.3390/electricity2040026 · Cited by 3
Metadata
- Authors
- Borage, M., & Tiwari, S.
- Venue
- Advances in Power Electronics
- Publisher
- Hindawi Limited
- Published
- 2013-07-17
- Volume
- 2013
- Pages
- 1-10
- ISSN
- 2090-181X
- 2090-1828
- Cited by
- 4
- References
- 0
- Language
- en
About these checks
Registry, retraction, Cites and statistics results are computed, not judged, with one exception: a printed reference that no index lists is read once by a model before it counts as a citation error. Claims are extracted by a model and kept only when their quote appears verbatim in the text; each cited source is then checked, with a model’s help, for whether it says what the claim relies on. Those verdicts can be wrong — read the claim’s quote and the cited source before relying on one.
Statistics and arithmetic are recomputed, not judged.
Confidence bands are shown only for fields calibrated on our annotated test set. None is calibrated yet, so no band is shown.
What counts as a claim ›How we measure confidence ›How we check this ›
Are you an author, or do you see a problem with this page? Request a review
Data sources
Bibliographic data: Semantic Scholar, OpenAlex, Crossref.
Contains information from the Semantic Scholar Academic Graph Datasets, made available under the ODC Attribution License (ODC-BY 1.0).
Semantic Scholar’s data is described in: Kinney, R., et al. (2023). The Semantic Scholar Open Data Platform. arXiv:2301.10140.
