

The DOI matches its Crossref record; 45 of the 46 references it cites were found in a registry or an index; none of the 42 sources its claims cite is checked for support yet.
Design, Analysis and Experimental Verification of the Self-Resonant Inverter for Induction Heating Crucible Melting Furnace Based on IGBTs Connected in Parallel
Open accessAbstract
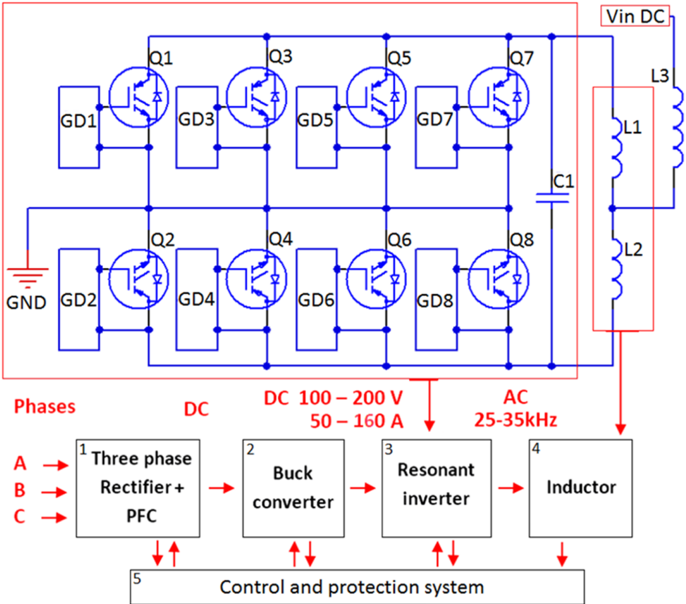
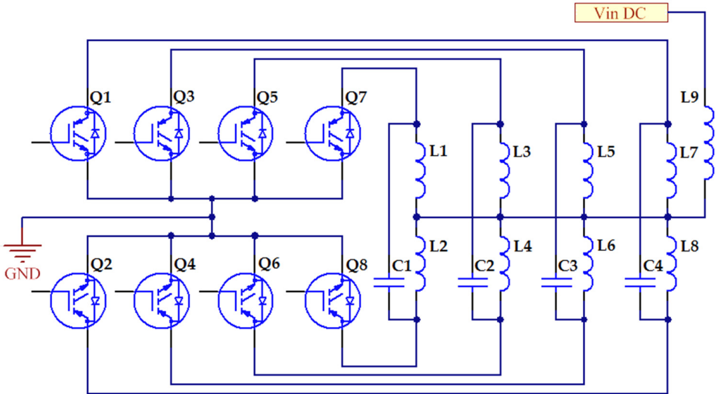
The object of this research was a self-resonated inverter, based on paralleled Insulated-Gate Bipolar Transistors (IGBTs), for high-frequency induction heating equipment, operating in a wide range of output powers, applicable for research and industrial purposes. For the nominal installed capacity for these types of invertors to be improved, the presented inverter with a modified circuit comprising IGBT transistors connected in parallel was explored. The suggested topology required several engineering problems to be solved: minimisation of the current mismatch amongst the paralleled transistors; a precise analysis of the dynamic and static transistors’ parameters; determination of the derating and mismatch factors necessary for a reliable design; experimental verification confirming the applicability of the suggested topology in the investigated inverter. This paper presents the design and analysis of IGBT transistors based on datasheet parameters and mathematical apparatus application. The expected current mismatch and the necessary derating factor, based on the expected mismatch in transistor parameters in a production lot, were determined. The suggested design was experimentally tested and investigated using a self-resonant inverter model in a melting crucible induction laboratory furnace.
Overview
CoChat Summary
TL;DR
The paper designs and experimentally verifies a self-resonant induction-heating inverter using paralleled IGBTs, with a datasheet-digitalization methodology to estimate current mismatch and derating. It reports stable ZVS operation, acceptable current sharing (2–5% same-lot, <2% after layout improvement), and feasibility of >30 kW with four IGBTs per side.
Key findings
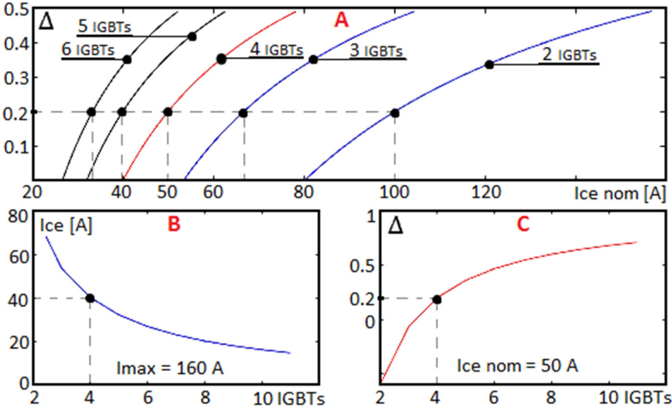
- For a target maximum current of \(I_{\max}=160\) A and accepted derating \(\Delta=0.2\) (20%), the design uses four IGBTs in parallel per side, with datasheet transistor current \(I_C=50\) A and expected current per transistor of 40 A.
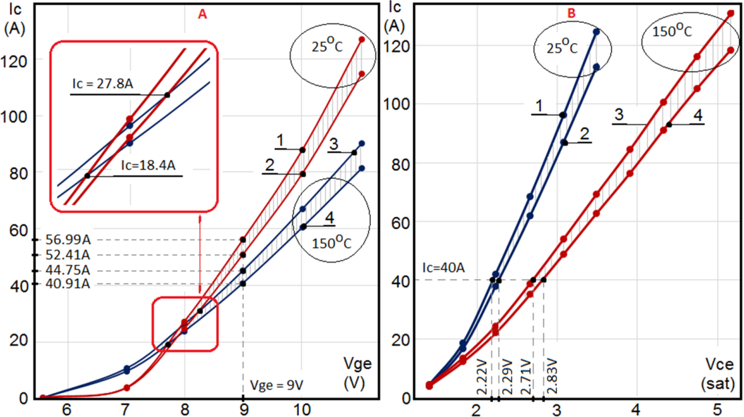
- At \(V_{ge}=9\) V, expected maximum collector currents vary with temperature and parameter spread: \(I_{C\max(150^\circ C,\min)}=40.91\) A, \(I_{C\max(150^\circ C,\max)}=44.75\) A, \(I_{C\max(25^\circ C,\min)}=52.41\) A, and \(I_{C\max(25^\circ C,\max)}=56.99\) A; worst-case current can vary by 16 A, while same-thermal-condition maximum-temperature mismatch is 4.58 A (under 20%).
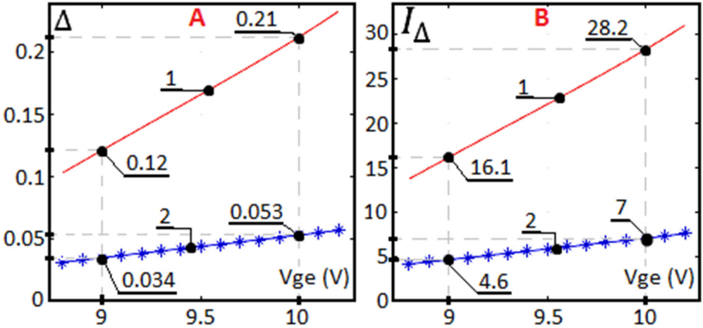
- Derating analysis for \(V_{ge}=9\)–10 V gives worst-case \(\Delta=0.12\)–0.21, but with shared thermal equilibrium the required derating is only \(\Delta=0.034\)–0.053 (3.4%–5.3%).
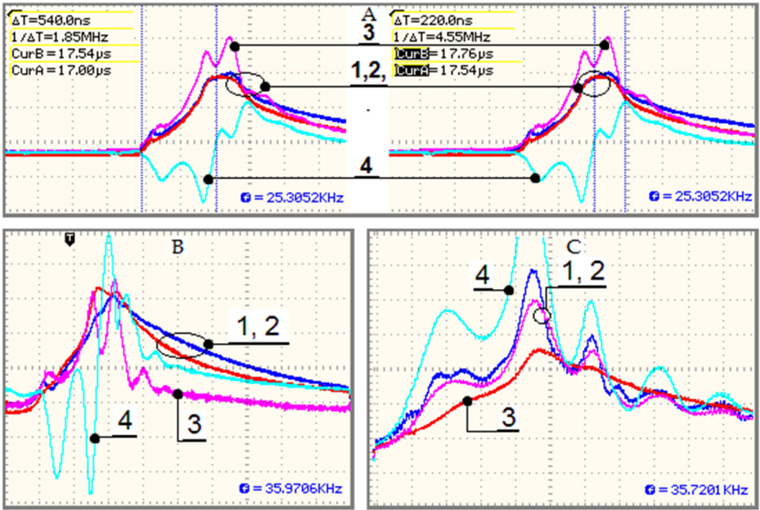
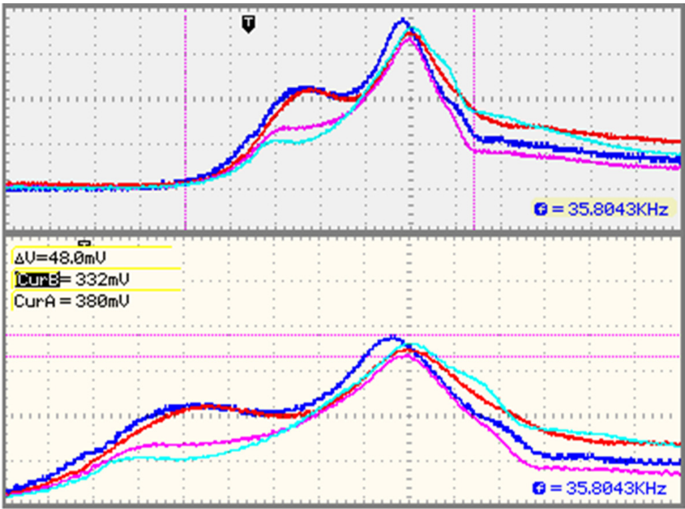
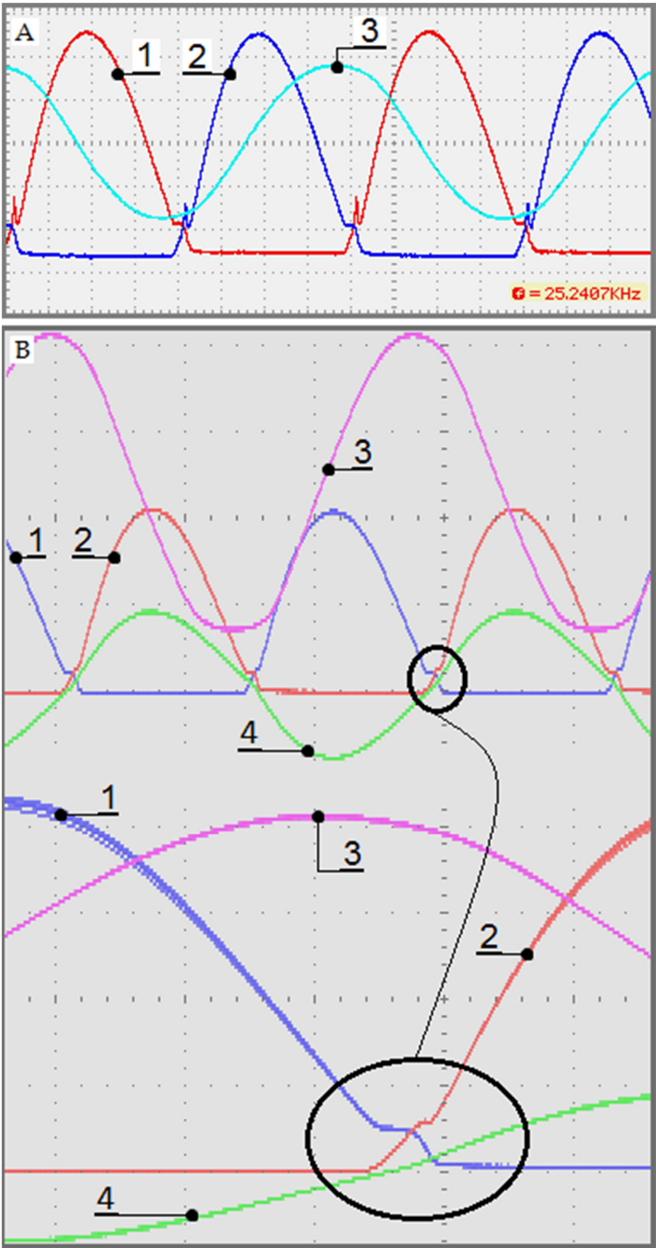
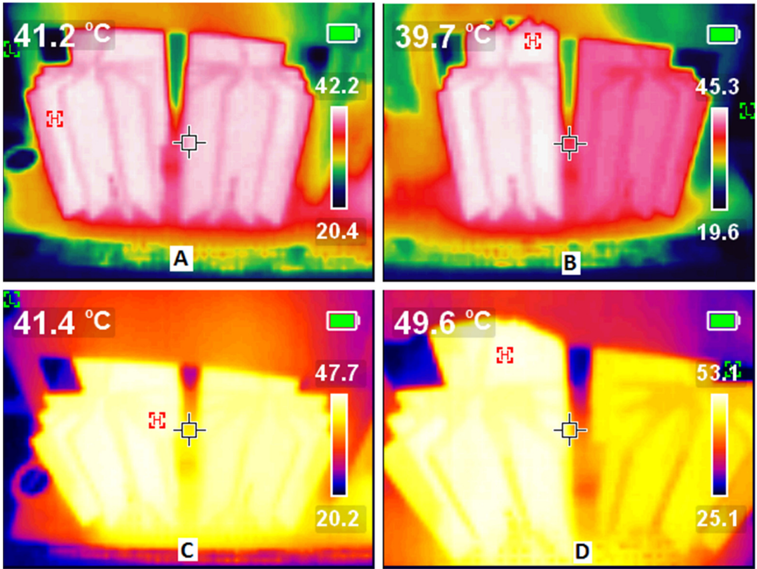
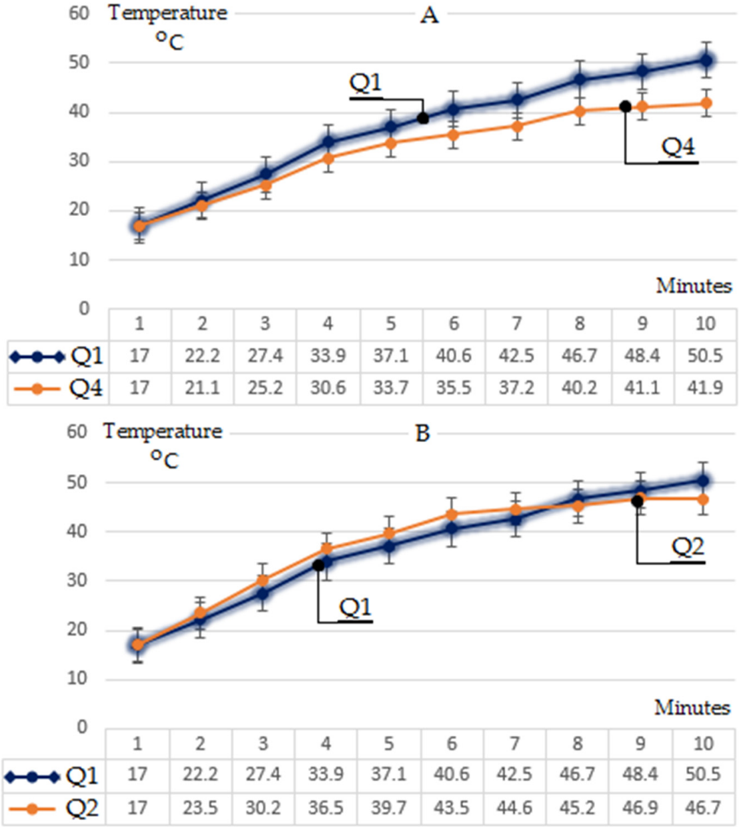
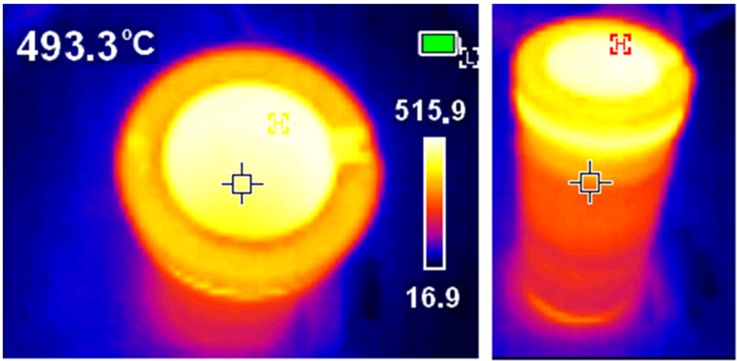
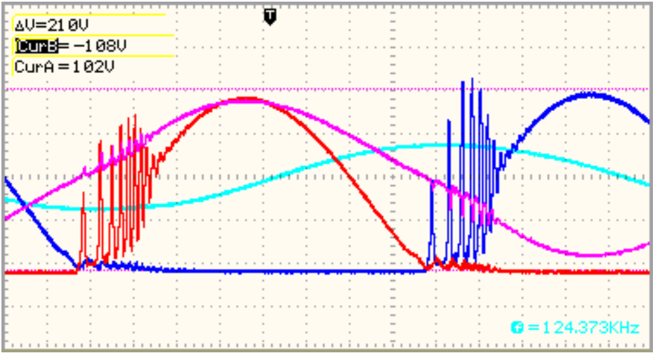
- Experiments showed same-production-lot current mismatch of 2–5% at the peak, different-lot transistors with 25% higher current and 540 ns switch-on delay, improved layout mismatch under 2%, thermal difference up to 10 °C between Q1 and Q4, and 3–4 °C between same-lot Q1 and Q2; the crucible reached 500 °C for 10 min, enough for melting tin.
Methods
- Design/analysis: a self-resonant inverter topology with paralleled RC-IGBTs; the methodology estimates derating factor and total current, selects IGBTs, digitalizes datasheet transconductance and output characteristics into 4–6 degree polynomial equations, assumes ±5% production-lot parameter variation, and calculates mismatch factor \(M\) and derating \(\Delta\).
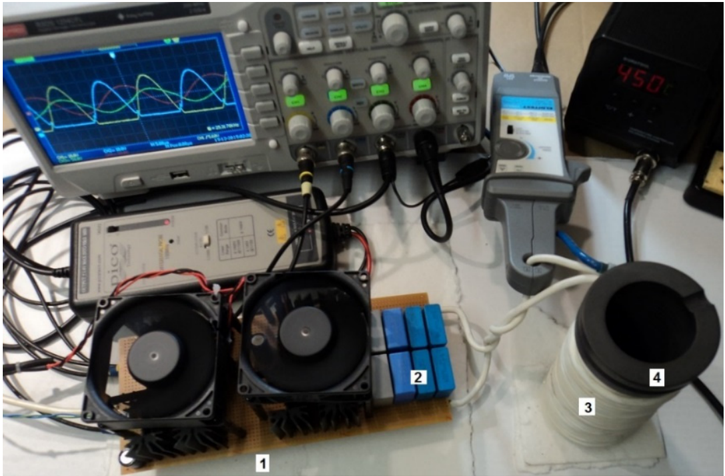
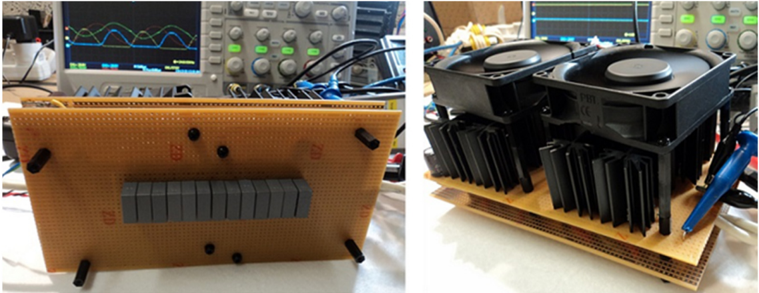
- Experimental setup: converters were built with 3, 4, and 5 transistors in parallel per side using IGBTs from the same and different production lots; currents through each transistor were measured at full load during the entire melting cycle, with thermal differences measured by infrared camera on the heatsink surface.
- Measurement conditions: resonant frequency varied from 25–35 kHz depending on load; equipment included oscilloscope RS PRO RSDS1204CFL, current probe ELDITEST CP6220, and voltage differential probe Pico; tests used a graphene crucible and forced air cooling.
Limitations
- Paper-stated: the suggested methodology was based on stipulated data, and Equations (3)–(6) were derived only for the concrete transistor, so it did not have diverse characteristics.
- Paper-stated: the converter layout was not an object of this research; parasitics-minimisation effects were experimentally observed but require future research and improvements.
- Evident from the text: experimental validation is limited to specific IGBT types and a laboratory setup, and thermal tests intentionally separated paralleled transistors rather than using a typical shared heatsink, so thermal equalisation results may not represent standard assembly.
Model-written summary. Check it against the paper before relying on it.
Integrity signals
Registry
Cites
Statistics
Figures
Verification
Claims the paper makes
44 Own result · 31 Own interpretation · 16 Not checked yet · 4 No basis given · 1 Sources not found · 1 No full text of the sources · 1 Own method
A result the paper states — it cites no source for it, so there is none to check. The quote shows it is in the paper.
In the paper
“The analysis shows that the datasheet transistor current must be selected at I C = 50 A (Figure 2A), the expected current through each transistor is 40 A (Figure 2B) calculated from Equation (2), and the specific derating factor is ∆ = 0.2 (Figure 2C).”
§ Design, Analysis and Experimental Verification of the Self-Resonant Inverter for Induction Heating Crucible Melting Furnace Based on IGBTs Connected in Parallel > 2. Analysis of the Investigated Inverter, Based on RC-IGBTs in Parallel
plain- Asserted: passes — The authors put it forward as true.
- Checkable: passes — It can be checked against evidence.
- Load-bearing: passes — The paper’s conclusions depend on it.
- Based: passes — The paper gives a reason why it holds.
- Rests on an assumption not shown here.
A result the paper reports from its own data — it cites no other source for it, so there is none to check. The quote shows it is in the paper.
In the paper
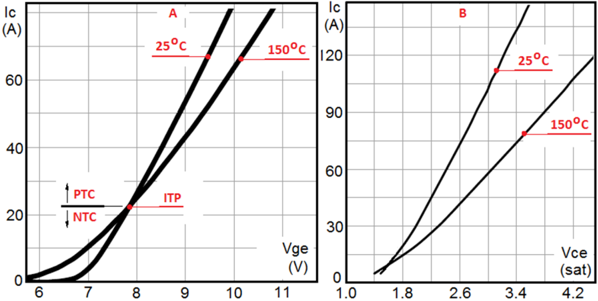
“It also shows the PTC established at the selected V ge in the entire range of the static parameters.”
§ Design, Analysis and Experimental Verification of the Self-Resonant Inverter for Induction Heating Crucible Melting Furnace Based on IGBTs Connected in Parallel > •
plainstates a cause- Asserted: passes — The authors put it forward as true.
- Checkable: passes — It can be checked against evidence.
- Load-bearing: passes — The paper’s conclusions depend on it.
- Based: passes — The paper gives a reason why it holds.
- Rests on an assumption not shown here.
A result the paper reports from its own data — it cites no other source for it, so there is none to check. The quote shows it is in the paper.
In the paper
“If the paralleled transistors shared the same thermal conditions at the maximum temperature, the maximum current mismatch would be 4.58 A, i.e., under 20% of the maximum current.”
§ Design, Analysis and Experimental Verification of the Self-Resonant Inverter for Induction Heating Crucible Melting Furnace Based on IGBTs Connected in Parallel > •
hedgedstates a possible cause- Asserted: passes — The authors put it forward as true.
- Checkable: passes — It can be checked against evidence.
- Load-bearing: passes — The paper’s conclusions depend on it.
- Based: passes — The paper gives a reason why it holds.
- Rests on an assumption not shown here.
A result the paper states — it cites no source for it, so there is none to check. The quote shows it is in the paper.
In the paper
“If the paralleled transistors share the same thermal equilibrium, the necessary derating factor would be in the range ∆ = 0.034-0.053,i.e., 3.4%-5.3%.”
§ Design, Analysis and Experimental Verification of the Self-Resonant Inverter for Induction Heating Crucible Melting Furnace Based on IGBTs Connected in Parallel > •
hedgedstates a possible cause- Asserted: passes — The authors put it forward as true.
- Checkable: passes — It can be checked against evidence.
- Load-bearing: passes — The paper’s conclusions depend on it.
- Based: passes — The paper gives a reason why it holds.
- Rests on an assumption not shown here.
A result the paper reports from its own data — it cites no other source for it, so there is none to check. The quote shows it is in the paper.
In the paper
“As it was experimentally shown that the installed capacity can reach more than 30 kW with four IGBTs in parallel per side of the topology”
§ Design, Analysis and Experimental Verification of the Self-Resonant Inverter for Induction Heating Crucible Melting Furnace Based on IGBTs Connected in Parallel > 4. Discussion
boostedstates a cause- Asserted: passes — The authors put it forward as true.
- Checkable: passes — It can be checked against evidence.
- Load-bearing: passes — The paper’s conclusions depend on it.
- Based: passes — The paper gives a reason why it holds.
44 more claims
Create a free account to see all 98 claims and to verify the 31 references still open.
- It may state two separate claims as one. 31
- The quote only partly states this claim. 2
- Probably not a substantial claim. 26
Self-check
Percentages, sums and reported differences re-computed from the paper’s own numbers.
Each contradiction between two passages listed here was confirmed by an independent check.
Rated minor: it would not touch a result — a value no result rests on, a p-value that stays on the same side of the significance level, or a conflict that is clerical, resolved elsewhere in the paper, or outside its own findings.
In the paper
“If the paralleled transistors shared the same thermal conditions at the maximum temperature, the maximum current mismatch would be 4.58 A, i.e., under 20% of the maximum current.”
§ Design, Analysis and Experimental Verification of the Self-Resonant Inverter for Induction Heating Crucible Melting Furnace Based on IGBTs Connected in Parallel > •
Reported 4.58 · recomputed 3.84
Rated minor: it would not touch a result — a value no result rests on, a p-value that stays on the same side of the significance level, or a conflict that is clerical, resolved elsewhere in the paper, or outside its own findings.
In the paper
§ Design, Analysis and Experimental Verification of the Self-Resonant Inverter for Induction Heating Crucible Melting Furnace Based on IGBTs Connected in Parallel > •
“Maximum transconductance characteristic (Figure 4, graphic 4), i.e., -5% from Equation (6):”
§ Design, Analysis and Experimental Verification of the Self-Resonant Inverter for Induction Heating Crucible Melting Furnace Based on IGBTs Connected in Parallel > 5. Conclusions
“maximum 150 °C (graphic 3 maximum and 4 minimum) temperatures.”
Rated minor: it would not touch a result — a value no result rests on, a p-value that stays on the same side of the significance level, or a conflict that is clerical, resolved elsewhere in the paper, or outside its own findings.
In the paper
§ Design, Analysis and Experimental Verification of the Self-Resonant Inverter for Induction Heating Crucible Melting Furnace Based on IGBTs Connected in Parallel > •
“V CE(sat 150 • C max) = 2.71 V”
§ Design, Analysis and Experimental Verification of the Self-Resonant Inverter for Induction Heating Crucible Melting Furnace Based on IGBTs Connected in Parallel > •
“V CE(sat 150 • C max) = 2.83 V”
Citations
Cites
Rudnev, V., Loveless, D., & Cook, R. L. (2017) · CRC Press eBooks · doi:10.1201/9781315117485 · Cited by 879
Elements of Induction Heating: Design, Control, and Applications
Zinn, S., & Semiatin, S. L. (1988) · ASM International eBooks · doi:10.31399/asm.tb.eihdca.9781627083416 · Cited by 304
Optimal Control of Induction Heating Processes
Rapoport, É. Y., & Pleshivtseva, Y. (2006) · CRC Press eBooks · doi:10.1201/9781420019490 · Cited by 152
Practical Induction Heat Treating
Haimbaugh, R. E. (2015) · ASM International eBooks · doi:10.31399/asm.tb.piht2.9781627083119 · Cited by 136
Bortis, D., Biela, J., & Kolar, J. W. (2008) · IEEE Transactions on Plasma Science · doi:10.1109/tps.2008.2003971 · Cited by 127
Induction and Direct Resistance Heating: Theory and Numerical Modeling
Lupi, S., Forzan, M., & Aliferov, A. I. (2014) · Springer eBooks · doi:10.1007/978-3-319-03479-9 · Cited by 113
Active current balancing for parallel-connected silicon carbide MOSFETs
Xue, Y., Lu, J., Wang, Z., Tolbert, L. M., Blalock, B. J., & Wang, F. (2013) · IEEE Energy Conversion Congress and Exposition (ECCE) · doi:10.1109/ecce.2013.6646891 · Cited by 106
Liu, Q., Li, B., Schlangen, E., Sun, Y., & Wu, S. (2017) · Applied Sciences · doi:10.3390/app7101088 · Cited by 77
Robustness and Balancing of Parallel-Connected Power Devices: SiC Versus CoolMOS
Hu, J., Alatise, O., Ortiz Gonzalez, J. A., Bonyadi, R., Alexakis, P., Ran, L., & Mawby, P. (2016) · IEEE Transactions on Industrial Electronics · doi:10.1109/tie.2015.2500187 · Cited by 67
Numerical optimisation for induction heat treatment processes
Naar, R., & Bay, F. (2012) · Applied Mathematical Modelling · doi:10.1016/j.apm.2012.04.058 · Cited by 63
Research works printed but not linked: 1
- Dimitrov, 2014, An Approach for Designing a Complex Inductor—Workpiece System for Induction Heating Detail Systems, Technol. Educ. Manag. Inform. TEM J., 3, 244
Cited by
Single-Stage LLC Resonant Converter for Induction Heating System with Improved Power Quality
Kumar, A., Goswami, A., Sadhu, P. K., & Szymanski, J. R. (2024) · Electricity · doi:10.3390/electricity5020011 · Cited by 9
Design of Resonant Inverters with Energy Dosing, Based on Optimization with Reference Curve
Madzharov, N. D., Gilev, B. N., & Hinov, N. L. (2025) · Electronics · doi:10.3390/electronics14020327 · Cited by 1
Design and implementation of an effective and optimal circuit for induction sealing
Rashidi, B. (2025) · Journal of Association of Electrical and Electronics Engineers · doi:10.61186/jiaeee.22.1.111
Metadata
- Authors
- Dimitrov, B., Hayatleh, K., Barker, S., & Collier, G.
- Affiliations
- University of Warwick (GB)
- Oxford Brookes University (GB)
- Corresponding author
- Dimitrov, Borislav
- Venue
- Electricity
- Publisher
- MDPI AG
- Published
- 2021-10-11
- Volume
- 2
- Issue
- 4
- Pages
- 439-458
- ISSN
- 2673-4826 (ISSN-L)
- OpenAlex
- W3206514520
- Semantic Scholar
- 08b78cdc34f3fcae1dd607ad2c0a31e04bc2b654
- Cited by
- 3
- References
- 46
- Citations by year
- 2025: 2 · 2024: 1
- FWCI
- 0.07
- Type
- journal article
- Language
- en
- Open access
- gold
- doi.org
- Licence
- Locations
- Electricity (publishedVersion, cc-by)
- Warwick Research Archive Portal (University of Warwick) (acceptedVersion)
- DOAJ (DOAJ: Directory of Open Access Journals) (submittedVersion, cc-by-sa)
- Radar (Oxford Brookes University) (submittedVersion, cc-by)
- Topics
- Physical Sciences › Engineering › Electrical and Electronic Engineering › Induction Heating and Inverter Technology
- Physical Sciences › Engineering › Electrical and Electronic Engineering › Electric Power Systems and Control
- Physical Sciences › Engineering › Electrical and Electronic Engineering › Multilevel Inverters and Converters
- Keywords
- induction heating, current mismatch, derating factor, transistor parameter variation, high-frequency power conversion, inverter topology design
About these checks
Registry, retraction, Cites and statistics results are computed, not judged, with one exception: a printed reference that no index lists is read once by a model before it counts as a citation error. Claims are extracted by a model and kept only when their quote appears verbatim in the text; each cited source is then checked, with a model’s help, for whether it says what the claim relies on. Those verdicts can be wrong — read the claim’s quote and the cited source before relying on one.
A language model drew the claims from the paper on 2026-11-12, under version 3 of the claim definition (model deepseek-v4.1-flash, prompt extract-v3).
A second model labelled each claim on 2026-11-12 (model jev-1.13-20260917, definition revision gold-guideline-v0.2).
Statistics and arithmetic are recomputed, not judged.
Confidence bands are shown only for fields calibrated on our annotated test set. None is calibrated yet, so no band is shown.
What counts as a claim ›How we measure confidence ›How we check this ›
Are you an author, or do you see a problem with this page? Request a review
How to cite
Cite CoChat for the checks on this page, and the paper for its own findings.
- This page
- CoChat. (2026). Citation check: Design, Analysis and Experimental Verification of the Self-Resonant Inverter for Induction Heating Crucible Melting Furnace Based on IGBTs Connected in Parallel. https://app.cochat.ai/papers/10.3390/electricity2040026
- The paper
- Dimitrov, B., Hayatleh, K., Barker, S., & Collier, G. (2021). Design, Analysis and Experimental Verification of the Self-Resonant Inverter for Induction Heating Crucible Melting Furnace Based on IGBTs Connected in Parallel. Electricity. https://doi.org/10.3390/electricity2040026
Data sources
Bibliographic data: Semantic Scholar, OpenAlex, Crossref.
Contains information from the Semantic Scholar Academic Graph Datasets, made available under the ODC Attribution License (ODC-BY 1.0).
Semantic Scholar’s data is described in: Kinney, R., et al. (2023). The Semantic Scholar Open Data Platform. arXiv:2301.10140.
