

Inflammation and ER Stress Downregulate BDH2 Expression and Dysregulate Intracellular Iron in Macrophages
Open accessThe DOI matches its Crossref record; 80 of the 80 references it cites were found in a registry or an index.
Abstract
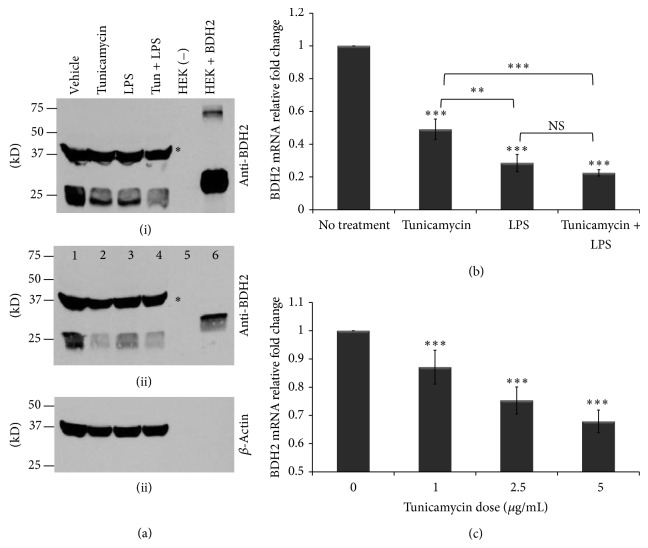
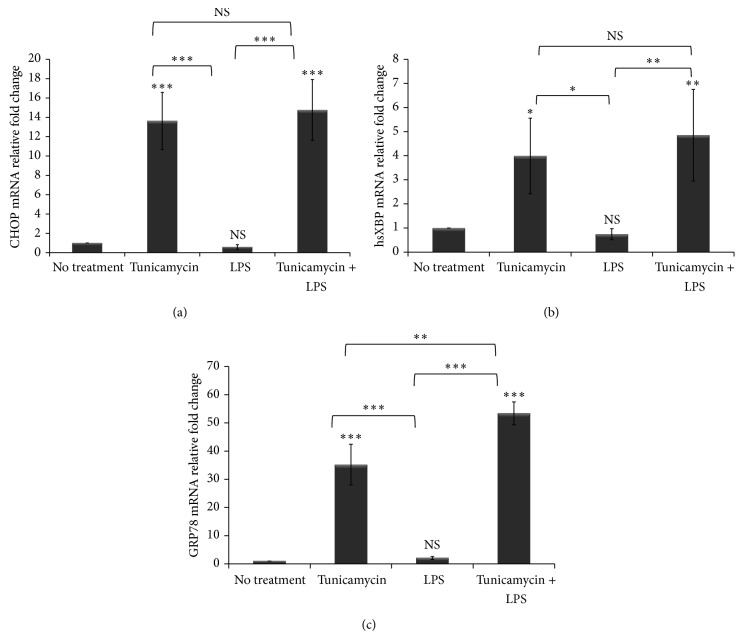
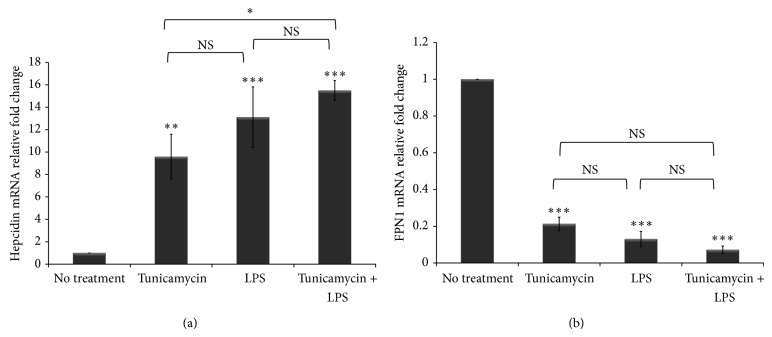
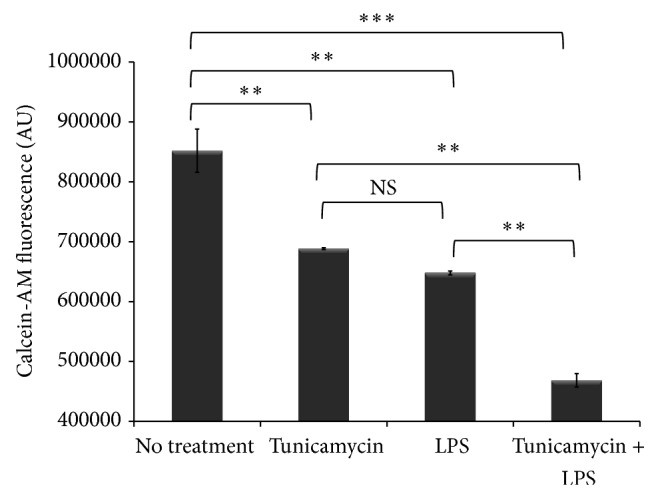
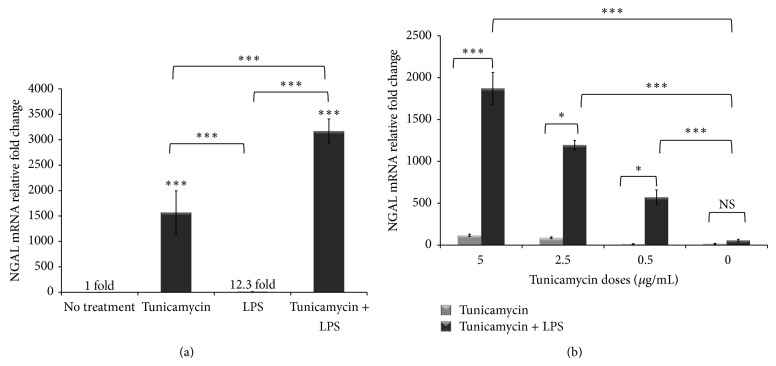
Macrophages play a very important role in host defense and in iron homeostasis by engulfing senescent red blood cells and recycling iron. Hepcidin is the master iron regulating hormone that limits dietary iron absorption from the gut and limits iron egress from macrophages. Upon infection macrophages retain iron to limit its bioavailability which limits bacterial growth. Recently, a short chain butyrate dehydrogenase type 2 (BDH2) protein was reported to contain an iron responsive element and to mediate cellular iron trafficking by catalyzing the synthesis of the mammalian siderophore that binds labile iron; therefore, BDH2 plays a crucial role in intracellular iron homeostasis. However, BDH2 expression and regulation in macrophages have not yet been described. Here we show that LPS-induced inflammation combined with ER stress led to massive BDH2 downregulation, increased the expression of ER stress markers, upregulated hepcidin expression, downregulated ferroportin expression, caused iron retention in macrophages, and dysregulated cytokine release from macrophages. We also show that ER stress combined with inflammation synergistically upregulated the expression of the iron carrier protein NGAL and the stress-inducible heme degrading enzyme heme oxygenase-1 (HO-1) leading to iron liberation. This is the first report to show that inflammation and ER stress downregulate the expression of BDH2 in human THP-1 macrophages.
Overview
The claims and statistics of this paper haven’t been checked yet.
Free: it reads the open-access text and checks the first 5 claims that cite a source we can check. Create a free account to check every claim.
Integrity signals
Registry
Cites
Statistics
Figures


Verification
Claims the paper makes
The claims and statistics of this paper haven’t been checked yet.
Free: it reads the open-access text and checks the first 5 claims that cite a source we can check. Create a free account to check every claim.
Claims other papers make about this one
Each is checked against this paper’s own text: does it say what the citing paper says it does?
The source backs part of the claim, not all of it — or backs it for a different population, condition or comparison.
In the citing paper
“It may be for this reason that TLR ligation, endoplasmatic reticulum stress and T H 17 cytokines result in the down-regulation of BDH2 expression (Zughaier et al., 2014).”
From Iron in infection and immunity (2020) · cites this paper as Zughaier et al., 2014
Experimental — accuracy not yet measuredIn the citing paper
“LPS and endoplasmic reticulum stress downregulate BDH2 expression and modify macrophage iron homeostasis and the iron delivery to pathogens”
From Iron in immune cell function and host defense (2021) · cites this paper as [54]
Self-check
Percentages, sums and reported differences re-computed from the paper’s own numbers.
The self-check needs the paper’s full text.
Citations
Cites
Mosmann, T. (1983) · Journal of Immunological Methods · doi:10.1016/0022-1759(83)90303-4 · Cited by 56,104
Hepcidin Regulates Cellular Iron Efflux by Binding to Ferroportin and Inducing Its Internalization
Nemeth, E., Tuttle, M. S., Powelson, J., Vaughn, M. B., Donovan, A., Ward, D. M., Ganz, T., & Kaplan, J. (2004) · Science · doi:10.1126/science.1104742 · Cited by 4,803 · cited 3×
“Limiting the bioavailability of iron during infection is a host defense mechanism driven by the hepcidin-ferroportin axis [2, 7, 15] that leads to iron retention in macrophages.”
BackgroundNemeth, E., Rivera, S., Gabayan, V., Keller, C., Taudorf, S., Pedersen, B. K., & Ganz, T. (2004) · Journal of Clinical Investigation · doi:10.1172/jci200420945 · Cited by 2,650 · cited 13×
“cytokine that plays a significant role in systemic iron metabolism by directly inducing the expression of hepcidin, the master iron-regulating hormone [8].”
BackgroundInfluentialMishra, J., Dent, C., Tarabishi, R., Mitsnefes, M. M., Ma, Q., Kelly, C., Ruff, S. M., Zahedi, K., Shao, M., Bean, J., et al. (2005) · The Lancet · doi:10.1016/s0140-6736(05)74811-x · Cited by 2,394
Lipocalin 2 mediates an innate immune response to bacterial infection by sequestrating iron
Flo, T. H., Smith, K. D., Sato, S., Rodriguez, D. J., Holmes, M. A., Strong, R. K., Akira, S., & Aderem, A. (2004) · Nature · doi:10.1038/nature03104 · Cited by 1,877
Hepcidin, a putative mediator of anemia of inflammation, is a type II acute-phase protein
Nemeth, E., Valore, E. V., Territo, M., Schiller, G., Lichtenstein, A., & Ganz, T. (2003) · Blood · doi:10.1182/blood-2002-10-3235 · Cited by 1,417
Goetz, D. H., Holmes, M. A., Borregaard, N., Bluhm, M. E., Raymond, K. N., & Strong, R. K. (2002) · Molecular Cell · doi:10.1016/s1097-2765(02)00708-6 · Cited by 1,355
Dysmetabolic Hyperferritinemia: All Iron Overload Is Not Hemochromatosis
Makker, J., Hanif, A., Bajantri, B., & Chilimuri, S. (2015) · Case Reports in Gastroenterology · doi:10.1159/000373883 · Cited by 1,351
Use of MTT colorimetric assay to measure cell activation
Gerlier, D., & Thomasset, N. (1986) · Journal of Immunological Methods · doi:10.1016/0022-1759(86)90215-2 · Cited by 1,197
Sindrilaru, A., Peters, T., Wieschalka, S., Baican, C., Baican, A., Peter, H., Hainzl, A., Schatz, S., Qi, Y., Schlecht, A., et al. (2011) · Journal of Clinical Investigation · doi:10.1172/jci44490 · Cited by 1,100 · cited 1×
“Recent evidence showed that iron retention dictates macrophage polarization [5, 57] and induces unrestrained proinflammatory macrophages that impair wound healing [58].”
Background
Research works printed but not linked: 4
- 2010, Postepy Biochemii, 56, 305
- 2002, The Israel Medical Association Journal: IMAJ, 4, 1043
- 2013, Transactions of the American Clinical and Climatological Association, 124, 111
- 2011, Zhongguo Shi Yan Xue Ye Xue Za Zhi, 19, 390
Cited by
Endoplasmic reticulum stress signalling-from basic mechanisms to clinical applications
Almanza, A., Carlesso, A., Chintha, C., Creedican, S., Doultsinos, D., Leuzzi, B., Luís, A., McCarthy, N., Montibeller, L., More, S., et al. (2019) · The FEBS Journal · doi:10.1111/febs.14608 · Cited by 1,034
Iron in infection and immunity
Nairz, M., & Weiss, G. (2020) · Molecular Aspects of Medicine · doi:10.1016/j.mam.2020.100864 · Cited by 359
Iron in immune cell function and host defense
Haschka, D., Hoffmann, A., & Weiss, G. (2021) · Seminars in Cell & Developmental Biology · doi:10.1016/j.semcdb.2020.12.005 · Cited by 188
Liu, J., Hu, Y., Feng, Y., Jiang, Y., Guo, Y., Liu, Y., Chen, X., Yang, J., Chen, Y., Mao, Q.-S., et al. (2020) · Journal of Experimental & Clinical Cancer Research · doi:10.1186/s13046-020-01620-z · Cited by 139
Vascular calcification: Molecular mechanisms and therapeutic interventions
Pan, W. D., Jie, W., & Huang, H. (2023) · MedComm · doi:10.1002/mco2.200 · Cited by 134
Kim, S., Ramos, S., Valencia, R. A., Cho, Y.-I., & Lee, S. (2022) · Frontiers in Microbiology · doi:10.3389/fmicb.2022.804562 · Cited by 160
Garner, J. B., Chamberlain, A. J., Jagt, C. V., Nguyen, T. T. T., Mason, B., Marett, L. C., Leury, B. J., Wales, W. J., & Hayes, B. J. (2020) · Scientific Reports · doi:10.1038/s41598-020-75438-2 · Cited by 88
Zhao, M., Li, M.-Y., Gao, X.-F., Jia, S.-J., Gao, K.-Q., Zhou, Y., Zhang, H.-H., Huang, Y., Wang, J., Wu, H.-J., et al. (2018) · Clinical Immunology · doi:10.1016/j.clim.2017.11.002 · Cited by 66
Corsetti, G., Romano, C., Stacchiotti, A., Pasini, E., & Dioguardi, F. S. (2016) · Biological Trace Element Research · doi:10.1007/s12011-016-0912-z · Cited by 53
Willemetz, A., Beatty, S., Richer, E., Rubio, A., Auriac, A., Milkereit, R. J., Thibaudeau, O., Vaulont, S., Malo, D., & Canonne-Hergaux, F. (2017) · Frontiers in Immunology · doi:10.3389/fimmu.2017.00498 · Cited by 45
Huang, Y., Zhang, N., Xie, C., You, Y., Guo, L., Ye, F., Xie, X., & Wang, J. (2022) · Frontiers in Cardiovascular Medicine · doi:10.3389/fcvm.2022.922534 · Cited by 43
Samsonraj, R. M., Paradise, C. R., Dudakovic, A., Sen, B., Nair, A., Dietz, A. B., Deyle, D. R., Cool, S. M., Rubin, J., & van Wijnen, A. J. (2018) · Stem Cells and Development · doi:10.1089/scd.2018.0037 · Cited by 31
Iron chelators inhibit amyloid-β-induced production of lipocalin 2 in cultured astrocytes
Dekens, D. W., Deyn, P. P. D., Sap, F., Eisel, U. L. M., & Naudé, P. J. W. (2019) · Neurochemistry International · doi:10.1016/j.neuint.2019.104607 · Cited by 31
Liang, H., Xiong, Z., Li, R., Hu, K., Cao, M., Yang, J., Zhong, Z., Jia, C., Yao, Z., & Deng, M. (2019) · Journal of Cancer · doi:10.7150/jca.32022 · Cited by 31
The effects of first-line anti-tuberculosis drugs on the actions of vitamin D in human macrophages
Chesdachai, S., Zughaier, S. M., Li, H., Kempker, R. R., Blumberg, H. M., Ziegler, T. R., & Tangpricha, V. (2016) · Journal of Clinical & Translational Endocrinology · doi:10.1016/j.jcte.2016.08.005 · Cited by 28
Self-citationPerea-Martínez, A., García‐Hernández, R., Manzano, J. I., & Gamarro, F. (2022) · ACS Infectious Diseases · doi:10.1021/acsinfecdis.1c00513 · Cited by 24
Li, B., Liao, Z., Mo, Y., Zhao, W., Zhou, X., Xiao, X., Cui, W., Feng, G., Zhong, S., Liang, Y., et al. (2019) · British Journal of Cancer · doi:10.1038/s41416-019-0638-8 · Cited by 28
Cytotoxicity and Antibiofilm Activity of Silver-Polypropylene Nanocomposites
Bellisario, D., Santo, L., Quadrini, F., Hassiba, M., Bader, N., Chowdhury, S. H., Hassan, M. K., & Zughaier, S. M. (2023) · Antibiotics · doi:10.3390/antibiotics12050924 · Cited by 19
Self-citationEbrahimi, R., Pasalar, P., Shokri, H., Shabani, M., & Emamgholipour, S. (2022) · Journal of Physiology and Biochemistry · doi:10.1007/s13105-021-00869-y · Cited by 11
Age modulates liver responses to asparaginase-induced amino acid stress in mice
Nikonorova, I. A., Zhu, Q., Signore, C. C., Mirek, E. T., Jonsson, W. O., Kong, B., Guo, G. L., Belden, W. J., & Anthony, T. G. (2019) · Journal of Biological Chemistry · doi:10.1074/jbc.ra119.009864 · Cited by 11
Computational Modeling of Macrophage Iron Sequestration during Host Defense against Aspergillus
Adhikari, B., Scindia, Y. M., Vieira, L. S., Ribeiro, H. D. A. L., Masison, J., Yang, N., Fonseca, L. L., Wheeler, M., Knapp, A., Mei, Y., et al. (2022) · mSphere · doi:10.1128/msphere.00074-22 · Cited by 10
Bdh2 Deficiency Promotes Endoderm-Biased Early Differentiation of Mouse Embryonic Stem Cells
Fu, Y., Liu, F., Cao, S., Zhang, J., Wang, H., Wu, B., Song, Y., Duo, S., Li, X., & Bao, S. (2021) · Frontiers in Cell and Developmental Biology · doi:10.3389/fcell.2021.655145 · Cited by 6
Detecting differential transcript usage in complex diseases with SPIT
Erdogdu, B., Varabyou, A., Hicks, S. C., Salzberg, S. L., & Pertea, M. (2024) · Cell Reports Methods · doi:10.1016/j.crmeth.2024.100736 · Cited by 7
Romano, C., Corsetti, G., Pasini, E., Flati, V., & Dioguardi, F. S. (2018) · Journal of Food and Nutrition Research · doi:10.12691/jfnr-6-7-1 · Cited by 5
Yang, B. Y., Hou, S., Zhao, J., & Li, Y. (2022) · Bioengineered · doi:10.1080/21655979.2022.2025694 · Cited by 4
Yang, W., Lin, S.-F., Wang, S., Tsai, W.-C., Wu, C., & Wu, S. (2020) · International Journal of Molecular Sciences · doi:10.3390/ijms21093033 · Cited by 8
García‐Hernández, R., Manzano, J. I., Perea-Martínez, A., & Gamarro, F. (2022) · OMICS A Journal of Integrative Biology · doi:10.1089/omi.2021.0185 · Cited by 7
Transcriptomic imputation identifies tissue-specific genes associated with cervical myelopathy
Seah, C., Karabacak, M., & Margetis, K. D. (2024) · The Spine Journal · doi:10.1016/j.spinee.2024.10.014 · Cited by 3
Giordano, G., Bochicchio, M. T., Niro, G., Lucchesi, A., & Napolitano, M. (2022) · Immunobiology · doi:10.1016/j.imbio.2022.152297 · Cited by 1
Seele, P. P. (2019) · Open University of Cape Town (University of Cape Town)
Briggs, M. D. (2020) · Faculty Opinions – Post-Publication Peer Review of the Biomedical Literature · doi:10.3410/f.733669789.793573481
Targeting IRE1 activity in Glioblastoma Multiforme
Doultsinos, D. (2019) · theses.fr (ABES) · doi:10.70675/144ae2a8z9211z4b25za8aeza4d20ed0eafd
Fine-tuning UPR signals and subsequent cellular outputs
Papaioannou, A. (2019) · theses.fr (ABES) · doi:10.70675/50aa6a06zc458z48e5z9416z7682f49fb7f3
Emerging roles of dehydrogenase/reductase (DHRS) in cancer
Huang, J., Tang, C., Chen, X., Zeng, P., Li, H., & Luo, X. (2026) · Chemistry and Physics of Lipids · doi:10.1016/j.chemphyslip.2026.105590
Metadata
- Authors
- Zughaier, S. M., Stauffer, B. B., & McCarty, N. A.
- Affiliations
- Emory University (US)
- Corresponding author
- Zughaier, Susu M.
- Venue
- Journal of Immunology Research
- Publisher
- Hindawi Limited
- Published
- 2014
- Volume
- 2014
- Pages
- 1-16
- ISSN
- 2314-7156 (ISSN-L)
- 2314-8861
- PMC
- PMC4267003
- OpenAlex
- W2101874338
- Cited by
- 34
- References
- 80
- Citations by year
- 2026: 1 · 2024: 2 · 2023: 2 · 2022: 8 · 2021: 1 · 2020: 6 · 2019: 7 · 2018: 3 · 2017: 2 · 2016: 2
- FWCI
- 0.95
- Type
- journal article
- Language
- en
- Open access
- gold
- doi.org
- Locations
- Journal of Immunology Research (publishedVersion, cc-by)
- PubMed Central (publishedVersion, cc-by)
- PubMed (publishedVersion)
- DOAJ (DOAJ: Directory of Open Access Journals) (submittedVersion, cc-by-sa)
- Funders
- Emory-Egleston Children’s Research Center
- Topics
- Health Sciences › Medicine › Hematology › Iron Metabolism and Disorders
- Life Sciences › Biochemistry, Genetics and Molecular Biology › Cancer Research › Ferroptosis and cancer prognosis
- Life Sciences › Biochemistry, Genetics and Molecular Biology › Molecular Biology › Heme Oxygenase-1 and Carbon Monoxide
- Keywords
- endoplasmic reticulum stress, inflammation, macrophages, hepcidin, ferroportin, neutrophil gelatinase-associated lipocalin, heme oxygenase-1, lipopolysaccharide, siderophores, cytokine production, THP-1 cells
- MeSH terms
- Lipocalin-2, Acute-Phase Proteins, Cell Line, Endoplasmic Reticulum, Homeostasis, Humans, Hydroxybutyrate Dehydrogenase, Inflammation, Iron, Lipopolysaccharides, Macrophages, Proto-Oncogene Proteins, Stress, Physiological, Down-Regulation, Up-Regulation, Siderophores, Intracellular Space, Heme Oxygenase-1, Lipocalins, Hepcidins
About these checks
Registry, retraction, Cites and statistics results are computed, not judged, with one exception: a printed reference that no index lists is read once by a model before it counts as a citation error. Claims are extracted by a model and kept only when their quote appears verbatim in the text; each cited source is then checked, with a model’s help, for whether it says what the claim relies on. Those verdicts can be wrong — read the claim’s quote and the cited source before relying on one.
Statistics and arithmetic are recomputed, not judged.
Confidence bands are shown only for fields calibrated on our annotated test set. None is calibrated yet, so no band is shown.
What counts as a claim ›How we measure confidence ›How we check this ›
Are you an author, or do you see a problem with this page? Request a review
Data sources
Bibliographic data: Semantic Scholar, OpenAlex, Crossref.
Contains information from the Semantic Scholar Academic Graph Datasets, made available under the ODC Attribution License (ODC-BY 1.0).
Semantic Scholar’s data is described in: Kinney, R., et al. (2023). The Semantic Scholar Open Data Platform. arXiv:2301.10140.
