

The DOI matches its Crossref record; 38 of the 38 references it cites were found in a registry or an index.
Decolorization of Anthraquinonic Dyes from Textile Effluent Using Horseradish Peroxidase: Optimization and Kinetic Study
Abstract
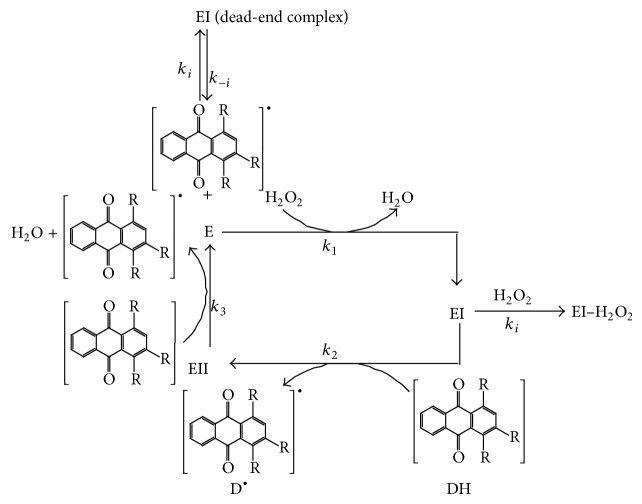
Two anthraquinonic dyes, C.I. Acid Blue 225 and C.I. Acid Violet 109, were used as models to explore the feasibility of using the horseradish peroxidase enzyme (HRP) in the practical decolorization of anthraquinonic dyes in wastewater. The influence of process parameters such as enzyme concentration, hydrogen peroxide concentration, temperature, dye concentration, and pH was examined. The pH and temperature activity profiles were similar for decolorization of both dyes. Under the optimal conditions, 94.7% of C.I. Acid Violet 109 from aqueous solution was decolorized (treatment time 15 min, enzyme concentration 0.15 IU/mL, hydrogen peroxide concentration 0.4 mM, dye concentration 30 mg/L, pH 4, and temperature 24°C) and 89.36% of C.I. Acid Blue 225 (32 min, enzyme concentration 0.15 IU/mL, hydrogen peroxide concentration 0.04 mM, dye concentration 30 mg/L, pH 5, and temperature 24°C). The mechanism of both reactions has been proven to follow the two substrate ping‐pong mechanism with substrate inhibition, revealing the formation of a nonproductive or dead‐end complex between dye and HRP or between H 2 O 2 and the oxidized form of the enzyme. Both chemical oxygen demand and total organic carbon values showed that there was a reduction in toxicity after the enzymatic treatment. This study verifies the viability of use of horseradish peroxidase for the wastewaters treatment of similar anthraquinonic dyes.
Overview
The claims and statistics of this paper haven’t been checked yet.
Run the check — free, no account needed. It reads the open-access text and checks the sources it cites.
Integrity signals
Registry
Cites
Statistics
Figures
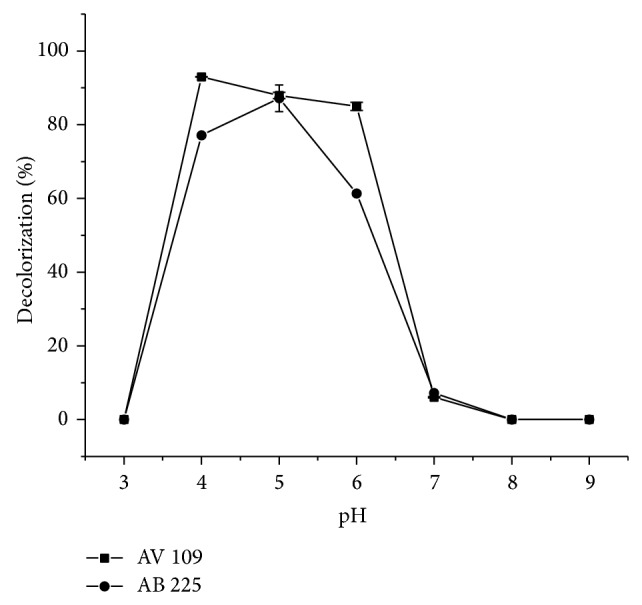
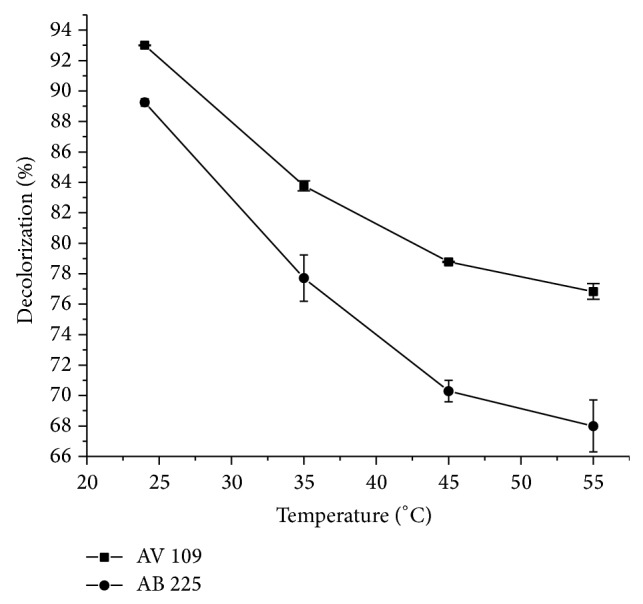
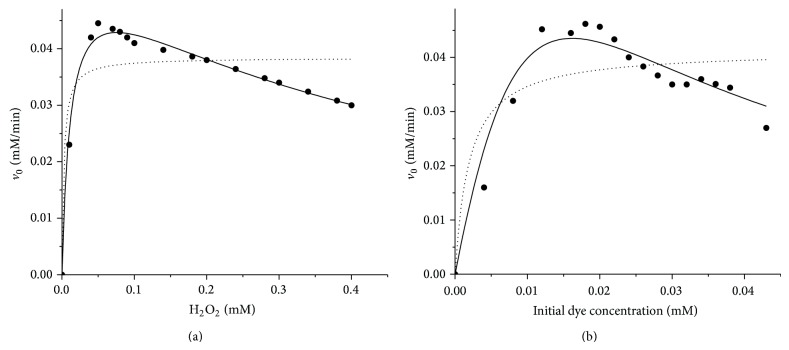
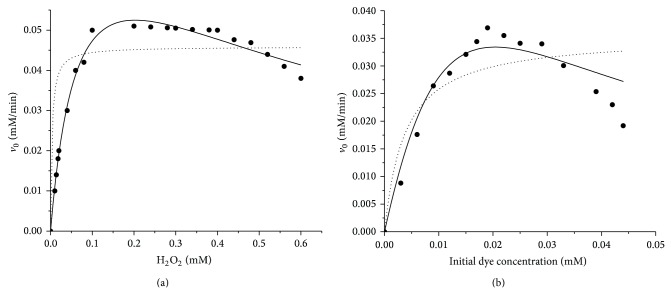
Verification
Claims the paper makes
The claims and statistics of this paper haven’t been checked yet.
Run the check — free, no account needed. It reads the open-access text and checks the sources it cites.
Claims other papers make about this one
Each is checked against this paper’s own text: does it say what the citing paper says it does?
The source backs part of the claim, not all of it — or backs it for a different population, condition or comparison.
In the citing paper
“This 'dual action' mechanism has been named ping -pong bi bi mechanism due to the fact that the electrons liberated by the enzyme from the reduction of peroxides are recovered through the oxidation of the main substrate, with the aid of the intermediate enzymatic compounds 122 .”
From Degradation of anthraquinone dyes from effluents: A review focusing on enzymatic dye degradation with industrial potential (2020) · cites this paper as [122]
Experimental — accuracy not yet measuredThe source backs part of the claim, not all of it — or backs it for a different population, condition or comparison.
In the citing paper
“Research conducted using again horseradish peroxidase for the decolorisation of 2 anthraquinone dyes, showed that the structure of the dye affected its decolorisation, despite the similar optimised operational conditions and the high decolorisation degrees achieved 122 .”
From Degradation of anthraquinone dyes from effluents: A review focusing on enzymatic dye degradation with industrial potential (2020) · cites this paper as [122]
Experimental — accuracy not yet measured
Self-check
Percentages, sums and reported differences re-computed from the paper’s own numbers.
The self-check needs the paper’s full text.
Citations
Cites
Robinson, T., McMullan, G., Marchant, R., & Nigam, P. (2001) · Bioresource Technology · doi:10.1016/s0960-8524(00)00080-8 · Cited by 4,422
Microbial decolorization of textile-dyecontaining effluents: A review
Banat, I. M., Nigam, P., Singh, D., & Marchant, R. (1996) · Bioresource Technology · doi:10.1016/s0960-8524(96)00113-7 · Cited by 1,502
dos Santos, A. B., Cervantes, F. J., & van Lier, J. B. (2007) · Bioresource Technology · doi:10.1016/j.biortech.2006.11.013 · Cited by 1,155
Teodoro, E.-S., John, B., Mark, C., Max, D., Michael, E., David, A. S., Saul, C.-A., & Nehemias, C.-H. (2006) · Applied Biochemistry and Biotechnology · doi:10.1385/abab:132:1:959 · Cited by 1,113
Microbial decolourisation and degradation of textile dyes
McMullan, G., Meehan, C., Conneely, A., Kirby, N., Robinson, T., Nigam, P., Banat, I. M., Marchant, R., & Smyth, W. F. (2001) · Applied Microbiology and Biotechnology · doi:10.1007/s002530000587 · Cited by 913
Novotný, Č., Dias, N., Kapanen, A., Malachová, K., Vándrovcová, M., Itävaara, M., & Lima, N. (2006) · Chemosphere · doi:10.1016/j.chemosphere.2005.10.002 · Cited by 353
Solubilization of Hydrophobic Dyes in Surfactant Solutions
Tehrani-Bagha, A., & Holmberg, K. (2013) · Materials · doi:10.3390/ma6020580 · Cited by 287
Recent Advances in Heterogeneous Photocatalytic Decolorization of Synthetic Dyes
Muhd Julkapli, N., Bagheri, S., & Bee Abd Hamid, S. (2014) · The Scientific World Journal · doi:10.1155/2014/692307 · Cited by 280
Decolorization of textile dyes by laccases from a newly isolated strain of Trametes modesta
Nyanhongo, G. S., Gomes, J., Gübitz, G. M., Zvauya, R., Read, J., & Steiner, W. (2002) · Water Research · doi:10.1016/s0043-1354(01)00365-7 · Cited by 279
Bayramoğlu, G., & Arica, M. Y. (2007) · Journal of Hazardous Materials · doi:10.1016/j.jhazmat.2007.12.008 · Cited by 247
Toxicity of textile dyes and their degradation by the enzyme horseradish peroxidase (HRP)
Ulson de Souza, S. M. A. G., Forgiarini, E., & Ulson de Souza, A. A. (2007) · Journal of Hazardous Materials · doi:10.1016/j.jhazmat.2007.06.003 · Cited by 243
Decolorization of reactive dyes by immobilized laccase
Peralta-Zamora, P., Pereira, C. M., Tiburtius, E. R. L., Moraes, S. G., Rosa, M. A., Minussi, R. C., & Durán, N. (2003) · Applied Catalysis B: Environmental · doi:10.1016/s0926-3373(02)00220-5 · Cited by 220
Acid azo dye degradation by free and immobilized horseradish peroxidase (HRP) catalyzed process
Mohan, S. V., Prasad, K. K., Rao, N. C., & Sarma, P. N. (2004) · Chemosphere · doi:10.1016/j.chemosphere.2004.09.070 · Cited by 214
Husain, Q. (2010) · Reviews in Environmental Science and Bio/Technology · doi:10.1007/s11157-009-9184-9 · Cited by 204
Peroxidase(s) in Environment Protection
Bansal, N., & Kanwar, S. S. (2013) · The Scientific World Journal · doi:10.1155/2013/714639 · Cited by 175
Wijetunga, S., Li, X., & Jian, C. (2010) · Journal of Hazardous Materials · doi:10.1016/j.jhazmat.2009.12.103 · Cited by 161
Mechanisms of compound I formation in heme peroxidases
Hiner, A. N. P., Raven, E. L., THORNELEY, R. N. F., Garcı́a-Cánovas, F., & Rodríguez‐López, J. N. (2002) · Journal of Inorganic Biochemistry · doi:10.1016/s0162-0134(02)00390-2 · Cited by 151
Song, S., Yao, J., He, Z., Qiu, J., & Chen, J. (2007) · Journal of Hazardous Materials · doi:10.1016/j.jhazmat.2007.06.104 · Cited by 123
Hadibarata, T., Adnan, L. A., Yusoff, A. R. M., Yuniarto, A., Rubiyatno, R., Zubir, M. M. F. A., Khudhair, A. B., Teh, Z. C., & Naser, M. A. (2013) · Water Air & Soil Pollution · doi:10.1007/s11270-013-1595-0 · Cited by 109
Liu, L., Zhang, J., Tan, Y., Jiang, Y., Hu, M., Li, S., & Zhai, Q. (2014) · Chemical Engineering Journal · doi:10.1016/j.cej.2014.01.063 · Cited by 102
Enzymatic Treatment and Detoxification of Acid Orange 7 from Textile Wastewater
Gholami-Borujeni, F., Mahvi, A. H., Nasseri, S., Faramarzi, M. A., Nabizadeh, R., & Alimohammadi, M. (2011) · Applied Biochemistry and Biotechnology · doi:10.1007/s12010-011-9345-5 · Cited by 101
Comparison of additives in the removal of phenolic compounds by peroxidase-catalyzed polymerization
Wu, Y., Taylor, K. E., Biswas, N., & Bewtra, J. K. (1997) · Water Research · doi:10.1016/s0043-1354(97)00119-x · Cited by 91
Purification and Partial Characterization of Broccoli (Brassica oleraceaVar.Italica) Peroxidases
Thongsook, T., & Barrett, D. M. (2005) · Journal of Agricultural and Food Chemistry · doi:10.1021/jf048162s · Cited by 74
Decolorization of Naphthol Blue Black using the Horseradish Peroxidase
Onder, S., Çelebi, M., Altıkatoğlu, M., Hatipoğlu, A., & Kuzu, H. (2010) · Applied Biochemistry and Biotechnology · doi:10.1007/s12010-010-9051-8 · Cited by 56
Kinetic modeling and simulation of in vitro transcription by phage T7 RNA polymerase
Arnold, S., Siemann, M., Scharnweber, K., Werner, M., Baumann, S., & Reuß, M. (2001) · Biotechnology and Bioengineering · doi:10.1002/1097-0290(20010305)72:5<562::aid-bit1020>3.0.co;2-s · Cited by 53
Andleeb, S., Atiq, N., Robson, G. D., & Ahmed, S. (2012) · Environmental Science and Pollution Research · doi:10.1007/s11356-011-0687-x · Cited by 50
High efficient degradation of dyes with lignin peroxidase coupled with glucose oxidase
Lan, J. Q., Huang, X., Hu, M., Li, Y., Qu, Y., Gao, P., & Wu, D. (2006) · Journal of Biotechnology · doi:10.1016/j.jbiotec.2005.12.034 · Cited by 46
Decolorization of different azo dyes by Phanerochaete chrysosporium RP78 under optimal condition
Ghasemi, F., Tabandeh, F., Bambai, B., et al. (2010) · International Journal of Environmental Science and Technology · doi:10.1007/bf03326155 · Cited by 43
An Introduction to Computational Biochemistry
Tsai, C. S. (2002) · Wiley eBooks · doi:10.1002/0471223840 · Cited by 41
Biotransformation studies of textile dye Remazol Orange 3R
Surwase, S. V., Deshpande, K. K., Phugare, S. S., & Jadhav, J. P. (2012) · 3 Biotech · doi:10.1007/s13205-012-0093-1 · Cited by 29
Oxidation of crocein orange G by lignin peroxidase isoenzymes
Ollikka, P., Harjunpää, T., Palmu, K., Mäntsälä, P., & Suominen, I. (1998) · Applied Biochemistry and Biotechnology · doi:10.1007/bf02787783 · Cited by 28
Arabaci, G., & Usluoglu, A. (2014) · The Scientific World Journal · doi:10.1155/2014/685975 · Cited by 22
Peroxidase‐catalyzed electrochemical assay of hydrogen peroxide: A ping–pong mechanism
Deyhimi, F., & Nami, F. (2012) · International Journal of Chemical Kinetics · doi:10.1002/kin.20719 · Cited by 22
Çelebi, M., Altıkatoğlu, M., Mustafaeva, Z., & Yıldırım, H. (2013) · Turkish Journal of Biochemistry · doi:10.5505/tjb.2013.96636 · Cited by 20
Treatment of a Textile Effluent from Dyeing with Cochineal Extracts UsingTrametes versicolorFungus
Figueroa, G. A., Ruiz-Aguilar, G. M. L., López-Martínez, L., et al. (2011) · The Scientific World JOURNAL · doi:10.1100/tsw.2011.99 · Cited by 17
Enzymatic decolorization of Orange II: Optimization by response surface methodology and pathway
Zhang, A., Li, F., Wang, J., & Liu, W. (2012) · Environmental Progress & Sustainable Energy · doi:10.1002/ep.11628 · Cited by 16
The biocidal properties of anthraquininoid dyes
LIU, J., & Sun, G. Z. (2008) · Dyes and Pigments · doi:10.1016/j.dyepig.2008.10.016 · Cited by 15
Role of Active Site Residues in Peroxidase Catalysis:Studies on Horseradish Peroxidase.
Bandyopadhyay, U., Adak, S., & Banerjee, R. K. (1999) · Cited by 9
Research works printed but not linked: 2
- Gholami-Borujeni F., 2013, Oxidative degradation and detoxification of textile azo dye by horseradish peroxidase enzyme, Fresenius Environmental Bulletin, 22, 739
- 10.1002/1097-0290(20010305)72:5x003C;562::aid-bit1020x0003e;3.3.co;2-j · DOI
Cited by
Efficiency of various recent wastewater dye removal methods: A review
Katheresan, V., Kansedo, J., & Lau, S. Y. (2018) · Journal of Environmental Chemical Engineering · doi:10.1016/j.jece.2018.06.060 · Cited by 2,752
Routoula, E., & Patwardhan, S. V. (2020) · Environmental Science & Technology · doi:10.1021/acs.est.9b03737 · Cited by 579
Biological treatment of model dyes and textile wastewaters
Paz, A., Carballo, J., Pérez, M. J., & Domínguez, J. M. (2017) · Chemosphere · doi:10.1016/j.chemosphere.2017.04.046 · Cited by 327
Techno-economic feasibility of biochar as biosorbent for basic dye sequestration
Praveen, S., Gokulan, R., Pushpa, T. B., & Jegan, J. (2021) · Journal of the Indian Chemical Society · doi:10.1016/j.jics.2021.100107 · Cited by 163
Metadata
- Authors
- Šekuljica, N. Ž., Prlainović, N. Ž., Stefanović, A. B., Žuža, M. G., Čičkarić, D. Z., Mijin, D. Ž., & Knežević-Jugović, Z. D.
- Venue
- The Scientific World Journal
- Publisher
- Wiley
- Published
- 2015-01
- Volume
- 2015
- Issue
- 1
- ISSN
- 2356-6140
- 1537-744X
- PMC
- PMC4313523
- Cited by
- 55
- References
- 38
- Language
- en
- Funders
- Ministry of Education, Science and Technological Development (III-46010 and 172013)
About these checks
Registry, retraction, Cites and statistics results are computed, not judged, with one exception: a printed reference that no index lists is read once by a model before it counts as a citation error. Claims are extracted by a model and kept only when their quote appears verbatim in the text; each cited source is then checked, with a model’s help, for whether it says what the claim relies on. Those verdicts can be wrong — read the claim’s quote and the cited source before relying on one.
Statistics and arithmetic are recomputed, not judged.
Confidence bands are shown only for fields calibrated on our annotated test set. None is calibrated yet, so no band is shown.
What counts as a claim ›How we measure confidence ›How we check this ›
Are you an author, or do you see a problem with this page? Request a review
Data sources
Bibliographic data: Semantic Scholar, OpenAlex, Crossref.
Contains information from the Semantic Scholar Academic Graph Datasets, made available under the ODC Attribution License (ODC-BY 1.0).
Semantic Scholar’s data is described in: Kinney, R., et al. (2023). The Semantic Scholar Open Data Platform. arXiv:2301.10140.
