

The DOI matches its Crossref record; 1 of the 1 references it cites were found in a registry or an index.
Optimization of the Time Window of Interest in Ovariectomized Imprinting Control Region Mice for Antiosteoporosis Research
Abstract
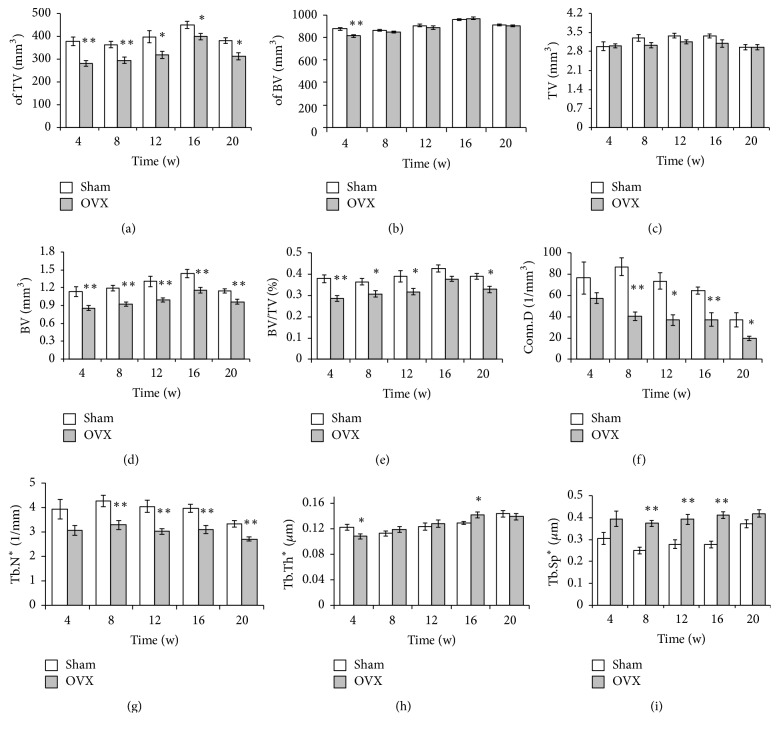
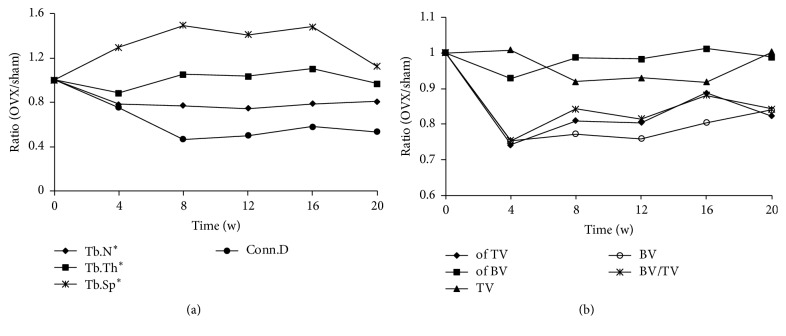
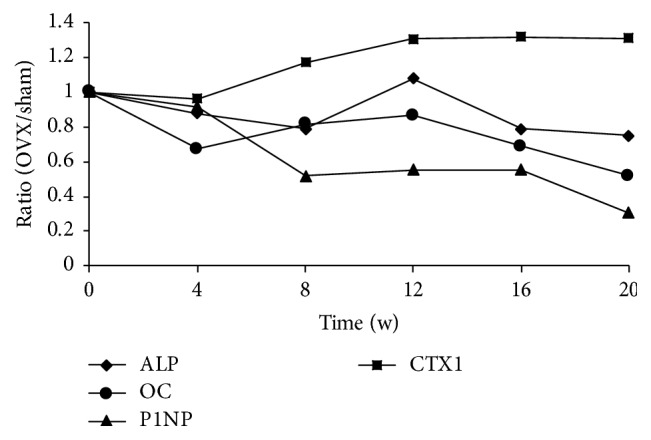
This study was performed to determine the optimal window of time during which the properties of osteoporosis are obvious and to explore the best region of interest for microstructural evaluation in antiosteoporosis research in an ovariectomized mouse model by examining changes in micro-computed tomography parameters and serum indices. Ovariectomized mice and sham-operated mice were randomly divided into five groups. At the end of the 4th, 8th, 12th, 16th, and 20th weeks after ovariectomy, the microstructure of the proximal tibia and distal femur was scanned by micro-computed tomography and blood samples were collected to detect serum biochemical indicators including alkaline phosphatase, osteocalcin, N-terminal propeptide of type I procollagen (P1NP), and C-terminal telopeptide fragment of type I collagen (CTX1). The trabecular number and connectivity density decreased while the trabecular thickness and trabecular separation increased, indicating substantial changes in the trabecular microstructure of both the tibia and femur and significant changes in bone turnover after ovariectomy, as indicated by lower levels of serum alkaline phosphatase, osteocalcin, and P1NP and higher level of CTX1 in the ovariectomy than sham group. The proximal tibia from weeks 8 to 16 after ovariectomy was optimal for osteoporosis research in this model.
Overview
The claims and statistics of this paper haven’t been checked yet.
Run the check — free, no account needed. It reads the open-access text and checks the sources it cites.
Integrity signals
Registry
Cites
Statistics
Figures
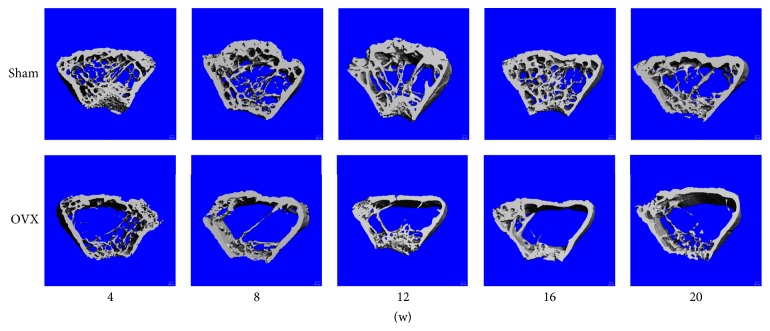
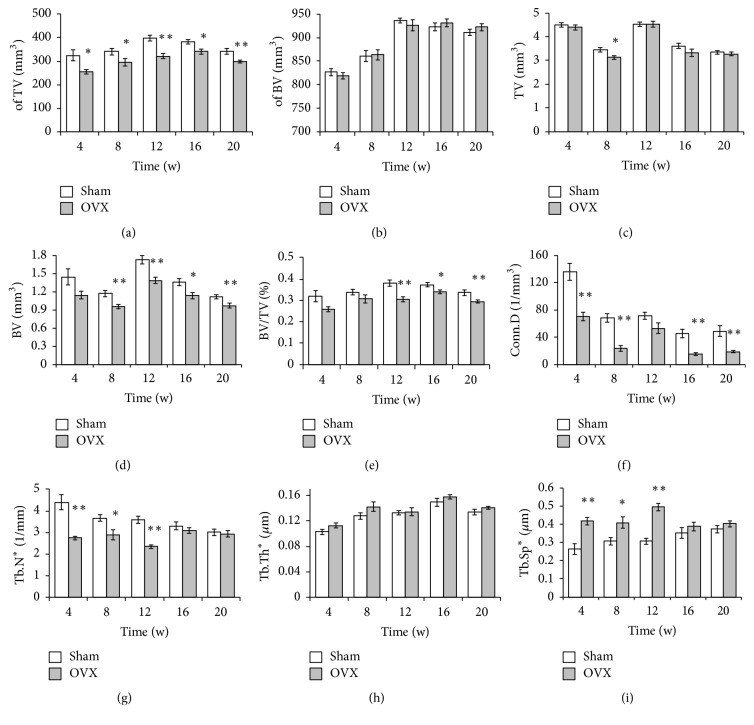
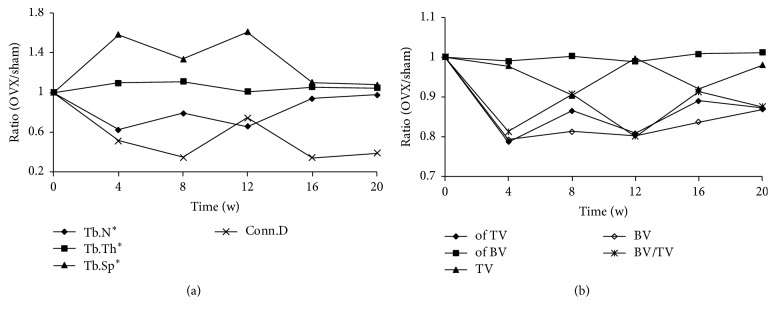
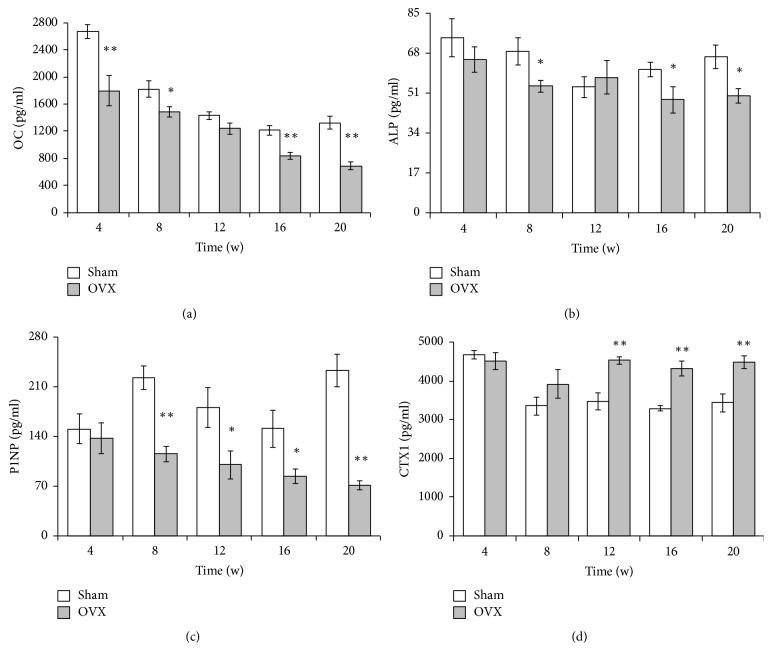
Verification
Claims the paper makes
The claims and statistics of this paper haven’t been checked yet.
Run the check — free, no account needed. It reads the open-access text and checks the sources it cites.
Claims other papers make about this one
Each is checked against this paper’s own text: does it say what the citing paper says it does?
In the citing paper
“This model induces estrogen deficiency-induced osteoporosis, leading to an increase in RANKL expression that elevates bone resorption and bone turnover rate. Ultimately, it leads to a reduction in BMD and significant disruption of the trabecular microstructure [35].”
From Anti-Osteoporotic Potential of Water Extract of Anethum graveolens L. Seeds (2023) · cites this paper as [35]
Self-check
Percentages, sums and reported differences re-computed from the paper’s own numbers.
The self-check needs the paper’s full text.
Citations
Cites
Use of bone turnover markers in postmenopausal osteoporosis
Eastell, R., & Szulc, P. (2017) · The Lancet Diabetes & Endocrinology · doi:10.1016/s2213-8587(17)30184-5 · Cited by 594
Research works printed but not linked: 27
- 2014, Plos One, 9
- 2014, Clinical Cases in Mineral & Bone Metabolism the Official Journal of the Italian Society of Osteoporosis Mineral Metabolism & Skeletal Diseases, 11, 201
- 2015, Digestive Diseases and Sciences, 60, 1
- 10.1016/s0140-6736(06)68891-0 · DOI
- 10.1186/s40199-017-0167-z · DOI
- 10.1007/s00198-014-2857-4 · DOI
- 10.1177/154405910608500703 · DOI
- 10.3892/etm.2015.2553 · DOI
- 10.4162/nrp.2015.9.5.459 · DOI
- 10.1371/journal.pone.0060569 · DOI
- 10.1097/01.brs.0000172230.01655.55 · DOI
- 10.1055/s-0035-1556582 · DOI
- 10.1007/s001980170022 · DOI
- 1998, International Journal of Clinical Practice, 52, 255, 10.1111/j.1742-1241.1998.tb11620.x · DOI
- 10.1016/S0140-6736(02)08657-9 · DOI · Paper page
- 10.1007/s00198-015-3126-x · DOI
- 10.1007/s00394-014-0768-y · DOI
- 2014, Clinical Cases in Mineral and Bone Metabolism, 12
- 1987, Journal of Bone and Mineral Research, 2, 221, 10.1002/jbmr.5650020309 · DOI
- 10.3349/ymj.2016.57.6.1386 · DOI
- 10.1007/s00198-015-3318-4 · DOI
- 10.1016/j.jcma.2016.11.006 · DOI
- 10.1590/S0102-865020150110000002 · DOI
- 10.1007/s00223-015-9991-7 · DOI
- 10.1371/journal.pone.0140346 · DOI
- 10.1007/s00198-008-0660-9 · DOI
- 10.1155/2015/897639 · DOI
Cited by
Anti-Osteoporotic Potential of Water Extract of Anethum graveolens L. Seeds
Jang, S.-A., Lee, S.-J., Hwang, Y.-H., & Ha, H. (2023) · Nutrients · doi:10.3390/nu15194302 · Cited by 2
Metadata
- Authors
- Song, L., Bi, Y.-N., Zhang, P.-Y., Yuan, X.-M., Liu, Y., Zhang, Y., Huang, J.-Y., & Zhou, K.
- Venue
- BioMed Research International
- Publisher
- Wiley
- Published
- 2017
- Volume
- 2017
- Pages
- 1-10
- ISSN
- 2314-6133
- 2314-6141
- PMC
- PMC5651096
- Cited by
- 21
- References
- 1
- Language
- en
- Funders
- National Natural Science Foundation of China (81673826, 2011ZX09201-201-21)
- National Science and Technology Major Projects (81673826, 2011ZX09201-201-21)
About these checks
Registry, retraction, Cites and statistics results are computed, not judged, with one exception: a printed reference that no index lists is read once by a model before it counts as a citation error. Claims are extracted by a model and kept only when their quote appears verbatim in the text; each cited source is then checked, with a model’s help, for whether it says what the claim relies on. Those verdicts can be wrong — read the claim’s quote and the cited source before relying on one.
Statistics and arithmetic are recomputed, not judged.
Confidence bands are shown only for fields calibrated on our annotated test set. None is calibrated yet, so no band is shown.
What counts as a claim ›How we measure confidence ›How we check this ›
Are you an author, or do you see a problem with this page? Request a review
Data sources
Bibliographic data: Semantic Scholar, OpenAlex, Crossref.
Contains information from the Semantic Scholar Academic Graph Datasets, made available under the ODC Attribution License (ODC-BY 1.0).
Semantic Scholar’s data is described in: Kinney, R., et al. (2023). The Semantic Scholar Open Data Platform. arXiv:2301.10140.
