Cited by 53

The DOI matches its Crossref record; 5 of the 5 references it cites were found in a registry or an index.

mTOR Modulates Methamphetamine‐Induced Toxicity through Cell Clearing Systems

Lazzeri, Gloria, Biagioni, Francesca, Fulceri, Federica, Busceti, Carla L., Scavuzzo, Maria C., Ippolito, Chiara, Salvetti, Alessandra, Lenzi, Paola, Fornai, Francesco·2018·Oxidative Medicine and Cellular Longevity

Abstract

Methamphetamine (METH) is abused worldwide, and it represents a threat for public health. METH exposure induces a variety of detrimental effects. In fact, METH produces a number of oxidative species, which lead to lipid peroxidation, protein misfolding, and nuclear damage. Cell clearing pathways such as ubiquitin‐proteasome (UP) and autophagy (ATG) are involved in METH‐induced oxidative damage. Although these pathways were traditionally considered to operate as separate metabolic systems, recent studies demonstrate their interconnection at the functional and biochemical level. Very recently, the convergence between UP and ATG was evidenced within a single organelle named autophagoproteasome (APP), which is suppressed by mTOR activation. In the present research study, the occurrence of APP during METH toxicity was analyzed. In fact, coimmunoprecipitation indicates a binding between LC3 and P20S particles, which also recruit p62 and alpha‐synuclein. The amount of METH‐induced toxicity correlates with APP levels. Specific markers for ATG and UP, such as LC3 and P20S in the cytosol, and within METH‐induced vacuoles, were measured at different doses and time intervals following METH administration either alone or combined with mTOR modulators. Western blotting, coimmunoprecipitation, light microscopy, confocal microscopy, plain transmission electron microscopy, and immunogold staining were used to document the effects of mTOR modulation on METH toxicity and the merging of UP with ATG markers within APPs. METH‐induced cell death is prevented by mTOR inhibition, while it is worsened by mTOR activation, which correlates with the amount of autophagoproteasomes. The present data, which apply to METH toxicity, are also relevant to provide a novel insight into cell clearing pathways to counteract several kinds of oxidative damage.

Overview

The claims and statistics of this paper haven’t been checked yet.

Run the check — free, no account needed. It reads the open-access text and checks the sources it cites.

A few free checks a day · papers already verified open instantly · results are public

Integrity signals

Registry

Crossref · 10.1155/2018/6124745

Cites

5 of 5 references verified0 citation errors · 0 not checkable

Statistics

Figures

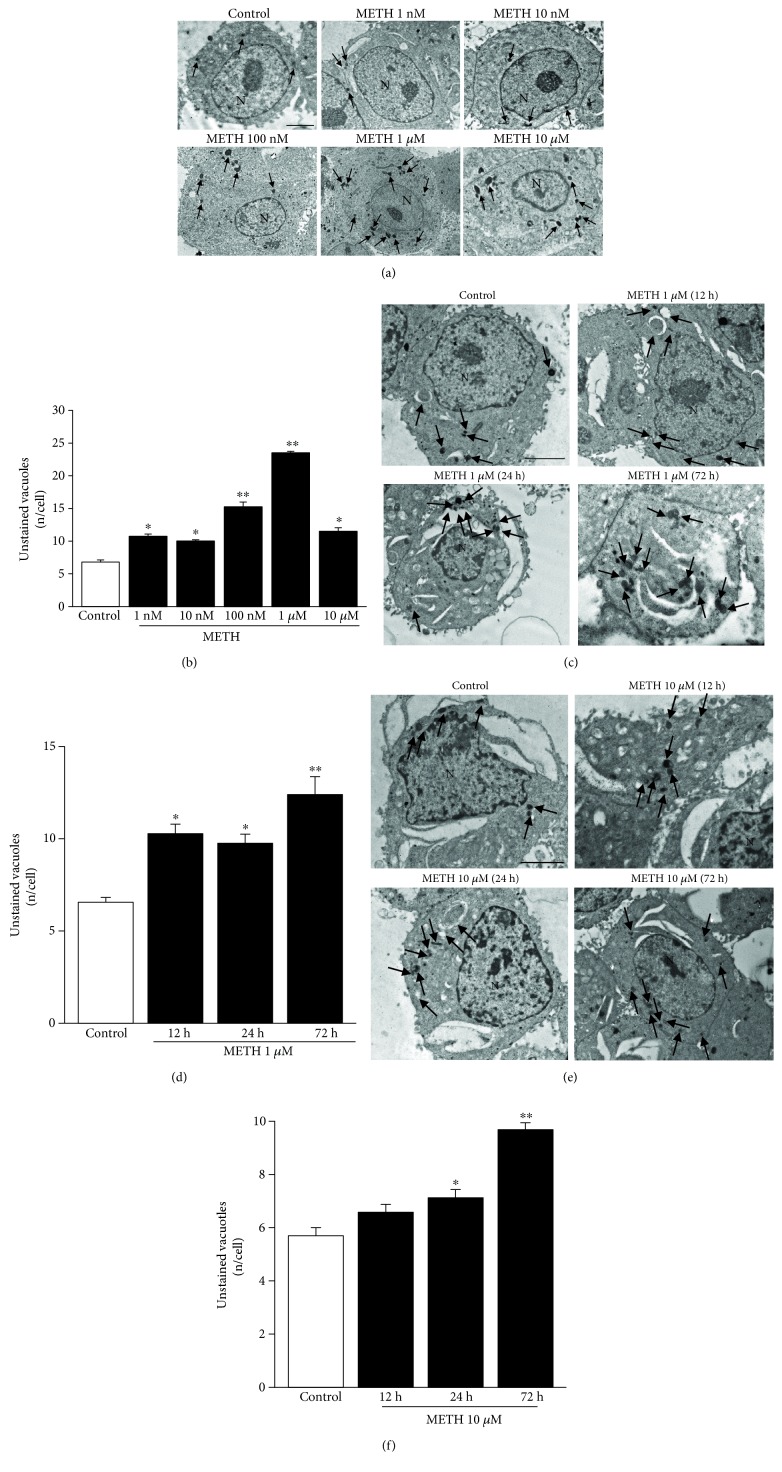
Figure 1 METH increases the amount of unstained vacuoles dose- and time-dependently. (a) Dose-dependent representative pictures of unstained vacuoles (arrows) of control and METH at 72 h treated cells at different doses. (b) Dose-dependent graph of unstained vacuoles per cell at 72 h. (c) Time-dependent representative pictures of unstained vacuoles (arrows) of control and 1 μM METH-treated cells. (d) Time-dependent graph of unstained vacuoles per cell of control and 1 μM METH-treated cells. (e) Time-dependent representative pictures of unstained vacuoles (arrows) of control and 10 μM METH-treated cells. (f) Time-dependent graph of unstained vacuoles per cell of control and 10 μM METH-treated cells. Values are given as the mean number of unstained vacuoles, which were counted in 50 cells per group. Error bars represent the standard error of the mean. ∗ p ≤ 0.05 vs. control; ∗∗ p ≤ 0.05 vs. other groups. N = nucleus. Scale bar = 1 μm.
Figure 1 METH increases the amount of unstained vacuoles dose- and time-dependently. (a) Dose-dependent representative pictures of unstained vacuoles (arrows) of control and METH at 72 h treated cells at different doses. (b) Dose-dependent graph of unstained vacuoles per cell at 72 h. (c) Time-dependent representative pictures of unstained vacuoles (arrows) of control and 1 μM METH-treated cells. (d) Time-dependent graph of unstained vacuoles per cell of control and 1 μM METH-treated cells. (e) Time-dependent representative pictures of unstained vacuoles (arrows) of control and 10 μM METH-treated cells. (f) Time-dependent graph of unstained vacuoles per cell of control and 10 μM METH-treated cells. Values are given as the mean number of unstained vacuoles, which were counted in 50 cells per group. Error bars represent the standard error of the mean. ∗ p ≤ 0.05 vs. control; ∗∗ p ≤ 0.05 vs. other groups. N = nucleus. Scale bar = 1 μm.CC BY · PubMed Central
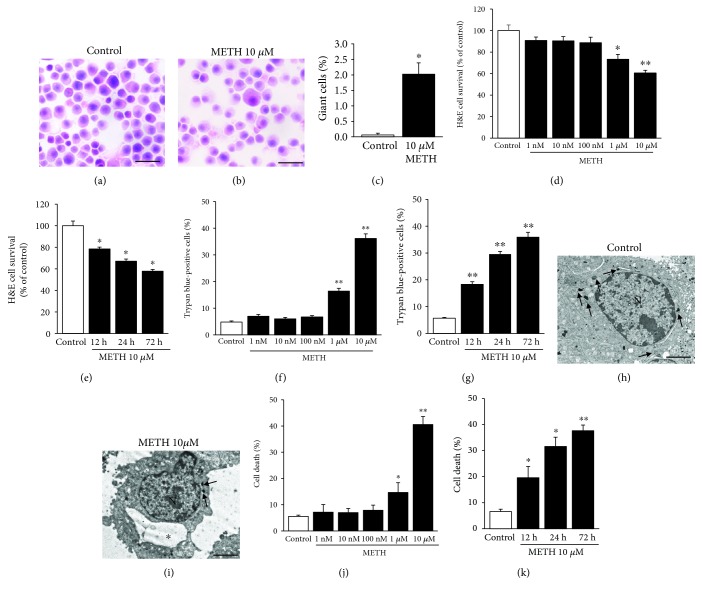
Figure 2 METH induces cell death time- and dose-dependently with a maximal effect at the 1 μM and 10 μM doses. (a) Representative H&E-stained picture from controls. (b) Representative H&E-stained picture following 10 μM METH at 72 h. (c) Graph reporting the percentage of giant cells counted in H&E-stained total cells from controls and METH at 72 h. (d) Dose-dependent graph of H&E-stained cells from control and METH at 72 h. (e) Time-dependent graph of H&E-stained cells from control and 10 μM METH-treated cells. (f) Dose-dependent graph of trypan blue-stained cells from control and METH at 72 h. (g) Time-dependent graph of trypan blue-stained cells from control and 10 μM METH-treated cells. (h) Representative micrograph from a control cell. (h) Representative micrograph from a control cell. (i) Representative micrograph from a METH cell at 72 h. (j) Dose-dependent graph of cell death from control and METH at 72 h. (m) Time-dependent graph of cell death from control and 10 μM METH-treated cells. For the graphs in (c)–(g), values are given as the percentage of cell counted in two triplicates (n = 6). For the graphs in (j) and (k), values are given as the percentage of cell counted on 5 grids. Error bars represent the standard error of the mean. ∗ p ≤ 0.05 vs. control, ∗∗ p ≤ 0.05 vs. other groups. Arrows point to vacuoles; asterisk (∗) indicates a large vacuole. N = nucleus. Scale bar = 23.4 μm (a, b) and 2 μm (h, i).
Figure 2 METH induces cell death time- and dose-dependently with a maximal effect at the 1 μM and 10 μM doses. (a) Representative H&E-stained picture from controls. (b) Representative H&E-stained picture following 10 μM METH at 72 h. (c) Graph reporting the percentage of giant cells counted in H&E-stained total cells from controls and METH at 72 h. (d) Dose-dependent graph of H&E-stained cells from control and METH at 72 h. (e) Time-dependent graph of H&E-stained cells from control and 10 μM METH-treated cells. (f) Dose-dependent graph of trypan blue-stained cells from control and METH at 72 h. (g) Time-dependent graph of trypan blue-stained cells from control and 10 μM METH-treated cells. (h) Representative micrograph from a control cell. (h) Representative micrograph from a control cell. (i) Representative micrograph from a METH cell at 72 h. (j) Dose-dependent graph of cell death from control and METH at 72 h. (m) Time-dependent graph of cell death from control and 10 μM METH-treated cells. For the graphs in (c)–(g), values are given as the percentage of cell counted in two triplicates (n = 6). For the graphs in (j) and (k), values are given as the percentage of cell counted on 5 grids. Error bars represent the standard error of the mean. ∗ p ≤ 0.05 vs. control, ∗∗ p ≤ 0.05 vs. other groups. Arrows point to vacuoles; asterisk (∗) indicates a large vacuole. N = nucleus. Scale bar = 23.4 μm (a, b) and 2 μm (h, i).CC BY · PubMed Central
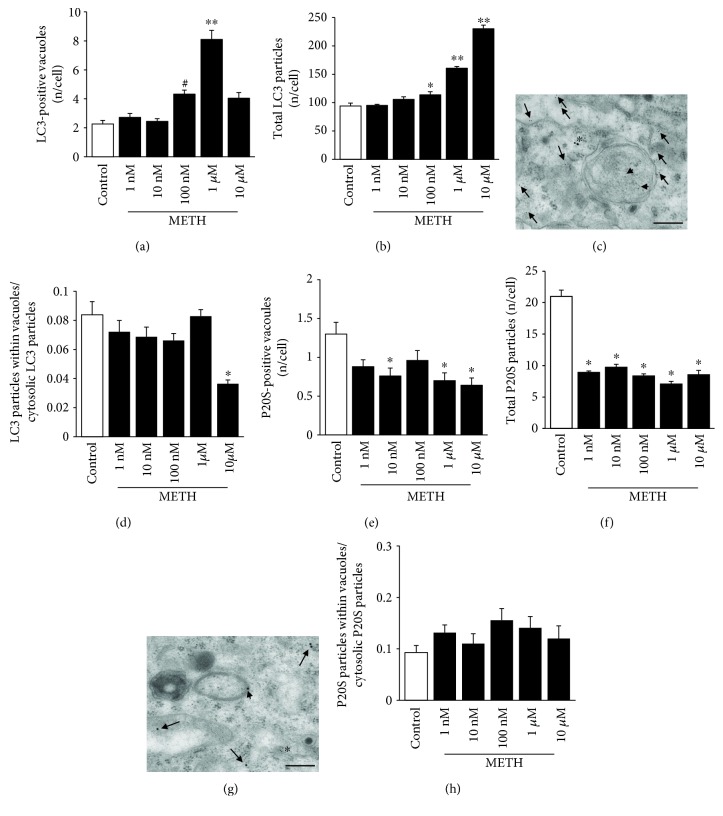
Figure 3 METH alters the amount and placement of LC3 and P20S particles dose-dependently, with P20S being more sensitive than LC3. (a) Dose-dependent graph of the number of LC3-positive vacuoles per cell from controls and METH at 72 h. (b) Dose-dependent graph of total LC3 particles per cell from controls and METH at 72 h. (c) Representative micrograph of LC3-positive vacuole from 10 μM METH at 72 h. (d) Dose-dependent graph of the ratio between the numbers of LC3 particles within vacuoles with respect to cytosolic LC3 particles from controls and METH at 72 h. (e) Dose-dependent graph of the number of P20S-positive vacuoles per cell from controls and METH at 72 h. (f) Dose-dependent graph of total P20S particles per cell from controls and METH at 72 h. (g) Representative micrograph of P20S-positive vacuoles from 10 μM METH at 72 h. (h) Dose-dependent graph of the ratio between the numbers of P20S particles within vacuoles with respect to cytosolic P20S particles from controls and METH at 72 h. Values are given as the mean number of LC3 or P20S particles and vacuoles counted in 50 cells per group. Error bars represent the standard error of the mean. ∗ p ≤ 0.05 vs. control; ∗∗ p ≤ 0.05 vs. other groups; # p ≤ 0.05 vs. control and 1 nM and 10 nM METH. Arrows point to free cytosolic LC3 (10 nm) or P20S (20 nm); arrowheads point to LC3 (10 nm) or P20S (20 nm) within vacuoles; asterisk (∗) indicates P20S in the cytosol (c) and LC3 in the cytosol (g). Scale bar = 200 nm.
Figure 3 METH alters the amount and placement of LC3 and P20S particles dose-dependently, with P20S being more sensitive than LC3. (a) Dose-dependent graph of the number of LC3-positive vacuoles per cell from controls and METH at 72 h. (b) Dose-dependent graph of total LC3 particles per cell from controls and METH at 72 h. (c) Representative micrograph of LC3-positive vacuole from 10 μM METH at 72 h. (d) Dose-dependent graph of the ratio between the numbers of LC3 particles within vacuoles with respect to cytosolic LC3 particles from controls and METH at 72 h. (e) Dose-dependent graph of the number of P20S-positive vacuoles per cell from controls and METH at 72 h. (f) Dose-dependent graph of total P20S particles per cell from controls and METH at 72 h. (g) Representative micrograph of P20S-positive vacuoles from 10 μM METH at 72 h. (h) Dose-dependent graph of the ratio between the numbers of P20S particles within vacuoles with respect to cytosolic P20S particles from controls and METH at 72 h. Values are given as the mean number of LC3 or P20S particles and vacuoles counted in 50 cells per group. Error bars represent the standard error of the mean. ∗ p ≤ 0.05 vs. control; ∗∗ p ≤ 0.05 vs. other groups; # p ≤ 0.05 vs. control and 1 nM and 10 nM METH. Arrows point to free cytosolic LC3 (10 nm) or P20S (20 nm); arrowheads point to LC3 (10 nm) or P20S (20 nm) within vacuoles; asterisk (∗) indicates P20S in the cytosol (c) and LC3 in the cytosol (g). Scale bar = 200 nm.CC BY · PubMed Central
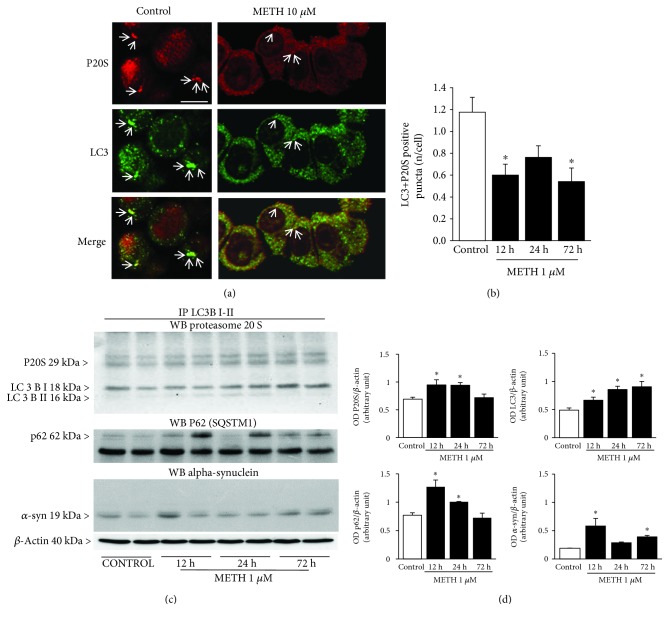
Figure 4 METH reduces the occurrence of the autophagoproteasome (APP) which hosts LC3, P20S, p62, and alpha-synuclein. (a) Representative immunofluorescence from controls and METH at 72 h. (b) Time-dependent graph of the number of LC3 + P20S-positive puncta per cell from control and METH at 1 μM. (c) P20S, p62, and alpha-synuclein Western blotting on LC3BI-II immunoprecipitates. (d) Densitometric analysis. Values are given as the optical density detected in four separate replicates (n = 4). Values are given as the mean number of LC3 + P20S puncta counted in 4 slides. Error bars represent the standard error of the mean. ∗ p ≤ 0.05 vs. control. Arrows point to P20S (red fluorescence) or LC3 (green fluorescence) or merge P20S and LC3 (orange fluorescence). Scale bar = 6.6 μm.
Figure 4 METH reduces the occurrence of the autophagoproteasome (APP) which hosts LC3, P20S, p62, and alpha-synuclein. (a) Representative immunofluorescence from controls and METH at 72 h. (b) Time-dependent graph of the number of LC3 + P20S-positive puncta per cell from control and METH at 1 μM. (c) P20S, p62, and alpha-synuclein Western blotting on LC3BI-II immunoprecipitates. (d) Densitometric analysis. Values are given as the optical density detected in four separate replicates (n = 4). Values are given as the mean number of LC3 + P20S puncta counted in 4 slides. Error bars represent the standard error of the mean. ∗ p ≤ 0.05 vs. control. Arrows point to P20S (red fluorescence) or LC3 (green fluorescence) or merge P20S and LC3 (orange fluorescence). Scale bar = 6.6 μm.CC BY · PubMed Central
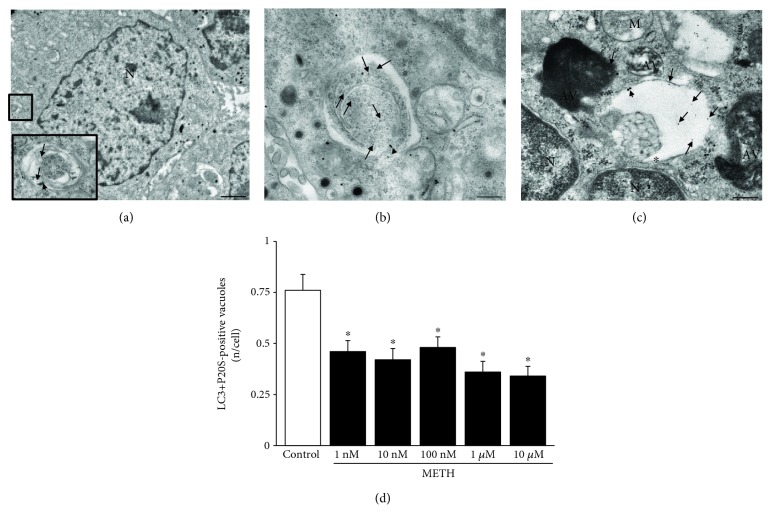
Figure 5 METH reduces the occurrence of autophagoproteasomes (APPs) dose-dependently. (a) Representative picture of a PC12 cell (low magnification) and an APP vacuole (high magnification). (b, c) Representative pictures of APP vacuoles stained for both LC3 (10 nm) and P20S (20 nm) immunogold particles. (d) Dose-dependent graph of the number of LC3 + P20S-positive vacuoles per cell from control and METH at 72 h. Values are given as the mean number of LC3 + P20S-positive vacuoles counted in 100 cells per group. Error bars represent the standard error of the mean. ∗ p ≤ 0.05 vs. control. Arrows point to free LC3 particles (10 nm); arrowheads point to P20S particles (20 nm); asterisk (∗) indicates a double membrane (b, c). N = nucleus; AV = autophagic vacuoles; M = mitochondrion. Scale bar = 220 nm.
Figure 5 METH reduces the occurrence of autophagoproteasomes (APPs) dose-dependently. (a) Representative picture of a PC12 cell (low magnification) and an APP vacuole (high magnification). (b, c) Representative pictures of APP vacuoles stained for both LC3 (10 nm) and P20S (20 nm) immunogold particles. (d) Dose-dependent graph of the number of LC3 + P20S-positive vacuoles per cell from control and METH at 72 h. Values are given as the mean number of LC3 + P20S-positive vacuoles counted in 100 cells per group. Error bars represent the standard error of the mean. ∗ p ≤ 0.05 vs. control. Arrows point to free LC3 particles (10 nm); arrowheads point to P20S particles (20 nm); asterisk (∗) indicates a double membrane (b, c). N = nucleus; AV = autophagic vacuoles; M = mitochondrion. Scale bar = 220 nm.CC BY · PubMed Central
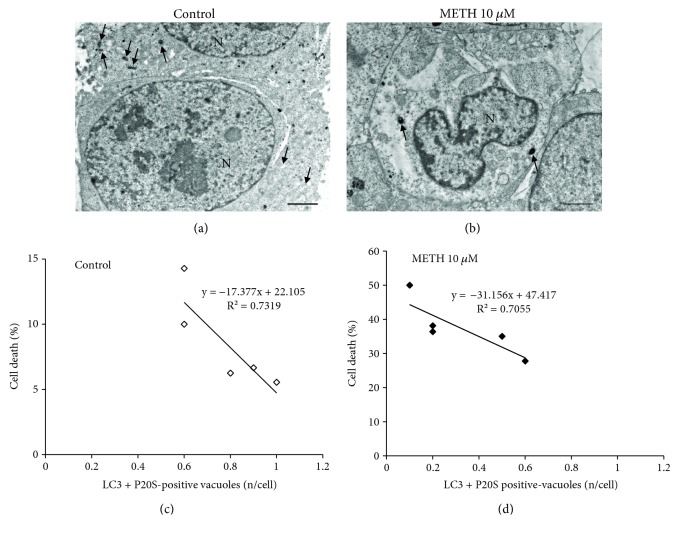
Figure 6 Inverse correlation between the occurrence of APP and METH-induced toxicity. (a) Representative micrograph from a control cell. (b) Representative micrograph from a cell following METH at 72 h. (c) Linear regression between the percentage of cell death and the number of LC3 + P20S-positive vacuoles in control. (d) Linear regression between the percentage of cell death and the number of LC3 + P20S-positive vacuoles following METH at 72 h. The puncta reported in the graphs ((c) white square and (d) black square) correspond to the number of grid (n = 5). Arrows point to vacuoles. N = nucleus. Scale bar = 1 μm.
Figure 6 Inverse correlation between the occurrence of APP and METH-induced toxicity. (a) Representative micrograph from a control cell. (b) Representative micrograph from a cell following METH at 72 h. (c) Linear regression between the percentage of cell death and the number of LC3 + P20S-positive vacuoles in control. (d) Linear regression between the percentage of cell death and the number of LC3 + P20S-positive vacuoles following METH at 72 h. The puncta reported in the graphs ((c) white square and (d) black square) correspond to the number of grid (n = 5). Arrows point to vacuoles. N = nucleus. Scale bar = 1 μm.CC BY · PubMed Central
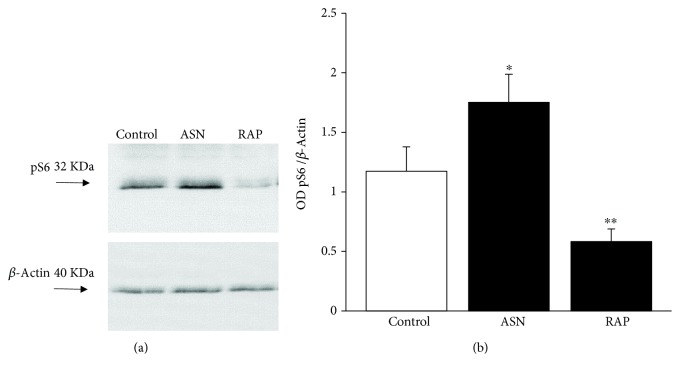
Figure 7 Modulation of pS6 levels underlie mTOR inhibition and activation by rapamycin and asparagine, respectively. (a) Representative SDS-PAGE immunoblotting of pS6 protein. (d) Densitometric analysis. Values are given as the optical density detected in six separate replicates (n = 6). Error bars represent the standard error of the mean. ∗ p ≤ 0.05 vs. control; ∗∗ p ≤ 0.05 vs. control and METH. ASN = asparagine; RAP = rapamycin.
Figure 7 Modulation of pS6 levels underlie mTOR inhibition and activation by rapamycin and asparagine, respectively. (a) Representative SDS-PAGE immunoblotting of pS6 protein. (d) Densitometric analysis. Values are given as the optical density detected in six separate replicates (n = 6). Error bars represent the standard error of the mean. ∗ p ≤ 0.05 vs. control; ∗∗ p ≤ 0.05 vs. control and METH. ASN = asparagine; RAP = rapamycin.CC BY · PubMed Central
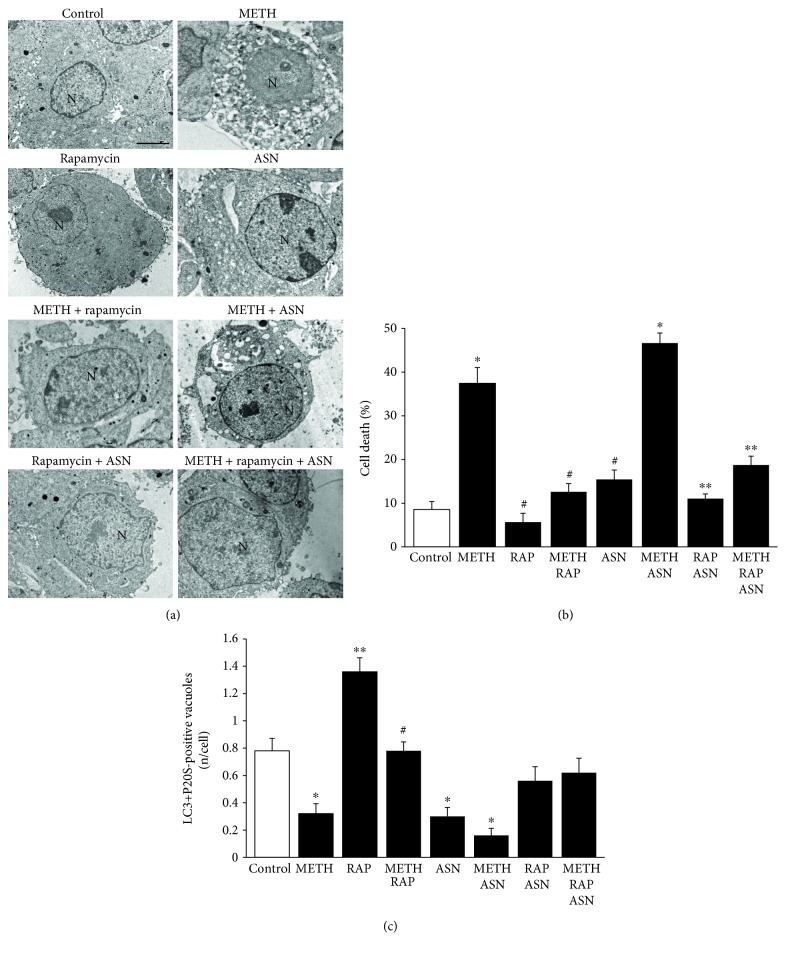
Figure 8 mTOR inhibition prevents cell death and rescues the amount of APPs induced by METH and the mTOR activator asparagine. (a) Representative micrographs of control and following METH 10 μM, rapamycin 100 nM, and asparagine 50 mM, at 72 h. (b) Graph of the percentage of cell death in control and following METH 10 μM, rapamycin 100 nM, and asparagine 50 mM, at 72 h. (c) Graph of the number of LC3 + P20S-positive vacuoles in control and following METH 10 μM, rapamycin 100 nM, and asparagine 50 mM, at 72 h. For the graph in (b), values are given as the percentage of cell counted on 5 grids. For the graph in (c), values are given as the mean number of LC3 + P20S-positive vacuoles counted in 100 cells per group. Error bars represent the standard error of the mean. ∗ p ≤ 0.05 vs. control; ∗∗ p ≤ 0.05 vs. control and METH; # p ≤ 0.05 vs. METH. N = nucleus; ASN = asparagine; RAP = rapamycin. Scale bar = 0.5 μm.
Figure 8 mTOR inhibition prevents cell death and rescues the amount of APPs induced by METH and the mTOR activator asparagine. (a) Representative micrographs of control and following METH 10 μM, rapamycin 100 nM, and asparagine 50 mM, at 72 h. (b) Graph of the percentage of cell death in control and following METH 10 μM, rapamycin 100 nM, and asparagine 50 mM, at 72 h. (c) Graph of the number of LC3 + P20S-positive vacuoles in control and following METH 10 μM, rapamycin 100 nM, and asparagine 50 mM, at 72 h. For the graph in (b), values are given as the percentage of cell counted on 5 grids. For the graph in (c), values are given as the mean number of LC3 + P20S-positive vacuoles counted in 100 cells per group. Error bars represent the standard error of the mean. ∗ p ≤ 0.05 vs. control; ∗∗ p ≤ 0.05 vs. control and METH; # p ≤ 0.05 vs. METH. N = nucleus; ASN = asparagine; RAP = rapamycin. Scale bar = 0.5 μm.CC BY · PubMed Central
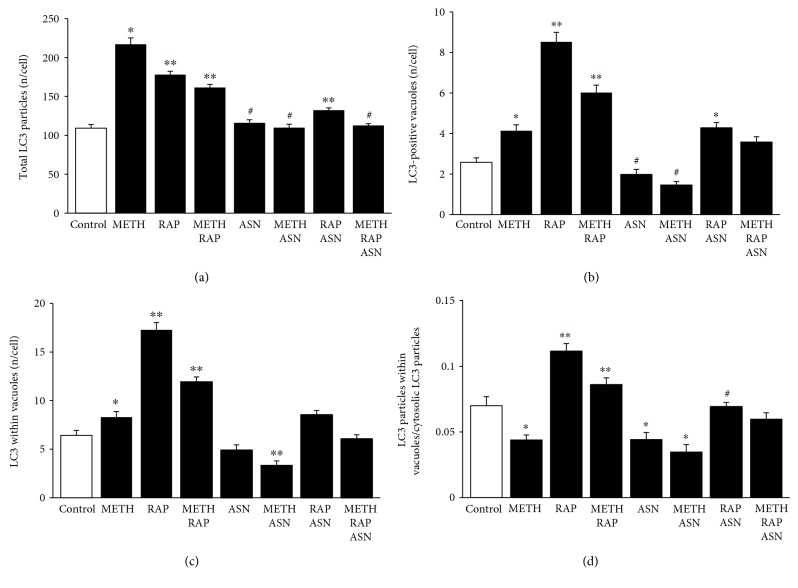
Figure 9 mTOR modulates the number and placement of LC3 particles. (a) The graph shows the number of total LC3 particles per cell in control, following METH 10 μM, rapamycin 100 nM, and asparagine 50 mM, at 72 h. (b) The graph shows the number of LC3-positive vacuoles per cell in control, following METH 10 μM, rapamycin 100 nM, and asparagine 50 mM, at 72 h. (c) The graph shows the number of LC3-positive vacuoles in control and following METH 10 μM, rapamycin 100 nM, and asparagine 50 mM, at 72 h. (d) The graph shows the ratio between the number of LC3 particles within vacuoles and cytosolic LC3 particles. Values are given as the mean number of LC3 particles and vacuoles counted in 50 cells per group. Error bars represent the standard error of the mean. ∗ p ≤ 0.05 vs. control; ∗∗ p ≤ 0.05 vs. control and METH; # p ≤ 0.05 vs. METH.
Figure 9 mTOR modulates the number and placement of LC3 particles. (a) The graph shows the number of total LC3 particles per cell in control, following METH 10 μM, rapamycin 100 nM, and asparagine 50 mM, at 72 h. (b) The graph shows the number of LC3-positive vacuoles per cell in control, following METH 10 μM, rapamycin 100 nM, and asparagine 50 mM, at 72 h. (c) The graph shows the number of LC3-positive vacuoles in control and following METH 10 μM, rapamycin 100 nM, and asparagine 50 mM, at 72 h. (d) The graph shows the ratio between the number of LC3 particles within vacuoles and cytosolic LC3 particles. Values are given as the mean number of LC3 particles and vacuoles counted in 50 cells per group. Error bars represent the standard error of the mean. ∗ p ≤ 0.05 vs. control; ∗∗ p ≤ 0.05 vs. control and METH; # p ≤ 0.05 vs. METH.CC BY · PubMed Central
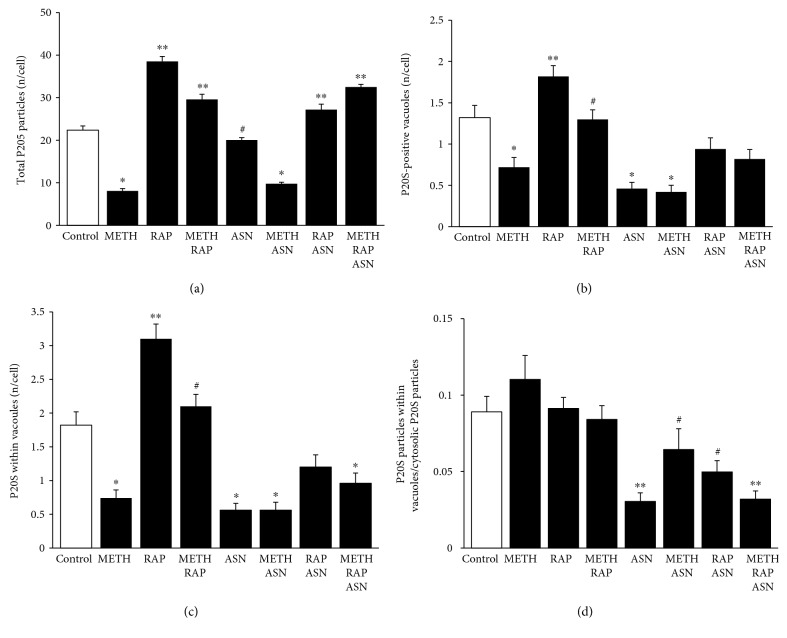
Figure 10 mTOR modulates the number and placement of P20S particles. (a) The graph shows the number of total P20S particles per cell in control, following METH 10 μM, rapamycin 100 nM, and asparagine 50 mM, at 72 h. (b) The graph shows the number of P20S-positive vacuoles per cell in control, following METH 10 μM, rapamycin 100 nM, and asparagine 50 mM, at 72 h. (c) The graph shows the number of P20S-positive vacuoles in control and following METH 10 μM, rapamycin 100 nM, and asparagine 50 mM, at 72 h. (d) The graph shows the ratio between the number of P20S particles within vacuoles and cytosolic P20S particles. Values are given as the mean number of P20S particles and vacuoles counted in 50 cells per group. Error bars represent the standard error of the mean. ∗ p ≤ 0.05 vs. control; ∗∗ p ≤ 0.05 vs. control and METH; # p ≤ 0.05 vs. METH. ASN = asparagine; RAP = rapamycin.
Figure 10 mTOR modulates the number and placement of P20S particles. (a) The graph shows the number of total P20S particles per cell in control, following METH 10 μM, rapamycin 100 nM, and asparagine 50 mM, at 72 h. (b) The graph shows the number of P20S-positive vacuoles per cell in control, following METH 10 μM, rapamycin 100 nM, and asparagine 50 mM, at 72 h. (c) The graph shows the number of P20S-positive vacuoles in control and following METH 10 μM, rapamycin 100 nM, and asparagine 50 mM, at 72 h. (d) The graph shows the ratio between the number of P20S particles within vacuoles and cytosolic P20S particles. Values are given as the mean number of P20S particles and vacuoles counted in 50 cells per group. Error bars represent the standard error of the mean. ∗ p ≤ 0.05 vs. control; ∗∗ p ≤ 0.05 vs. control and METH; # p ≤ 0.05 vs. METH. ASN = asparagine; RAP = rapamycin.CC BY · PubMed Central
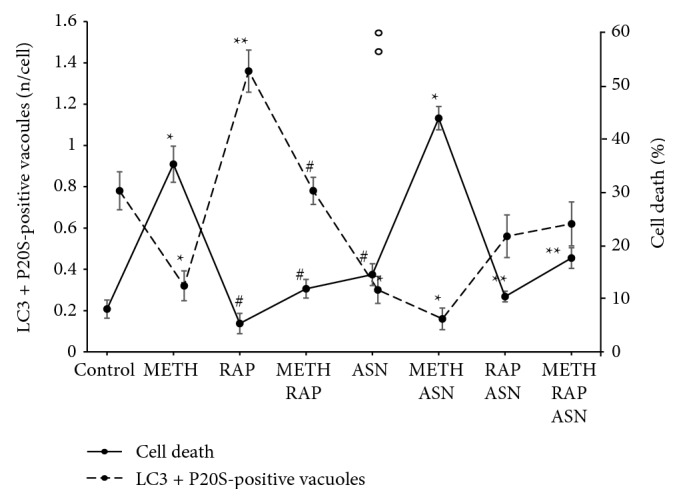
Figure 11 Inverse correlation between cell death and amount of APPs following mTOR modulation. The dashed line shows the amount of APPs while the continuous line shows the percentage of cell death. For each treatment, the values of the two lines produce a mirror image, which indicates a negative correlation. ∗ p ≤ 0.05 vs. control; ∗∗ p ≤ 0.05 vs. control and METH; # p ≤ 0.05 vs. METH. ASN = asparagine; RAP = rapamycin.
Figure 11 Inverse correlation between cell death and amount of APPs following mTOR modulation. The dashed line shows the amount of APPs while the continuous line shows the percentage of cell death. For each treatment, the values of the two lines produce a mirror image, which indicates a negative correlation. ∗ p ≤ 0.05 vs. control; ∗∗ p ≤ 0.05 vs. control and METH; # p ≤ 0.05 vs. METH. ASN = asparagine; RAP = rapamycin.CC BY · PubMed Central

Verification

Claims the paper makes

The claims and statistics of this paper haven’t been checked yet.

Run the check — free, no account needed. It reads the open-access text and checks the sources it cites.

A few free checks a day · papers already verified open instantly · results are public

Claims other papers make about this one

Each is checked against this paper’s own text: does it say what the citing paper says it does?

Self-check

Percentages, sums and reported differences re-computed from the paper’s own numbers.

The self-check needs the paper’s full text.

Citations

Cites

Research works printed but not linked: 102

  1. 10.1176/appi.ajp.158.3.377 · DOI
  2. 10.1016/j.ncl.2011.05.004 · DOI
  3. 10.1016/0006-8993(80)91265-2 · DOI
  4. 10.1016/0006-8993(82)90198-6 · DOI
  5. 10.1038/nm0696-699 · DOI
  6. 10.1046/j.1471-4159.2003.02137.x · DOI
  7. 10.1002/syn.20307 · DOI
  8. 10.1038/npp.2013.307 · DOI
  9. 10.1016/j.nbd.2011.11.005 · DOI
  10. 10.1007/s12640-009-9106-1 · DOI
  11. 10.1007/s12640-013-9438-8 · DOI
  12. 10.1007/s12640-018-9925-z · DOI
  13. 10.1196/annals.1316.021 · DOI
  14. 10.1196/annals.1369.007 · DOI
  15. 10.1111/j.1471-4159.2006.04429.x · DOI
  16. 10.1016/j.neuroscience.2012.03.004 · DOI
  17. 10.1016/j.legalmed.2004.11.002 · DOI
  18. Sonsalla P. K., 1986, Roles of D1 and D2 dopamine receptor subtypes in mediating the methamphetamine-induced changes in monoamine systems, Journal of Pharmacology and Experimental Therapeutics, 238, 932, 10.1016/S0022-3565(25)24344-0 · DOI
  19. Gibb J. W., 1990, Neurochemical basis of neurotoxicity, Neurotoxicology, 11, 317
  20. 10.1016/0896-6273(90)90339-H · DOI · Paper page
  21. 10.1111/j.1749-6632.1992.tb26020.x · DOI
  22. 10.1523/JNEUROSCI.14-04-02260.1994 · DOI
  23. 10.1016/0006-2952(80)90493-1 · DOI
  24. 10.1046/j.1471-4159.1999.0732434.x · DOI
  25. 10.1016/0014-2999(85)90541-2 · DOI
  26. 10.1016/j.pneurobio.2015.09.011 · DOI
  27. 10.1111/j.1749-6632.1994.tb21827.x · DOI
  28. 10.1046/j.1471-4159.2002.00808.x · DOI
  29. 10.1002/glia.21229 · DOI
  30. 10.1093/ijnp/pyw021 · DOI
  31. 10.1523/JNEUROSCI.19-04-01484.1999 · DOI
  32. 10.4161/auto.5923 · DOI · Paper page
  33. 10.12871/000398292017129 · DOI
  34. 10.1111/j.1471-4159.2010.07147.x · DOI
  35. 10.1111/j.1471-4159.2005.03379.x · DOI
  36. 10.1007/s00204-015-1478-9 · DOI
  37. 10.1111/j.1471-4159.2008.05488.x · DOI · Paper page
  38. 10.1371/journal.pone.0028946 · DOI
  39. 10.4449/aib.v150i2/3.1417 · DOI
  40. Yamamoto B. K., 1998, The effects of methamphetamine on the production of free radicals and oxidative stress, The Journal of Pharmacology and Experimental Therapy, 287, 107, 10.1016/S0022-3565(24)37769-9 · DOI
  41. 10.1124/jpet.106.109173 · DOI
  42. 10.1523/JNEUROSCI.23-26-08955.2003 · DOI
  43. 10.1196/annals.1369.017 · DOI
  44. 10.1523/jneurosci.22-20-08951.2002 · DOI
  45. 10.1111/j.1471-4159.2007.05145.x · DOI
  46. 10.1016/j.toxlet.2018.03.015 · DOI
  47. 10.3389/fnana.2016.00078 · DOI
  48. 10.1016/j.brainres.2006.10.071 · DOI
  49. 10.1002/syn.20365 · DOI
  50. 10.1038/cddis.2014.503 · DOI
  51. 10.1016/j.biocel.2014.10.013 · DOI
  52. 10.1038/cddis.2014.46 · DOI
  53. 10.4161/auto.23568 · DOI
  54. 10.1126/science.290.5497.1717 · DOI
  55. 10.1038/nature03029 · DOI · Paper page
  56. 10.1016/S1534-5807(03)00296-X · DOI
  57. 10.1038/msb.2013.35 · DOI
  58. 10.1042/bj3050245 · DOI
  59. 10.1007/s13105-010-0037-3 · DOI
  60. 10.1074/jbc.M004345200 · DOI
  61. 10.1016/S0092-8674(02)01012-7 · DOI
  62. 10.1523/JNEUROSCI.08-08-02804.1988 · DOI
  63. 10.1523/JNEUROSCI.20-16-06048.2000 · DOI
  64. 10.1523/JNEUROSCI.20-16-06021.2000 · DOI
  65. 10.1186/s13195-018-0352-4 · DOI
  66. 10.1111/bph.14137 · DOI
  67. 10.18632/oncotarget.23877 · DOI
  68. 10.1038/s41419-017-0229-7 · DOI
  69. 10.1080/15548627.2017.1375633 · DOI
  70. 10.1016/S0014-5793(97)00323-2 · DOI
  71. 10.1016/S0960-9822(98)70037-5 · DOI
  72. 10.1074/jbc.273.36.23534 · DOI
  73. 10.1101/gad.995802 · DOI · Paper page
  74. 10.1074/jbc.M201745200 · DOI
  75. 10.1177/31.1.6187796 · DOI
  76. 10.1016/j.micron.2003.10.001 · DOI
  77. 10.1369/jhc.3A6178.2004 · DOI
  78. 10.1038/cddis.2014.64 · DOI
  79. 10.1523/JNEUROSCI.3712-09.2010 · DOI
  80. 10.1038/s41467-017-02494-0 · DOI
  81. 10.1016/j.neuroscience.2016.02.072 · DOI · Paper page
  82. 10.1016/j.nbd.2015.02.024 · DOI
  83. 10.1111/jnc.13586 · DOI
  84. 10.18632/oncotarget.13805 · DOI
  85. 10.4161/auto.19085 · DOI
  86. 10.1007/s12035-012-8341-2 · DOI
  87. 10.1016/j.parkreldis.2008.04.025 · DOI
  88. 10.1038/aps.2013.29 · DOI
  89. 10.1016/j.toxlet.2012.09.019 · DOI
  90. 10.1016/j.bbrc.2015.08.005 · DOI
  91. 10.1111/j.1600-079X.2008.00648.x · DOI
  92. 10.1016/j.pnpbp.2018.03.017 · DOI
  93. 10.1111/j.1471-4159.2008.05284.x · DOI
  94. 10.3390/ijms19051540 · DOI
  95. 10.1007/s12640-014-9513-9 · DOI
  96. 10.1038/cddis.2016.317 · DOI
  97. 10.1016/j.toxlet.2018.05.017 · DOI
  98. 10.1016/j.cell.2005.09.028 · DOI
  99. 10.1016/j.bbrc.2005.04.124 · DOI
  100. 10.1016/S0306-4522(03)00036-8 · DOI
  101. 10.1073/pnas.1605844113 · DOI
  102. 10.1074/jbc.M116.714923 · DOI

Cited by

Sorted by citations

See all 53

Metadata

Authors
Lazzeri, G., Biagioni, F., Fulceri, F., Busceti, C. L., Scavuzzo, M. C., Ippolito, C., Salvetti, A., Lenzi, P., & Fornai, F.
Venue
Oxidative Medicine and Cellular Longevity
Publisher
Wiley
Published
2018-01
Volume
2018
Issue
1
ISSN
  • 1942-0900
  • 1942-0994
Cited by
53
References
5
Language
en
Funders
Ministero della Salute

About these checks

Registry, retraction, Cites and statistics results are computed, not judged, with one exception: a printed reference that no index lists is read once by a model before it counts as a citation error. Claims are extracted by a model and kept only when their quote appears verbatim in the text; each cited source is then checked, with a model’s help, for whether it says what the claim relies on. Those verdicts can be wrong — read the claim’s quote and the cited source before relying on one.

Statistics and arithmetic are recomputed, not judged.

Confidence bands are shown only for fields calibrated on our annotated test set. None is calibrated yet, so no band is shown.

What counts as a claim ›How we measure confidence ›How we check this ›

Are you an author, or do you see a problem with this page? Request a review