

The DOI matches its Crossref record; 33 of the 33 references it cites were found in a registry or an index.
Neoadjuvant Selicrelumab, an Agonist CD40 Antibody, Induces Changes in the Tumor Microenvironment in Patients with Resectable Pancreatic Cancer
Open accessPublished version of a preprint
Abstract
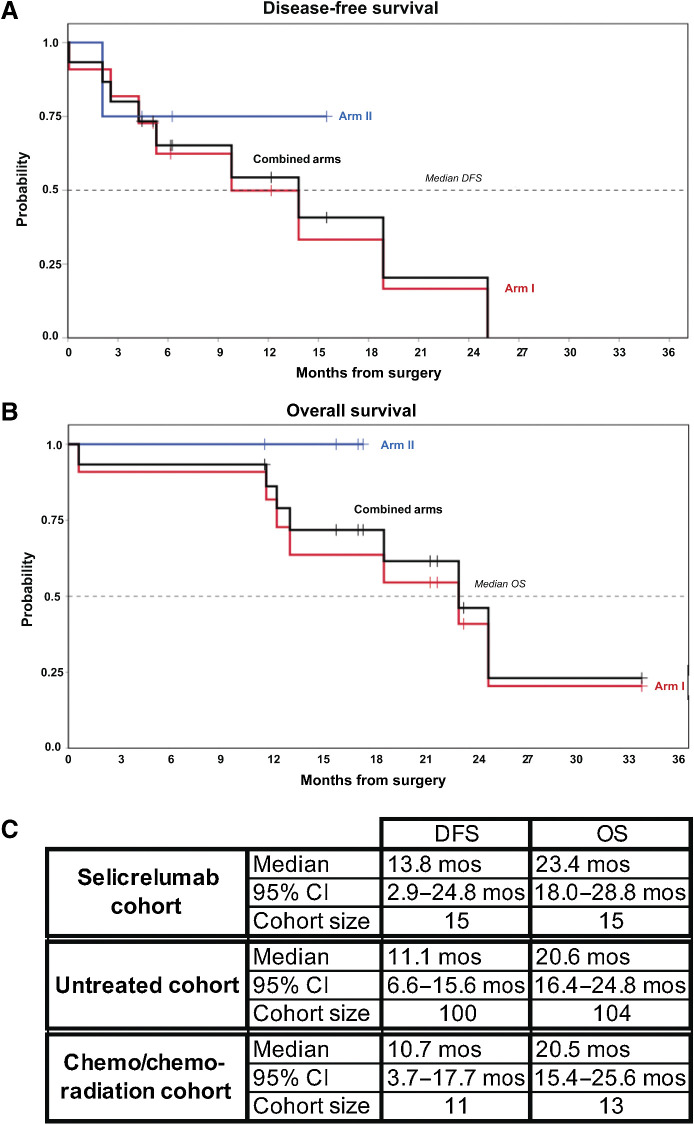
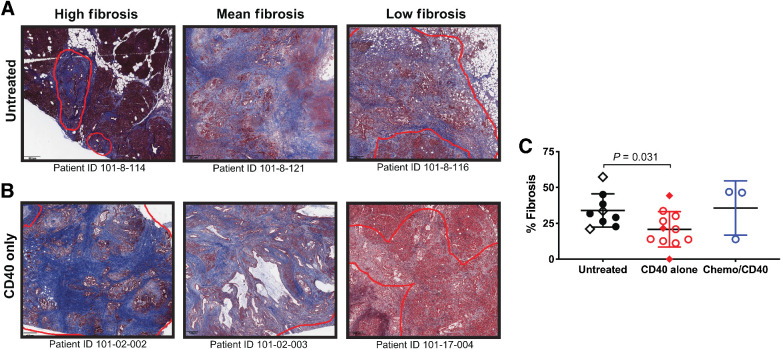
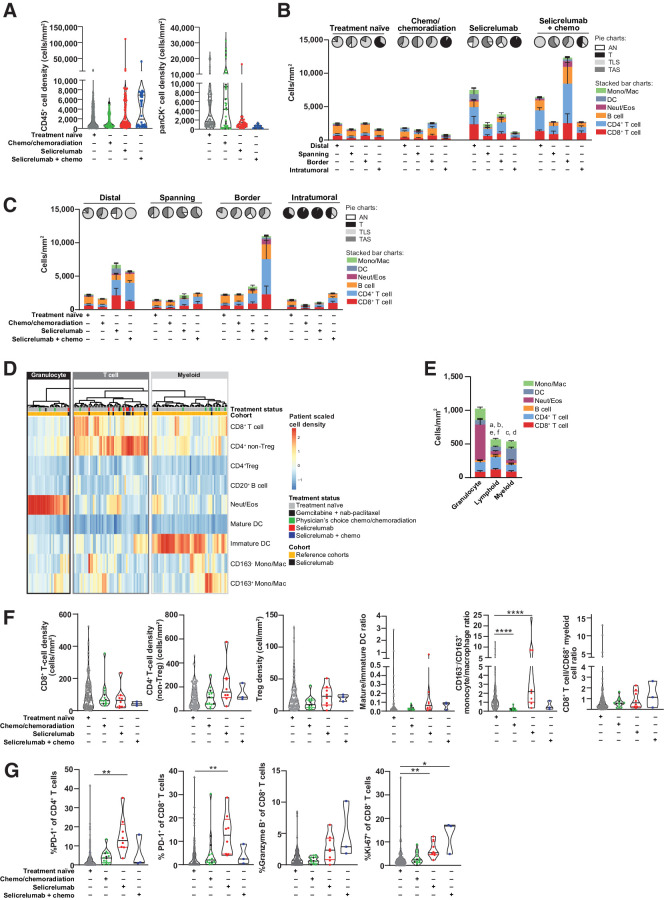
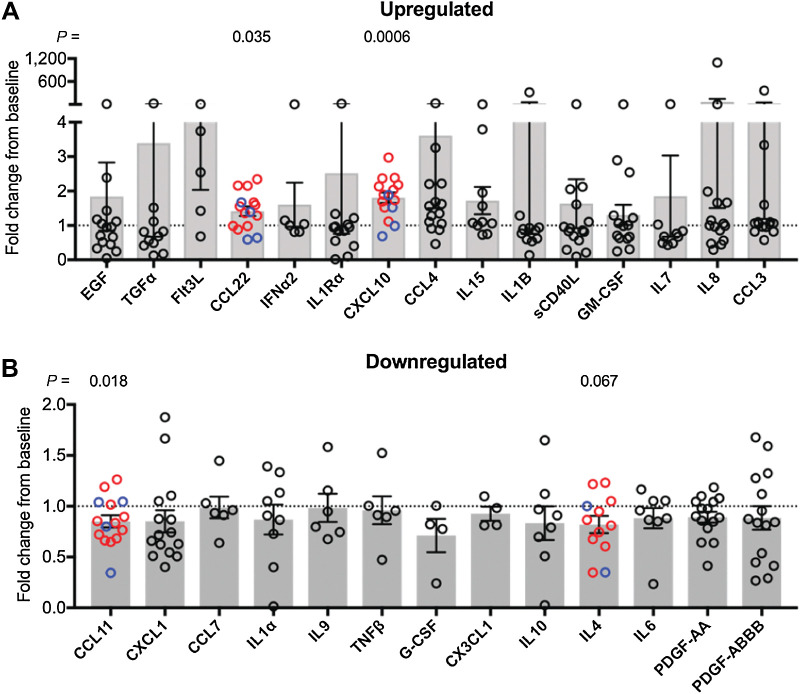
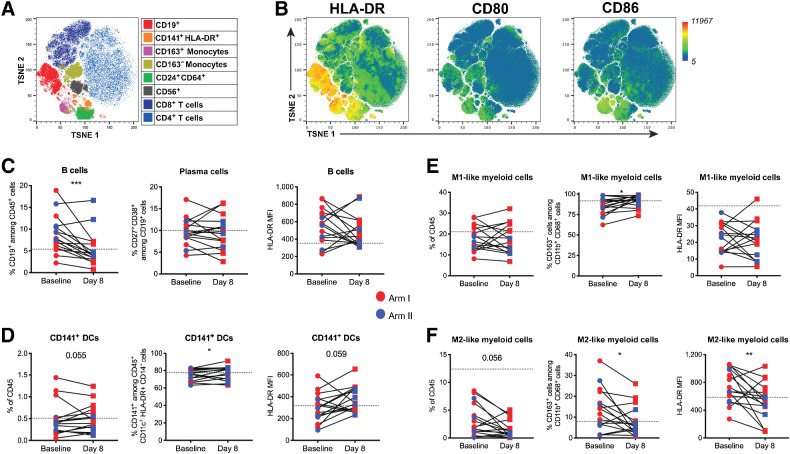
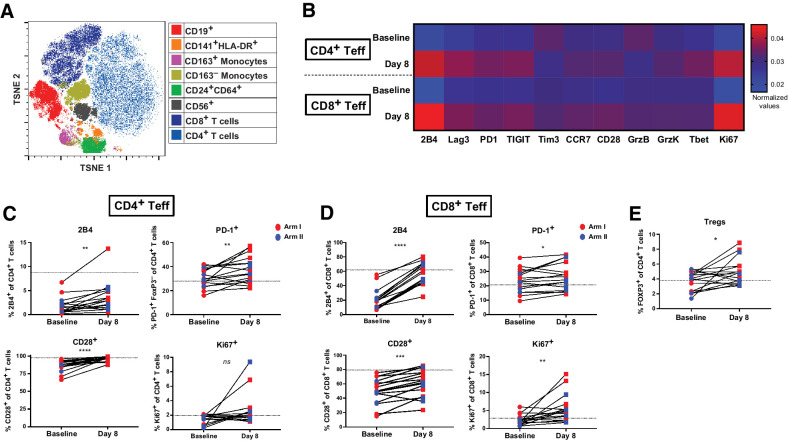
Purpose: CD40 activation is a novel clinical opportunity for cancer immunotherapy. Despite numerous active clinical trials with agonistic CD40 monoclonal antibodies (mAb), biological effects and treatment-related modulation of the tumor microenvironment (TME) remain poorly understood. Patients and Methods: Here, we performed a neoadjuvant clinical trial of agonistic CD40 mAb (selicrelumab) administered intravenously with or without chemotherapy to 16 patients with resectable pancreatic ductal adenocarcinoma (PDAC) before surgery followed by adjuvant chemotherapy and CD40 mAb. Results: The toxicity profile was acceptable, and overall survival was 23.4 months (95% confidence interval, 18.0–28.8 months). Based on a novel multiplexed immunohistochemistry platform, we report evidence that neoadjuvant selicrelumab leads to major differences in the TME compared with resection specimens from treatment-naïve PDAC patients or patients given neoadjuvant chemotherapy/chemoradiotherapy only. For selicrelumab-treated tumors, 82% were T-cell enriched, compared with 37% of untreated tumors (P = 0.004) and 23% of chemotherapy/chemoradiation-treated tumors (P = 0.012). T cells in both the TME and circulation were more active and proliferative after selicrelumab. Tumor fibrosis was reduced, M2-like tumor-associated macrophages were fewer, and intratumoral dendritic cells were more mature. Inflammatory cytokines/sec CXCL10 and CCL22 increased systemically after selicrelumab. Conclusions: This unparalleled examination of CD40 mAb therapeutic mechanisms in patients provides insights for design of subsequent clinical trials targeting CD40 in cancer.
Overview
The claims and statistics of this paper haven’t been checked yet.
Run the check — free, no account needed. It reads the open-access text and checks the sources it cites.
Integrity signals
Registry
Cites
Statistics
Figures
Verification
Claims the paper makes
The claims and statistics of this paper haven’t been checked yet.
Run the check — free, no account needed. It reads the open-access text and checks the sources it cites.
Claims other papers make about this one
Each is checked against this paper’s own text: does it say what the citing paper says it does?
In the citing paper
“In fact, partly driven by the challenging trajectory of “conventional” drug development in PDAC, there has been an evolving shift from large, empirical trials towards those that are focused on fewer patient numbers, but which feature in-depth correlative studies that provide insights into mechanisms of response and resistance184,292,293.”
From Pancreatic cancer: Advances and challenges (2023) · cites this paper as [184]
Self-check
Percentages, sums and reported differences re-computed from the paper’s own numbers.
The self-check needs the paper’s full text.
Citations
Cites
QuPath: Open source software for digital pathology image analysis
Bankhead, P., Loughrey, M. B., Fernández, J. A., Dombrowski, Y., McArt, D. G., Dunne, P. D., McQuaid, S., Gray, R. T., Murray, L. J., Coleman, H. G., et al. (2017) · Scientific Reports · doi:10.1038/s41598-017-17204-5 · Cited by 8,908
Elyada, E., Bolisetty, M., Laise, P., Flynn, W. F., Courtois, E. T., Burkhart, R. A., Teinor, J. A., Belleau, P., Biffi, G., Lucito, M. S., et al. (2019) · Cancer Discovery · doi:10.1158/2159-8290.cd-19-0094 · Cited by 2,241
Self-citationCD40 Agonists Alter Tumor Stroma and Show Efficacy Against Pancreatic Carcinoma in Mice and Humans
Beatty, G. L., Chiorean, E. G., Fishman, M. P., Saboury, B., Teitelbaum, U. R., Sun, W., Huhn, R. D., Song, W., Li, D., Sharp, L. L., et al. (2011) · Science · doi:10.1126/science.1198443 · Cited by 1,706
Self-citationLi, J., Byrne, K. T., Yan, F., Yamazoe, T., Chen, Z., Baslan, T., Richman, L. P., Lin, J., Sun, Y. H., Rech, A. J., et al. (2018) · Immunity · doi:10.1016/j.immuni.2018.06.006 · Cited by 746
Self-citationMacrophage Polarisation: an Immunohistochemical Approach for Identifying M1 and M2 Macrophages
Barros, M. H. M., Hauck, F., Dreyer, J. H., Kempkes, B., & Niedobitek, G. (2013) · PLoS ONE · doi:10.1371/journal.pone.0080908 · Cited by 616
The Role of Type 1 Conventional Dendritic Cells in Cancer Immunity
Böttcher, J. P., & Reis e Sousa, C. (2018) · Trends in Cancer · doi:10.1016/j.trecan.2018.09.001 · Cited by 607
Tsujikawa, T., Kumar, S., Borkar, R. N., Azimi, V., Thibault, G., Chang, Y. H., Balter, A. I., Kawashima, R., Choe, G. H., Sauer, D., et al. (2017) · Cell Reports · doi:10.1016/j.celrep.2017.03.037 · Cited by 560
Self-citationMultimodal mapping of the tumor and peripheral blood immune landscape in human pancreatic cancer
Steele, N. G., Carpenter, E. S., Kemp, S. B., Sirihorachai, V. R., The, S., Delrosario, L., Lazarus, J., Amir, E.-A. D., Gunchick, V., Espinoza, C. E., et al. (2020) · Nature Cancer · doi:10.1038/s43018-020-00121-4 · Cited by 556
CD40 agonist antibodies in cancer immunotherapy
Vonderheide, R. H. (2020) · Annual Review of Medicine · doi:10.1146/annurev-med-062518-045435 · Cited by 544
Self-citationVonderheide, R. H., Flaherty, K. T., Khalil, M., Stumacher, M., Bajor, D. L., Hutnick, N. A., Sullivan, P., Mahany, J. J., Gallagher, M., Kramer, A., et al. (2007) · Journal of Clinical Oncology · doi:10.1200/jco.2006.08.3311 · Cited by 513
Self-citation
Cited by
Sorted by citations
Pancreatic cancer: Advances and challenges
Halbrook, C. J., Lyssiotis, C. A., Pasca di Magliano, M., & Maitra, A. (2023) · Cell · doi:10.1016/j.cell.2023.02.014 · Cited by 1,321
Pancreatic Cancer: Pathogenesis, Screening, Diagnosis, and Treatment
Wood, L. D., Canto, M. I., Jaffee, E. M., & Simeone, D. M. (2022) · Gastroenterology · doi:10.1053/j.gastro.2022.03.056 · Cited by 918
Self-citationDendritic cell subsets in cancer immunity and tumor antigen sensing
Prete, A. D., Salvi, V., Soriani, A., Laffranchi, M., Sozio, F., Bosisio, D., & Sozzani, S. (2023) · Cellular and Molecular Immunology · doi:10.1038/s41423-023-00990-6 · Cited by 682
Padrón, L. J., Maurer, D. M., O’Hara, M. H., O’Reilly, E. M., Wolff, R. A., Wainberg, Z. A., Ko, A. H., Fisher, G., Rahma, O., Lyman, J. P., et al. (2022) · Nature Medicine · doi:10.1038/s41591-022-01829-9 · Cited by 384
Self-citationImmunotherapy combination approaches: mechanisms, biomarkers and clinical observations
Butterfield, L. H., & Najjar, Y. G. (2023) · Nature reviews. Immunology · doi:10.1038/s41577-023-00973-8 · Cited by 372
Dendritic cells as shepherds of T cell immunity in cancer
Pittet, M. J., Pilato, M. D., Garris, C., & Mempel, T. R. (2023) · Immunity · doi:10.1016/j.immuni.2023.08.014 · Cited by 337
Immunologic Strategies in Pancreatic Cancer: Making Cold Tumors Hot
Ullman, N. A., Burchard, P. R., Dunne, R. F., & Linehan, D. C. (2022) · Journal of Clinical Oncology · doi:10.1200/jco.21.02616 · Cited by 311
Cancer therapy with antibodies
Paul, S., Konig, M. F., Pardoll, D. M., Bettegowda, C., Papadopoulos, N., Wright, K. M., Gabelli, S. B., Ho, M., van Elsas, A., & Zhou, S. (2024) · Nature reviews. Cancer · doi:10.1038/s41568-024-00690-x · Cited by 292
Current and future immunotherapeutic approaches in pancreatic cancer treatment
Farhangnia, P., Khorramdelazad, H., Nickho, H., & Delbandi, A. (2024) · Journal of Hematology & Oncology · doi:10.1186/s13045-024-01561-6 · Cited by 265
Liudahl, S. M., Betts, C. B., Sivagnanam, S., Morales-Oyarvide, V., da Silva, A., Yuan, C., Hwang, S., Grossblatt-Wait, A., Leis, K. R., Larson, W., et al. (2021) · Cancer Discovery · doi:10.1158/2159-8290.cd-20-0841 · Cited by 164
Self-citationLu, C., Liu, Y., Ali, N. M., Zhang, B., & Cui, X. (2023) · Frontiers in Immunology · doi:10.3389/fimmu.2022.1039260 · Cited by 157
Immune Checkpoint Therapies and Atherosclerosis: Mechanisms and Clinical Implications
Vuong, J. T., Stein-Merlob, A. F., Nayeri, A., Sallam, T., Neilan, T. G., & Yang, E. H. (2022) · Journal of the American College of Cardiology · doi:10.1016/j.jacc.2021.11.048 · Cited by 116
Tumor-associated macrophages in multiple myeloma: advances in biology and therapy
Sun, J., Park, C., Guenthner, N., Gurley, S., Zhang, L., Lubben, B., Adebayo, O., Bash, H. D., Chen, Y., Maksimos, M., et al. (2022) · Journal for ImmunoTherapy of Cancer · doi:10.1136/jitc-2021-003975 · Cited by 102
Atherosclerosis With Immune Checkpoint Inhibitor Therapy
Suero‐Abreu, G. A., Zanni, M. V., & Neilan, T. G. (2022) · JACC CardioOncology · doi:10.1016/j.jaccao.2022.11.011 · Cited by 104
Heumann, T. R., Judkins, C., Li, K., Lim, S. J., Hoare, J., Parkinson, R. M., Cao, H., Zhang, T., Gai, J., Celiker, B., et al. (2023) · Nature Communications · doi:10.1038/s41467-023-39196-9 · Cited by 104
Self-citationConsensus, debate, and prospective on pancreatic cancer treatments
Wang, J., Yang, J., Narang, A. K., He, J., Wolfgang, C. L., Li, K., & Zheng, L. (2024) · Journal of Hematology & Oncology · doi:10.1186/s13045-024-01613-x · Cited by 104
Targeting lipid metabolism of macrophages: A new strategy for tumor therapy
Shao, N., Qiu, H., Liu, J., Xiao, D., Zhao, J., Chen, C., Wan, J., Guo, M., Liang, G., Zhao, X., et al. (2024) · Journal of Advanced Research · doi:10.1016/j.jare.2024.02.009 · Cited by 94
Targeting the TNF and TNFR superfamilies in autoimmune disease and cancer
Croft, M., Salek‐Ardakani, S., & Ware, C. F. (2024) · Nature Reviews Drug Discovery · doi:10.1038/s41573-024-01053-9 · Cited by 102
Gautam, S. K., Batra, S. K., & Jain, M. (2023) · Molecular Cancer · doi:10.1186/s12943-023-01813-y · Cited by 93
Macrophages and fibroblasts as regulators of the immune response in pancreatic cancer
Shakiba, M., & Tuveson, D. A. (2025) · Nature Immunology · doi:10.1038/s41590-025-02134-6 · Cited by 81
Luo, W., Wen, T., & Qu, X. (2024) · Journal of Experimental & Clinical Cancer Research · doi:10.1186/s13046-023-02935-3 · Cited by 73
Innate immune cells in tumor microenvironment: A new frontier in cancer immunotherapy
Li, C., Yu, X., Han, X., Chen, L., Wang, Z., Shao, S., Shao, F., Wang, H., Ma, S., & Liu, J. (2024) · iScience · doi:10.1016/j.isci.2024.110750 · Cited by 62
Harnessing the potential of CD40 agonism in cancer therapy
Zhou, Y., Richmond, A. J., & Yan, C. W. (2023) · Cytokine & Growth Factor Reviews · doi:10.1016/j.cytogfr.2023.11.002 · Cited by 55
Strategies to overcome DC dysregulation in the tumor microenvironment
Mestrallet, G., Sone, K., & Bhardwaj, N. (2022) · Frontiers in Immunology · doi:10.3389/fimmu.2022.980709 · Cited by 56
Clinical immunotherapy in pancreatic cancer
Ye, X., Yu, Y., Zheng, X., & Ma, H. (2024) · Cancer Immunology Immunotherapy · doi:10.1007/s00262-024-03632-6 · Cited by 54
Charting roadmaps towards novel and safe synergistic immunotherapy combinations
Sanmamed, M. F., Berraondo, P., Rodriguez-Ruiz, M. E., & Melero, I. (2022) · Nature Cancer · doi:10.1038/s43018-022-00401-1 · Cited by 50
Immunocytes in the tumor microenvironment: recent updates and interconnections
Yu, J., Fu, L., Wu, R., Che, L., Liu, G., Ran, Q., Xia, Z., Liang, X., & Zhao, G. (2025) · Frontiers in Immunology · doi:10.3389/fimmu.2025.1517959 · Cited by 52
Group Young Researchers in Inflammatory Carcinogenesis, Wandmacher, A. M., Mehdorn, A., & Sebens, S. (2021) · Cancers · doi:10.3390/cancers13194932 · Cited by 48
Narayanan, J. S. S., Hayashi, T., Erdem, S., McArdle, S., Tiriac, H., Ray, P., Pu, M., Mikulski, Z., Miller, A. M., Messer, K. S., et al. (2023) · Journal for ImmunoTherapy of Cancer · doi:10.1136/jitc-2022-006133 · Cited by 45
Breaking the stromal barrier in pancreatic cancer: Advances and challenges
Chakkera, M., Foote, J. B., Farran, B., & Nagaraju, G. P. (2023) · Biochimica et Biophysica Acta (BBA) - Reviews on Cancer · doi:10.1016/j.bbcan.2023.189065 · Cited by 48
Liu, H., Gonzalez, D. D., Viswanath, D. I., Pol, R. V., Saunders, S. Z., Trani, N. D., Xu, Y., Zheng, J., Chen, S., Chua, C. Y. X., et al. (2023) · Advanced Science · doi:10.1002/advs.202206873 · Cited by 42
Croft, W. D., Pearce, H., Margielewska‐Davies, S., Lim, L., Nicol, S. M., Zayou, F., Blakeway, D., Marcon, F., Powell-Brett, S. F., Mahon, B. S., et al. (2023) · eLife · doi:10.7554/elife.86125 · Cited by 44
Facts and Hopes of CD40 Agonists in Cancer Immunotherapy
McVey, J. C., & Beatty, G. L. (2025) · Clinical Cancer Research · doi:10.1158/1078-0432.ccr-24-1660 · Cited by 45
Clinical Strategies Targeting the Tumor Microenvironment of Pancreatic Ductal Adenocarcinoma
Skorupan, N., Domínguez, M. P., Ricci, S. L., & Alewine, C. (2022) · Cancers · doi:10.3390/cancers14174209 · Cited by 35
Innate immune cells: Key players of orchestra in modulating tumor microenvironment (TME)
Sadeghi, M., Dehnavi, S., Sharifat, M., Amiri, A. M., & Khodadadi, A. (2024) · Heliyon · doi:10.1016/j.heliyon.2024.e27480 · Cited by 35
Neoadjuvant therapy alters the immune microenvironment in pancreatic cancer
Zhang, H., Ye, L., Yu, X., Jin, K., & Wu, W. (2022) · Frontiers in Immunology · doi:10.3389/fimmu.2022.956984 · Cited by 34
Multiplexed Imaging Mass Cytometry Analysis Characterizes the Vascular Niche in Pancreatic Cancer
Sussman, J., Kim, N., Kemp, S. B., Traum, D., Katsuda, T., Kahn, B., Xu, J., Kim, I., Eskandarian, C., Delman, D., et al. (2024) · Cancer Research · doi:10.1158/0008-5472.can-23-2352 · Cited by 32
Blise, K. E., Sivagnanam, S., Betts, C. B., Betre, K., Kirchberger, N. C., Tate, B. J., Furth, E. E., Costa, A. D., Nowak, J. A., Wolpin, B. M., et al. (2024) · Cancer Immunology Research · doi:10.1158/2326-6066.cir-23-0873 · Cited by 31
Self-citationNext-generation CD40 agonists for cancer immunotherapy
Andersson, H., Nyesiga, B., Hermodsson, T., Smith, K. E., Hägerbrand, K., Lindstedt, M., & Ellmark, P. (2024) · Expert Opinion on Biological Therapy · doi:10.1080/14712598.2024.2357714 · Cited by 30
Liu, R., Li, J., Liu, L., Wang, W., & Jia, J. (2024) · Cancer Pathogenesis and Therapy · doi:10.1016/j.cpt.2024.07.004 · Cited by 33
A potential novel cancer immunotherapy: Agonistic anti-CD40 antibodies
Jian, C.-Z., Li, L., Hsu, C., Chen, Y.-H., Hsu, C., Tan, C., & Ou, D. (2024) · Drug Discovery Today · doi:10.1016/j.drudis.2024.103893 · Cited by 28
Li, Q., He, J., Li, S., Tian, C., Yang, J., Yuan, H., Lu, Y. H., Fagone, P., Nicoletti, F., & Xiang, M. (2022) · Clinical Immunology · doi:10.1016/j.clim.2022.109217 · Cited by 28
Advances in Immunotherapeutics in Pancreatic Ductal Adenocarcinoma
Chouari, T. A. M., Costa, F. L., Merali, N., Jessel, M.-D., Sivakumar, S., Annels, N. E., & Frampton, A. E. (2023) · Cancers · doi:10.3390/cancers15174265 · Cited by 34
Olaoba, O. T., Yang, M. J., Adelusi, T. I., Maidens, T., Kimchi, E. T., Staveley-O’Carroll, K. F., & Li, G. (2024) · Cancers · doi:10.3390/cancers16081470 · Cited by 28
Hou, W., Yang, B., & Zhu, H. (2022) · Pharmaceutics · doi:10.3390/pharmaceutics14102033 · Cited by 26
Dendritic Cells: The Long and Evolving Road towards Successful Targetability in Cancer
Marmonti, E., Oliva, J., & Haymaker, C. (2022) · Cells · doi:10.3390/cells11193028 · Cited by 29
Wang, Z., Zhong, H., Liang, X., & Ni, S. (2022) · Frontiers in Immunology · doi:10.3389/fimmu.2022.1024921 · Cited by 28
The Immune Landscape of Pheochromocytoma and Paraganglioma: Current Advances and Perspectives
Uher, O., Vanova, K. H., Taïeb, D., Calsina, B., Robledo, M., Clifton-Bligh, R. J., & Pacák, K. (2024) · Endocrine Reviews · doi:10.1210/endrev/bnae005 · Cited by 31
Frankish, J., Mukherjee, D., Romano, E., Frey, K., Schröder, M., Heinonen, K., Merz, C., Müller, M. R., Gieffers, C., Hill, O., et al. (2023) · Frontiers in Immunology · doi:10.3389/fimmu.2023.1160116 · Cited by 25
Oncolytic adenovirus as pancreatic cancer-targeted therapy: Where do we go from here?
Yoon, A. R., Hong, J., Jung, B., Ahn, H. M., Zhang, S., & Yun, C. (2023) · Cancer Letters · doi:10.1016/j.canlet.2023.216456 · Cited by 25
Cai, R., Zhu, H., Liu, Y. L., Sha, H., Peng, W., Yin, R. L., Zhou, G., & Fang, Y. (2023) · Journal of Cancer Research and Clinical Oncology · doi:10.1007/s00432-023-04919-4 · Cited by 28
Karamitopoulou, E., Wenning, A. S., Acharjee, A., Aeschbacher, P., Marinoni, I., Zlobec, I., Gloor, B., & Perren, A. A. (2024) · Clinical Cancer Research · doi:10.1158/1078-0432.ccr-24-0368 · Cited by 23
Precision Targeting Strategies in Pancreatic Cancer: The Role of Tumor Microenvironment
Vitorakis, N., Gargalionis, A. N., Papavassiliou, K. A., Adamopoulos, C., & Papavassiliou, A. G. (2024) · Cancers · doi:10.3390/cancers16162876 · Cited by 25
Neoadjuvant Immunotherapy for Localized Pancreatic Cancer: Challenges and Early Results
Chick, R. C., Gunderson, A. J., Rahman, S., & Cloyd, J. M. (2023) · Cancers · doi:10.3390/cancers15153967 · Cited by 22
Li, J., Wei, T., Ma, K., Zhang, J., Lü, J., Zhao, J., Huang, J., Zeng, T., Xie, Y., Liang, Y., et al. (2024) · Cancer Letters · doi:10.1016/j.canlet.2024.216607 · Cited by 24
Macrophage heterogeneity and its interactions with stromal cells in tumour microenvironment
Cao, L., Meng, X., Zhang, Z., Liu, Z., & He, Y. (2024) · Cell & Bioscience · doi:10.1186/s13578-024-01201-z · Cited by 28
The cross-talk between macrophages and tumor cells as a target for cancer treatment
Aizaz, M., Khan, A. U., Khan, F., Khan, M., Saleh, E. A. M., Nisar, M., & Baran, N. (2023) · Frontiers in Oncology · doi:10.3389/fonc.2023.1259034 · Cited by 24
Challenges and Opportunities in Targeting the Complex Pancreatic Tumor Microenvironment
Finan, J. M., Guo, Y., Goodyear, S. M., & Brody, J. R. (2024) · JCO oncology advances. · doi:10.1200/oa-24-00050 · Cited by 21
Lu, C., Liu, Y., Miao, L., Kong, X., Li, H., Chen, H., Zhao, X., Zhang, B., & Cui, X. (2023) · International Journal of Oncology · doi:10.3892/ijo.2023.5599 · Cited by 19
Kuznetsova, A. B., Kolesova, E. P., Parodi, A., Zamyatnin, A. A., & Egorova, V. S. (2024) · Pharmaceutics · doi:10.3390/pharmaceutics16050636 · Cited by 19
Dendritic cell immunotherapy advances for solid tumors: Vaccination and modulation
Clayton, G., Toffoli, E. C., de Gruijl, T. D., & van Kooyk, Y. (2025) · Cell Reports Medicine · doi:10.1016/j.xcrm.2025.102412 · Cited by 21
Silva, A. J. D., de Moura, I. A., da Gama, M. A. T. M., Leal, L. R. S., de Pinho, S. S., Espinoza, B. C. F., dos Santos, D. L., Santos, V. E. P., de Sena, M. G. A. M., Invenção, M. D. C. V., et al. (2023) · Vaccines · doi:10.3390/vaccines11081354 · Cited by 21
Advances in immunotherapy and targeted therapy for pancreatic cancer
Zhou, X., Wang, X., Yang, S., & Huang, Z. (2024) · Oncology and Translational Medicine · doi:10.1097/ot9.0000000000000074 · Cited by 19
Toulmonde, M., Guégan, J., Ceruso, M. S., Valentin, T., Bahleda, R., Peyraud, F., Rey, C., Kind, M., Cantarel, C., Bellera, C. A., et al. (2025) · Signal Transduction and Targeted Therapy · doi:10.1038/s41392-025-02278-9 · Cited by 19
Lin, H.-J. L., Liu, Y., Caroland, K. P., & Lin, J. (2023) · Cancers · doi:10.3390/cancers15133507 · Cited by 20
Combination immunotherapy for pancreatic cancer: challenges and future considerations
Gössling, G. C. D. L., Zhen, D. B., Pillarisetty, V. G., & Chiorean, E. G. (2022) · Expert Review of Clinical Immunology · doi:10.1080/1744666x.2022.2120471 · Cited by 18
Self-citationRole of M2 macrophage-derived exosomes in cancer drug resistance via noncoding RNAs
Hu, X., Li, Y., Wang, X., & Xue, X. (2025) · Discover Oncology · doi:10.1007/s12672-025-02195-x · Cited by 17
Updates in Immunotherapy for Pancreatic Cancer
Chick, R. C., & Pawlik, T. M. (2024) · Journal of Clinical Medicine · doi:10.3390/jcm13216419 · Cited by 17
Norgard, R. J., Budhani, P., O’Brien, S. A., Xia, Y., Egan, J. N., Flynn, B., Tagore, J. R., Seco, J., Peet, G. W., Mikucka, A., et al. (2024) · Cancer Research Communications · doi:10.1158/2767-9764.crc-24-0172 · Cited by 16
Agostini, A., Orlacchio, A., Carbone, C., & Guerriero, I. (2022) · Frontiers in Immunology · doi:10.3389/fimmu.2022.876291 · Cited by 14
A Paradigm Shifts: Neoadjuvant Therapy for Clearly Resectable Pancreatic Cancer
de Geus, S. W. L., & Sachs, T. E. (2023) · Annals of Surgical Oncology · doi:10.1245/s10434-023-13281-1 · Cited by 15
Zhou, P., Zhang, W., Liao, Y., Zhai, Z., Lu, S., Jiang, S., Hu, W., & Gong, W. (2025) · International Journal of Surgery · doi:10.1097/js9.0000000000002573 · Cited by 17
Next‐Generation Immune Checkpoints and Tumor Microenvironment Modulation in Cancer Immunotherapy
Bautista, J., Echeverría, C. E., Maldonado-Noboa, I., Adatty-Molina, J., Urresta, S. S., Coral-Riofrio, E. C., Araujo‐Abad, S., Kyriakidis, N. C., & López-Cortés, A. (2026) · Journal of Immunology Research · doi:10.1155/jimr/7864229 · Cited by 16
The Next Frontier in Pancreatic Cancer: Targeting the Tumor Immune Milieu and Molecular Pathways
Yin, C., Alqahtani, A. J., & Noel, M. S. (2022) · Cancers · doi:10.3390/cancers14112619 · Cited by 14
Wang, Y., Yue, B., Ni, H., Chen, J., Shi, R., Wang, Z., Dai, X., & Sheng, M. (2026) · Translational Oncology · doi:10.1016/j.tranon.2026.102682 · Cited by 13
Iron-Dependent Cell Death: A New Treatment Approach against Pancreatic Ductal Adenocarcinoma
Lopez-Blazquez, C., Lacalle-González, C., Sanz-Criado, L., Otieno, M. O., García‐Foncillas, J., & Martínez‐Useros, J. (2023) · International Journal of Molecular Sciences · doi:10.3390/ijms241914979 · Cited by 15
Clinical Evaluation of the Pancreatic Cancer Microenvironment: Opportunities and Challenges
Szczepanski, J. M., Rudolf, M. A., & Shi, J. (2024) · Cancers · doi:10.3390/cancers16040794 · Cited by 15
Lu, K., Wang, W., Liu, Y., Xie, C., Liu, J., & Xing, L. (2024) · Frontiers in Oncology · doi:10.3389/fonc.2024.1413494 · Cited by 13
Ma, H., Chen, X., Mo, S., Mao, X., Chen, J., Liu, Y., Lu, Z., Yu, S., & Chen, J. (2023) · Theranostics · doi:10.7150/thno.86547 · Cited by 13
Kucukcelebi, S., Land, F. R. V. ‘., van der Burg, S. H., Eskens, F. A. L. M., Homs, M. Y. V., Willemsen, M., Schoonhoven, A. O.-V., Rozendaal, N. E. M., Fellah, A., Vadgama, D., et al. (2025) · Nature Communications · doi:10.1038/s41467-025-66092-1 · Cited by 12
Aghamajidi, A., Farhangnia, P., Pashangzadeh, S., Damavandi, A. R., & Jafari, R. (2022) · Cancer Cell International · doi:10.1186/s12935-022-02727-3 · Cited by 12
Guo, S., & Wang, Z. (2024) · Frontiers in Oncology · doi:10.3389/fonc.2024.1349308 · Cited by 13
Zhao, Y., Qin, C., Chen, L., Li, Z., Zhao, B., Li, T., Zhang, X., & Wang, W. (2024) · Biochimica et Biophysica Acta (BBA) - Reviews on Cancer · doi:10.1016/j.bbcan.2024.189183 · Cited by 14
Pratt, H. G., Ma, L., Dziadowicz, S. A., Ott, S., Whalley, T., Szomolay, B., Eubank, T. D., Hu, G., & Boone, B. A. (2024) · Clinical and Translational Medicine · doi:10.1002/ctm2.1595 · Cited by 10
Intratumoral NKT cell accumulation promotes antitumor immunity in pancreatic cancer
Li, J., Moresco, P., & Fearon, D. T. (2024) · Proceedings of the National Academy of Sciences · doi:10.1073/pnas.2403917121 · Cited by 9
From silent partners to potential therapeutic targets: macrophages in colorectal cancer
Khizar, H., Ali, K., & Wang, J. (2025) · Cancer Immunology Immunotherapy · doi:10.1007/s00262-025-03965-w · Cited by 11
Remodeling the Tumor Myeloid Landscape to Enhance Antitumor Antibody Immunotherapies
Hussain, K., Cragg, M. S., & Beers, S. A. (2021) · Cancers · doi:10.3390/cancers13194904 · Cited by 11
Badillo, O., Helfridsson, L., Niemi, J. V. L., & Hellström, M. (2024) · Upsala Journal of Medical Sciences · doi:10.48101/ujms.v129.10627 · Cited by 11
Targeting tumor-associated macrophages to reverse antitumor drug resistance
Li, S., Sheng, J., Zhang, D., & Qin, H. (2024) · Aging · doi:10.18632/aging.205858 · Cited by 12
Al-Khinji, A., Al-Korbi, N., Al-Kuwari, S., Al-Hor, A., & Malouche, D. (2025) · Frontiers in Oncology · doi:10.3389/fonc.2025.1569884 · Cited by 10
Miliotou, Α. N., Georgiou‐Siafis, S. K., Ntenti, C., Pappas, I. S., & Papadopoulou, L. C. (2023) · Current Issues in Molecular Biology · doi:10.3390/cimb45110576 · Cited by 12
Panoramic tumor microenvironment in pancreatic ductal adenocarcinoma
Li, X., Hou, W., Xiao, C., Yang, H., Zhao, C., & Cao, D. (2024) · Cellular Oncology · doi:10.1007/s13402-024-00970-6 · Cited by 10
Heirene, L., Byrne, H. M., Sepp, A., Gaffney, E. A., & Yates, J. W. T. (2025) · Journal of The Royal Society Interface · doi:10.1098/rsif.2024.0710 · Cited by 10
Soto, M., Filbert, E. L., Yang, H. L., Starzinski, S., Starzinski, A., Gin, M., Chen, B. K., Le, P. L., Li, T., Bol, B., et al. (2024) · Cancer Research Communications · doi:10.1158/2767-9764.crc-23-0550 · Cited by 10
Sarfraz, Z., Sarfraz, A., Farooq, M. D., Khalid, M., Cheema, K., Javad, F., Khan, T., Pervaiz, Z., Sarfraz, M., Jaan, A., et al. (2024) · Journal of Gastrointestinal Cancer · doi:10.1007/s12029-024-01078-8 · Cited by 10
Zhu, T., Wu, X., Liao, Y., Yan, Y., Yu, M., Wang, L., & Xia, Q. (2023) · Clinical Cancer Bulletin · doi:10.1007/s44272-023-00005-5 · Cited by 8
Li, J., Ye, Z., Hu, X., Hou, S., & Hang, Q. (2022) · Cancers · doi:10.3390/cancers14246187 · Cited by 9
Palma, A. M., Vudatha, V., Peixoto, M. L., & Madan, E. (2023) · Advances in cancer research · doi:10.1016/bs.acr.2023.02.005 · Cited by 10
Zhou, Q., Chen, D., Zhang, J., Xiang, J.-F., Zhang, T., Wang, H., & Zhang, Y. (2022) · Journal of Pancreatology · doi:10.1097/jp9.0000000000000109 · Cited by 9
Metadata
- Authors
- Byrne, K. T., Betts, C. B., Mick, R., Sivagnanam, S., Bajor, D. L., Laheru, D. A., Chiorean, E. G., O'Hara, M. H., Liudahl, S. M., Newcomb, C., Alanio, C., Ferreira, A. P., Park, B. S., Ohtani, T., Huffman, A. P., Väyrynen, S. A., Dias Costa, A., Kaiser, J. C., Lacroix, A. M., Redlinger, C., Stern, M., Nowak, J. A., Wherry, E. J., Cheever, M. A., Wolpin, B. M., Furth, E. E., Jaffee, E. M., Coussens, L. M., & Vonderheide, R. H.
- Affiliations
- University of Pennsylvania (US)
- Portland State University (US)
- Oregon Health & Science University (US)
- Case Comprehensive Cancer Center (US)
- Johns Hopkins University (US)
- University of Washington (US)
- 1Abramson Cancer Center, Perelman School of Medicine, University of Pennsylvania, Philadelphia, Pennsylvania.
- Harvard University (US)
- 10Department of Medical Oncology, Dana-Farber Cancer Institute, Harvard Medical School, Boston, Massachusetts.
- Fred Hutch Cancer Center (US)
- F. Hoffmann-La Roche AG (CH)
- Brigham and Women's Hospital (US)
- Corresponding author
- Vonderheide, Robert H.
- ORCID
- Byrne, Katelyn T.
- Betts, Courtney B.
- Mick, Rosemarie
- Sivagnanam, Shamilene
- Bajor, David L.
- Laheru, Daniel A.
- Chiorean, E. Gabriela
- Liudahl, Shannon M.
- Newcomb, Craig
- Alanio, Cécile
- Ferreira, Ana P.
- Park, Byung S.
- Ohtani, Takuya
- Väyrynen, Sara A.
- Kaiser, Judith C.
- Lacroix, Andreanne M.
- Nowak, Jonathan A.
- Wherry, E. John
- Cheever, Martin A.
- Wolpin, Brian M.
- Furth, Emma E.
- Jaffee, Elizabeth M.
- Coussens, Lisa M.
- Vonderheide, Robert H.
- Venue
- Clinical Cancer Research
- Published
- 2021-06-10
- Volume
- 27
- Issue
- 16
- Pages
- 4574-4586
- ISSN
- 1078-0432 (ISSN-L)
- 1557-3265
- PMC
- PMC8667686
- OpenAlex
- W3171434019
- Cited by
- 199
- References
- 33
- Citations by year
- 2026: 37 · 2025: 42 · 2024: 48 · 2023: 41 · 2022: 28 · 2021: 3
- FWCI
- 10.91
- Type
- journal article
- Language
- en
- Open access
- hybrid
- doi.org
- Licence
- Locations
- Clinical Cancer Research (publishedVersion, cc-by-nc-nd)
- PubMed Central (publishedVersion, cc-by-nc-nd)
- PubMed (publishedVersion)
- Funders
- SU2C-Lustgarten Foundation (SU2C-AACR-DT14-14)
- Pancreatic Cancer Action Network (Research Acceleration Network)
- Lustgarten Foundation (NA)
- National Cancer Institute (P30CA016520, R01CA229803, R01CA169123, U01CA224012, U2CCA233280, R01CA223150, R01CA226909, R21HD099367, UM1CA154967)
- Parker Institute for Cancer Immunotherapy (NA)
- Brenden-Colson Center for Pancreatic Care (NA)
- Hale Center for Pancreatic Cancer Research (NA)
- Topics
- Health Sciences › Medicine › Oncology › Pancreatic and Hepatic Oncology Research
- Health Sciences › Medicine › Oncology › Cancer Immunotherapy and Biomarkers
- Life Sciences › Immunology and Microbiology › Immunology › Immunotherapy and Immune Responses
- Keywords
- pancreatic ductal adenocarcinoma, neoadjuvant therapy, tumor microenvironment, T cell infiltration, tumor-associated macrophages, M2 macrophages, dendritic cell maturation, tumor fibrosis, cancer immunotherapy, overall survival
- MeSH terms
- Adult, Aged, Antibodies, Monoclonal, Female, Humans, Male, Middle Aged, Pancreatic Neoplasms, CD40 Antigens, Neoadjuvant Therapy, Tumor Microenvironment, Antibodies, Monoclonal, Humanized
About these checks
Registry, retraction, Cites and statistics results are computed, not judged, with one exception: a printed reference that no index lists is read once by a model before it counts as a citation error. Claims are extracted by a model and kept only when their quote appears verbatim in the text; each cited source is then checked, with a model’s help, for whether it says what the claim relies on. Those verdicts can be wrong — read the claim’s quote and the cited source before relying on one.
Statistics and arithmetic are recomputed, not judged.
Confidence bands are shown only for fields calibrated on our annotated test set. None is calibrated yet, so no band is shown.
What counts as a claim ›How we measure confidence ›How we check this ›
Are you an author, or do you see a problem with this page? Request a review
