

The DOI matches its Crossref record; 55 of the 55 references it cites were found in a registry or an index.
T-cell Receptor Therapy Targeting Mutant Capicua Transcriptional Repressor in Experimental Gliomas
Open accessPublished version of a preprint
Abstract
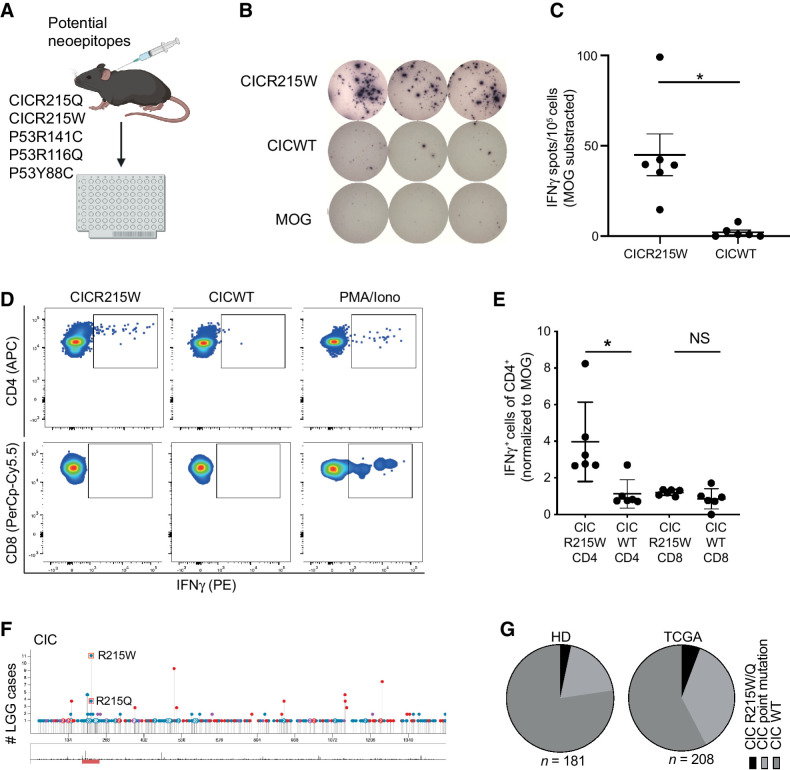
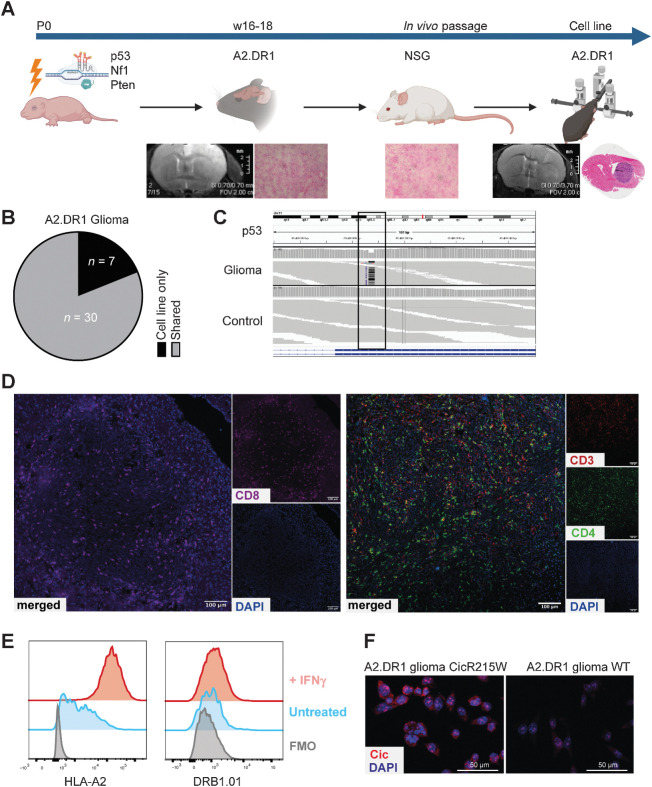
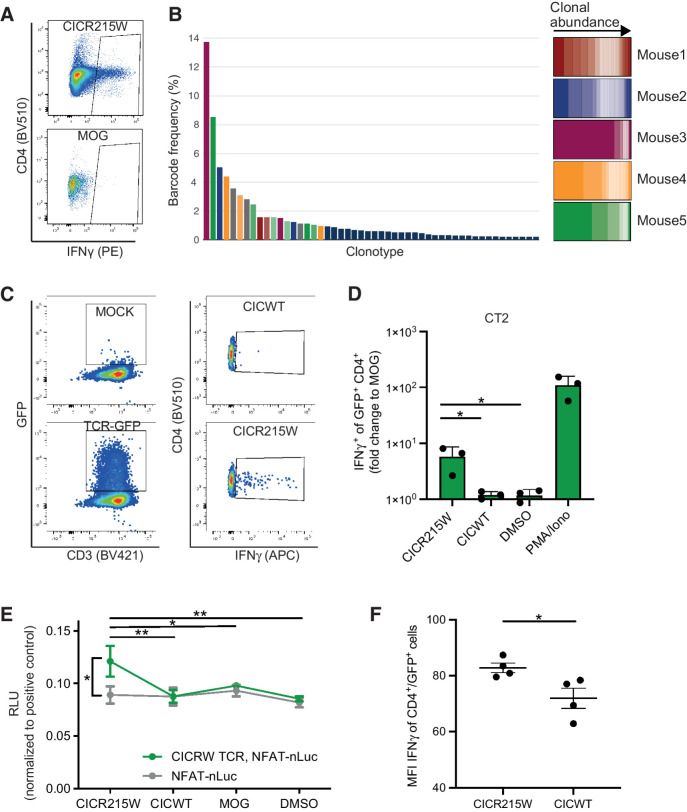
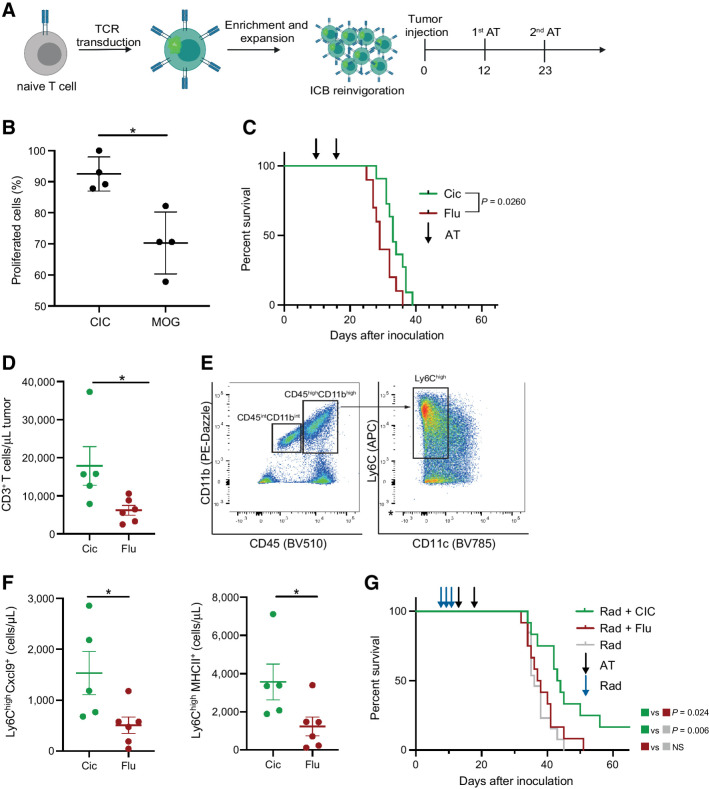
Purpose: Gliomas are intrinsic brain tumors with a high degree of constitutive and acquired resistance to standard therapeutic modalities such as radiotherapy and alkylating chemotherapy. Glioma subtypes are recognized by characteristic mutations. Some of these characteristic mutations have shown to generate immunogenic neoepitopes suitable for targeted immunotherapy. Experimental Design: Using peptide-based ELISpot assays, we screened for potential recurrent glioma neoepitopes in MHC-humanized mice. Following vaccination, droplet-based single-cell T-cell receptor (TCR) sequencing from established T-cell lines was applied for neoepitope-specific TCR discovery. Efficacy of intraventricular TCR-transgenic T-cell therapy was assessed in a newly developed glioma model in MHC-humanized mice induced by CRISPR-based delivery of tumor suppressor–targeting guide RNAs. Results: We identify recurrent capicua transcriptional repressor (CIC) inactivating hotspot mutations at position 215 CICR215W/Q as immunogenic MHC class II (MHCII)-restricted neoepitopes. Vaccination of MHC-humanized mice resulted in the generation of robust MHCII-restricted mutation-specific T-cell responses against CICR215W/Q. Adoptive intraventricular transfer of CICR215W-specific TCR-transgenic T cells exert antitumor responses against CICR215W-expressing syngeneic gliomas. Conclusions: The integration of immunocompetent MHC-humanized orthotopic glioma models in the discovery of shared immunogenic glioma neoepitopes facilitates the identification and preclinical testing of human leukocyte antigen (HLA)-restricted neoepitope-specific TCRs for locoregional TCR-transgenic T-cell adoptive therapy.
Overview
The claims and statistics of this paper haven’t been checked yet.
Run the check — free, no account needed. It reads the open-access text and checks the sources it cites.
Integrity signals
Registry
Cites
Statistics
Figures
Verification
Claims the paper makes
The claims and statistics of this paper haven’t been checked yet.
Run the check — free, no account needed. It reads the open-access text and checks the sources it cites.
Claims other papers make about this one
Each is checked against this paper’s own text: does it say what the citing paper says it does?
The source backs part of the claim, not all of it — or backs it for a different population, condition or comparison.
In the citing paper
“Recently, a murine model system was developed that circumvents this limitation by using an HLA-A*02:01-transgenic murine GBM tumour cell line, which can be transfected with human TAAs and implanted intracranially into immunocompetent HLA-A*02:01-transgenic mice [46].”
From Preclinical development of an mRNA-based multiepitope immunotherapeutic for glioblastoma (2025) · cites this paper as [46]
Experimental — accuracy not yet measured
Self-check
Percentages, sums and reported differences re-computed from the paper’s own numbers.
The self-check needs the paper’s full text.
Citations
Cites
The 2016 World Health Organization Classification of Tumors of the Central Nervous System: a summary
Louis, D. N., Perry, A., Reifenberger, G., von Deimling, A., Figarella‐Branger, D., Cavenee, W. K., Ohgaki, H., Wiestler, O. D., Kleihues, P., & Ellison, D. W. (2016) · Acta Neuropathologica · doi:10.1007/s00401-016-1545-1 · Cited by 15,703
Vogelstein, B., Papadopoulos, N., Velculescu, V. E., Zhou, S., Diaz, L. A., & Kinzler, K. W. (2013) · Science · doi:10.1126/science.1235122 · Cited by 7,863
circlize implements and enhances circular visualization in R
Gu, Z., Gu, L., Eils, R., Schlesner, M., & Brors, B. (2014) · Bioinformatics · doi:10.1093/bioinformatics/btu393 · Cited by 4,290
Chimeric antigen receptor T-cell therapy—assessment and management of toxicities
Neelapu, S. S., Tummala, S., Kebriaei, P., Wierda, W., Gutierrez, C., Locke, F. L., Komanduri, K. V., Lin, Y., Jain, N., Daver, N., et al. (2018) · Nature Reviews Clinical Oncology · doi:10.1038/nrclinonc.2017.148 · Cited by 2,438
Regression of Glioblastoma after Chimeric Antigen Receptor T-Cell Therapy
Brown, C. E., Alizadeh, D., Starr, R., Weng, L., Wagner, J. R., Naranjo, A., Ostberg, J. R., Blanchard, M. S., Kilpatrick, J., Simpson, J., et al. (2016) · New England Journal of Medicine · doi:10.1056/nejmoa1610497 · Cited by 1,842
Shultz, L. D., Lyons, B. L., Burzenski, L. M., Gott, B., Chen, X., Chaleff, S., Kotb, M., Gillies, S. D., King, M., Mangada, J., et al. (2005) · The Journal of Immunology · doi:10.4049/jimmunol.174.10.6477 · Cited by 1,781
Robbins, P. F., Morgan, R. A., Feldman, S. A., Yang, J. C.-H., Sherry, R. M., Dudley, M. E., Wunderlich, J. R., Nahvi, A. V., Helman, L. J., Mackall, C. L., et al. (2011) · Journal of Clinical Oncology · doi:10.1200/jco.2010.32.2537 · Cited by 1,635
Engineering strategies to overcome the current roadblocks in CAR T cell therapy
Rafiq, S., Hackett, C. S., & Brentjens, R. J. (2019) · Nature Reviews Clinical Oncology · doi:10.1038/s41571-019-0297-y · Cited by 1,525
Neoantigen vaccine generates intratumoral T cell responses in phase Ib glioblastoma trial
Keskin, D. B., Anandappa, A. J., Sun, J., Tirosh, I., Mathewson, N. D., Li, S., Oliveira, G., Giobbie-Hurder, A., Felt, K., Gjini, E., et al. (2019) · Nature · doi:10.1038/s41586-018-0792-9 · Cited by 1,432
Mutant MHC class II epitopes drive therapeutic immune responses to cancer
Kreiter, S., Vormehr, M., van de Roemer, N., Diken, M., Löwer, M., Diekmann, J., Boegel, S., Schrörs, B., Vascotto, F., Castle, J. C., et al. (2015) · Nature · doi:10.1038/nature14426 · Cited by 1,243
Self-citationGapped sequence alignment using artificial neural networks: application to the MHC class I system
Andreatta, M., & Nielsen, M. (2015) · Bioinformatics · doi:10.1093/bioinformatics/btv639 · Cited by 1,098
Reliable prediction of T‐cell epitopes using neural networks with novel sequence representations
Nielsen, M., Lundegaard, C., Worning, P., Lauemøller, S. L., Lamberth, K., Buus, S., Brunak, S., & Lund, O. (2003) · Protein Science · doi:10.1110/ps.0239403 · Cited by 1,075
Engineered T cells: the promise and challenges of cancer immunotherapy
Fesnak, A. D., June, C. H., & Levine, B. L. (2016) · Nature Reviews Cancer · doi:10.1038/nrc.2016.97 · Cited by 1,074
Cancer nanomedicine for combination cancer immunotherapy
Nam, J., Son, S., Park, K. S., Zou, W., Shea, L. D., & Moon, J. J. (2019) · Nature Reviews Materials · doi:10.1038/s41578-019-0108-1 · Cited by 955
Actively personalized vaccination trial for newly diagnosed glioblastoma
Hilf, N., Kuttruff-Coqui, S., Frenzel, K., Bukur, V., Stevanović, S., Gouttefangeas, C., Platten, M., Tabatabai, G., Dutoit, V., van der Burg, S. H., et al. (2019) · Nature · doi:10.1038/s41586-018-0810-y · Cited by 938
Self-citationThe movers and shapers in immune privilege of the CNS
Engelhardt, B., Vajkoczy, P., & Weller, R. O. (2017) · Nature Immunology · doi:10.1038/ni.3666 · Cited by 893
Rapoport, A. P., Stadtmauer, E. A., Binder-Scholl, G. K., Goloubeva, O. G., Vogl, D. T., Lacey, S. F., Badros, A. Z., Garfall, A. L., Weiss, B. M., Finklestein, J. M., et al. (2015) · Nature Medicine · doi:10.1038/nm.3910 · Cited by 884
MHC-II neoantigens shape tumour immunity and response to immunotherapy
Alspach, E., Lussier, D. M., Miceli, A. P., Kizhvatov, I., DuPage, M., Luoma, A. M., Meng, W., Lichti, C. F., Esaulova, E., Vomund, A. N., et al. (2019) · Nature · doi:10.1038/s41586-019-1671-8 · Cited by 846
Mutational landscape and clonal architecture in grade II and III gliomas
Suzuki, H., Aoki, K., Chiba, K., Sato, Y., Shiozawa, Y., Shiraishi, Y., Shimamura, T., Niida, A., Motomura, K., Ohka, F., et al. (2015) · Nature Genetics · doi:10.1038/ng.3273 · Cited by 831
House, I. G., Savas, P., Lai, J., Chen, A. X. Y., Oliver, A. J., Teo, Z. L., Todd, K. L., Henderson, M. A., Giuffrida, L., Petley, E. V., et al. (2020) · Clinical Cancer Research · doi:10.1158/1078-0432.ccr-19-1868 · Cited by 790
Brain immunology and immunotherapy in brain tumours
Sampson, J. H., Gunn, M. D., Fecci, P. E., & Ashley, D. M. (2019) · Nature reviews. Cancer · doi:10.1038/s41568-019-0224-7 · Cited by 758
A vaccine targeting mutant IDH1 induces antitumour immunity
Schumacher, T., Bunse, L., Pusch, S., Sahm, F., Wiestler, B., Quandt, J., Menn, O., Osswald, M., Oezen, I., Ott, M., et al. (2014) · Nature · doi:10.1038/nature13387 · Cited by 727
Self-citationT-helper-1-cell cytokines drive cancer into senescence
Braumüller, H., Wieder, T., Brenner, E., Aßmann, S., Hahn, M., Alkhaled, M., Schilbach, K., Essmann, F., Kneilling, M., Griessinger, C., et al. (2013) · Nature · doi:10.1038/nature11824 · Cited by 720
OSSENDORP, F. A., Mengedé, E., Camps, M. G. M., Filius, R., & Melief, C. J. M. (1998) · The Journal of Experimental Medicine · doi:10.1084/jem.187.5.693 · Cited by 609
Suppression of antitumor T cell immunity by the oncometabolite (R)-2-hydroxyglutarate
Bunse, L., Pusch, S., Bunse, T., Sahm, F., Sanghvi, K., Friedrich, M., Alansary, D., Sonner, J. K., Green, E., Deumelandt, K., et al. (2018) · Nature Medicine · doi:10.1038/s41591-018-0095-6 · Cited by 566
Self-citationMutations in CIC and FUBP1 Contribute to Human Oligodendroglioma
Bettegowda, C., Agrawal, N., Jiao, Y., Sausen, M., Wood, L. D., Hruban, R. H., Rodríguez, F. J., Cahill, D. P., McLendon, R. E., Riggins, G. J., et al. (2011) · Science · doi:10.1126/science.1210557 · Cited by 561
Primary Antitumor Immune Response Mediated by CD4+ T Cells
Corthay, A., Skovseth, D. K., Lundin, K. U., Røsjø, E., Omholt, H., Hofgaard, P. O., Haraldsen, G., & Bogen, B. (2005) · Immunity · doi:10.1016/j.immuni.2005.02.003 · Cited by 478
Reynisson, B., Barra, C., Kaabinejadian, S., Hildebrand, W. H., Peters, B., & Nielsen, M. (2020) · Journal of Proteome Research · doi:10.1021/acs.jproteome.9b00874 · Cited by 448
Reardon, D. A., Gokhale, P. C., Klein, S. R., Ligon, K. L., Rodig, S. J., Ramkissoon, S. H., Jones, K. L., Conway, A. S., Liao, X., Zhou, J., et al. (2016) · Cancer Immunology Research · doi:10.1158/2326-6066.cir-15-0151 · Cited by 405
Emerging Cellular Therapies for Cancer
Guedan, S., Ruella, M., & June, C. H. (2018) · Annual Review of Immunology · doi:10.1146/annurev-immunol-042718-041407 · Cited by 394
CD4 + T cells eliminate MHC class II-negative cancer cells in vivo by indirect effects of IFN-γ
Mumberg, D., Monach, P. A., Wanderling, S. S., Philip, M., Toledano, A. Y., Schreiber, R. D., & Schreiber, H. W. (1999) · Proceedings of the National Academy of Sciences · doi:10.1073/pnas.96.15.8633 · Cited by 385
Inflammation driven by tumour-specific Th1 cells protects against B-cell cancer
Haabeth, O. A. W., Lorvik, K. B., Hammarström, C. L., Donaldson, I. M., Haraldsen, G., Bogen, B., & Corthay, A. (2011) · Nature Communications · doi:10.1038/ncomms1239 · Cited by 330
Yip, S. S. F., Butterfield, Y. S. N., Morozova, O., Chittaranjan, S., Blough, M. D., An, J., Birol, İ., Chesnelong, C., Chiu, R., Chuah, E., et al. (2011) · The Journal of Pathology · doi:10.1002/path.2995 · Cited by 315
Theruvath, J. L., Sotillo, E., Mount, C., Graef, C. M., Delaidelli, A., Heitzeneder, S., Labanieh, L., Dhingra, S., Leruste, A., Majzner, R. G., et al. (2020) · Nature Medicine · doi:10.1038/s41591-020-0821-8 · Cited by 305
Brown, C. E., Aguilar, B., Starr, R., Yang, X., Chang, W.-C., Weng, L., Chang, B., Sarkissian, A., Brito, A., Sanchez, J. F., et al. (2017) · Molecular Therapy · doi:10.1016/j.ymthe.2017.10.002 · Cited by 304
Somatic CRISPR/Cas9-mediated tumour suppressor disruption enables versatile brain tumour modelling
Zuckermann, M., Hovestadt, V., Knobbe-Thomsen, C. B., Zapatka, M., Northcott, P. A., Schramm, K., Belic, J., Jones, D. T. W., Tschida, B., Moriarity, B., et al. (2015) · Nature Communications · doi:10.1038/ncomms8391 · Cited by 283
Self-citationGenetically engineered T cells for cancer immunotherapy
Li, D., Li, X., Zhou, W.-L., Huang, Y., Liang, X., Jiang, L., Yang, X., Sun, J., Li, Z., Han, W., et al. (2019) · Signal Transduction and Targeted Therapy · doi:10.1038/s41392-019-0070-9 · Cited by 255
Donovan, L., Delaidelli, A., Joseph, S. K., Bielamowicz, K., Fousek, K., Holgado, B., Manno, A., Srikanthan, D., Gad, A. Z., Ommeren, R. V., et al. (2020) · Nature Medicine · doi:10.1038/s41591-020-0827-2 · Cited by 244
Chheda, Z. S., Kohanbash, G., Okada, K., Jahan, N., Sidney, J., Pecoraro, M., Yang, X., Carrera, D. A., Downey, K., Shrivastav, S., et al. (2017) · The Journal of Experimental Medicine · doi:10.1084/jem.20171046 · Cited by 220
Multi-Omics Characterization of the 4T1 Murine Mammary Gland Tumor Model
Schrörs, B., Boegel, S., Albrecht, C. H., Bukur, T., Bukur, V., Holtsträter, C., Ritzel, C., Manninen, K., Tadmor, A. D., Vormehr, M., et al. (2020) · Frontiers in Oncology · doi:10.3389/fonc.2020.01195 · Cited by 215
Self-citationThe Rational Development of CD133-Targeting Immunotherapies for Glioblastoma
Vora, P., Venugopal, C., Salim, S. K., Tatari, N., Bakhshinyan, D., Singh, M., Seyfrid, M., Upreti, D., Rentas, S., Wong, N., et al. (2020) · Cell stem cell · doi:10.1016/j.stem.2020.04.008 · Cited by 193
Heterogeneity of response to immune checkpoint blockade in hypermutated experimental gliomas
Aslan, K., Turco, V., Blobner, J., Sonner, J. K., Liuzzi, A. R., Núñez, N. G., Feo, D. D., Kickingereder, P., Fischer, M. D., Green, E., et al. (2020) · Nature Communications · doi:10.1038/s41467-020-14642-0 · Cited by 166
Self-citationCIC and FUBP1 mutations in oligodendrogliomas, oligoastrocytomas and astrocytomas
Sahm, F., Koelsche, C., Meyer, J., Pusch, S., Lindenberg, K., Mueller, W. C., Herold‐Mende, C. C., von Deimling, A., & Hartmann, C. J. (2012) · Acta Neuropathologica · doi:10.1007/s00401-012-0993-5 · Cited by 149
Self-citationPajot, A., Michel, M., Fazilleau, N., et al. (2004) · European Journal of Immunology · doi:10.1002/eji.200425463 · Cited by 145
Mass cytometry detects H3.3K27M-specific vaccine responses in diffuse midline glioma
Mueller, S., Taitt, J. M., Villanueva-Meyer, J. E., Bonner, E. R., Nejo, T., Lulla, R. R., Goldman, S., Banerjee, A., Chi, S. N., Whipple, N. S., et al. (2020) · Journal of Clinical Investigation · doi:10.1172/jci140378 · Cited by 125
Effective immuno-targeting of the IDH1 mutation R132H in a murine model of intracranial glioma
Pellegatta, S., Valletta, L., Corbetta, C., Patanè, M., Zucca, I., Sirtori, F. R., Bruzzone, M. G., Fogliatto, G., Isacchi, A., Pollo, B., et al. (2015) · Acta Neuropathologica Communications · doi:10.1186/s40478-014-0180-0 · Cited by 123
K27M-mutant histone-3 as a novel target for glioma immunotherapy
Ochs, K., Ott, M., Bunse, T., Sahm, F., Bunse, L., Deumelandt, K., Sonner, J. K., Keil, M., von Deimling, A., Wick, W., et al. (2017) · OncoImmunology · doi:10.1080/2162402x.2017.1328340 · Cited by 120
Self-citationPatrizii, M., Bartucci, M., Pine, S. R., & Sabaawy, H. E. (2018) · Frontiers in Oncology · doi:10.3389/fonc.2018.00023 · Cited by 107
Cancer cell therapies: the clinical trial landscape
Yu, J. X., Upadhaya, S., Tatake, R. J., Barkalow, F. J., & Hubbard-Lucey, V. M. (2020) · Nature Reviews Drug Discovery · doi:10.1038/d41573-020-00099-9 · Cited by 96
CIC protein instability contributes to tumorigenesis in glioblastoma
Bunda, S., Heir, P., Metcalf, J. L., Li, A. S. C., Agnihotri, S., Pusch, S., Mamatjan, Y., Li, M., Burrell, K. E., Mansouri, S., et al. (2019) · Nature Communications · doi:10.1038/s41467-018-08087-9 · Cited by 84
Self-citationcIMPACT‐NOW: a practical summary of diagnostic points from Round 1 updates
Louis, D. N., Ellison, D. W., Brat, D. J., Aldape, K., Capper, D., Hawkins, C. E., Paulus, W., Perry, A., Reifenberger, G., Figarella-Branger, D. F., et al. (2019) · Brain Pathology · doi:10.1111/bpa.12732 · Cited by 82
PI3 kinase mutations and mutational load as poor prognostic markers in diffuse glioma patients
Draaisma, K., Wijnenga, M. M. J., Weenink, B., Gao, Y., Smid, M., Robe, P. A. J. T., van den Bent, M. J., & French, P. J. (2015) · Acta Neuropathologica Communications · doi:10.1186/s40478-015-0265-4 · Cited by 61
Cic Loss Promotes Gliomagenesis via Aberrant Neural Stem Cell Proliferation and Differentiation
Yang, R. R., Chen, L. H., Hansen, L. J., Carpenter, A. B., Moure, C. J., Liu, H., Pirozzi, C. J., Diplas, B. H., Waitkus, M. S., Greer, P. K., et al. (2017) · Cancer Research · doi:10.1158/0008-5472.can-17-1018 · Cited by 50
Platten, M., Schilling, D., Bunse, L., et al. (2018) · Journal of Clinical Oncology · doi:10.1200/jco.2018.36.15_suppl.2001 · Cited by 25
Self-citationTumor-specific CD4+ T cells eradicate myeloma cells genetically deficient in MHC class II display
Tveita, A. A., Fauskanger, M., Bogen, B., & Haabeth, O. A. W. (2016) · Oncotarget · doi:10.18632/oncotarget.11946 · Cited by 16
Cited by
Sorted by citations
Preclinical development of an mRNA-based multiepitope immunotherapeutic for glioblastoma
Lutz, J., Feist, R. K., Sonntag, T., Peguero-Sánchez, E., Wolter, K., Bick, R., Bauer, J., Walz, J. S., & Heidenreich, R. (2025) · Cancer Immunology, Immunotherapy · doi:10.1007/s00262-025-04178-x · Cited by 9
“Recently, a murine model system was developed that circumvents this limitation by using an HLA-A*02:01-transgenic murine GBM tumour cell line, which can be transfected with human TAAs and implanted intracranially into immunocompetent HLA-A*02:01-transgenic mice [46].”
Metadata
- Authors
- Kilian, M., Friedrich, M., Sanghvi, K., Green, E., Pusch, S., Kawauchi, D., Löwer, M., Sonner, J. K., Krämer, C., Zaman, J., Jung, S., Breckwoldt, M. O., Willimsky, G., Eichmüller, S. B., von Deimling, A., Wick, W., Sahm, F., Platten, M., & Bunse, L.
- Affiliations
- German Cancer Research Center (DE)
- Johannes Gutenberg University Mainz (DE)
- 4DKTK Clinical Cooperation Unit Neuropathology, German Cancer Research Center (DKFZ), Heidelberg, Germany.
- Corresponding author
- Bunse, Lukas
- ORCID
- Venue
- Clinical Cancer Research
- Published
- 2021-11-15
- Volume
- 28
- Issue
- 2
- Pages
- 378-389
- ISSN
- 1078-0432 (ISSN-L)
- 1557-3265
- PMC
- PMC9401455
- OpenAlex
- W3213468635
- Cited by
- 18
- References
- 55
- Citations by year
- 2026: 1 · 2025: 5 · 2024: 2 · 2023: 6 · 2022: 3 · 2021: 1
- FWCI
- 1.69
- Type
- journal article
- Language
- en
- Open access
- hybrid
- doi.org
- Licence
- Locations
- Clinical Cancer Research (publishedVersion, cc-by-nc-nd)
- PubMed Central (publishedVersion, cc-by-nc-nd)
- PubMed (publishedVersion)
- Funders
- German Research Foundation (404521405)
- Topics
- Health Sciences › Medicine › Oncology › Glioma Diagnosis and Treatment
- Life Sciences › Immunology and Microbiology › Immunology › Immunotherapy and Immune Responses
- Health Sciences › Medicine › Oncology › Cancer Immunotherapy and Biomarkers
- Keywords
- glioma, MHC class II restriction, T cell receptor transgenic T cells, adoptive T cell therapy, tumor suppressor mutations, adoptive immunotherapy
- MeSH terms
- Receptors, Chimeric Antigen, Animals, Disease Models, Animal, Glioma, Immunotherapy, Neoplasm Recurrence, Local, T-Lymphocytes, Immunotherapy, Adoptive, Mice
About these checks
Registry, retraction, Cites and statistics results are computed, not judged, with one exception: a printed reference that no index lists is read once by a model before it counts as a citation error. Claims are extracted by a model and kept only when their quote appears verbatim in the text; each cited source is then checked, with a model’s help, for whether it says what the claim relies on. Those verdicts can be wrong — read the claim’s quote and the cited source before relying on one.
Statistics and arithmetic are recomputed, not judged.
Confidence bands are shown only for fields calibrated on our annotated test set. None is calibrated yet, so no band is shown.
What counts as a claim ›How we measure confidence ›How we check this ›
Are you an author, or do you see a problem with this page? Request a review
