

The DOI matches its Crossref record; 52 of the 52 references it cites were found in a registry or an index.
Deep neural networks can predict new-onset atrial fibrillation from the 12-lead ECG and help identify those at risk of atrial fibrillation-related stroke
Open accessPublished version of a preprint
Abstract
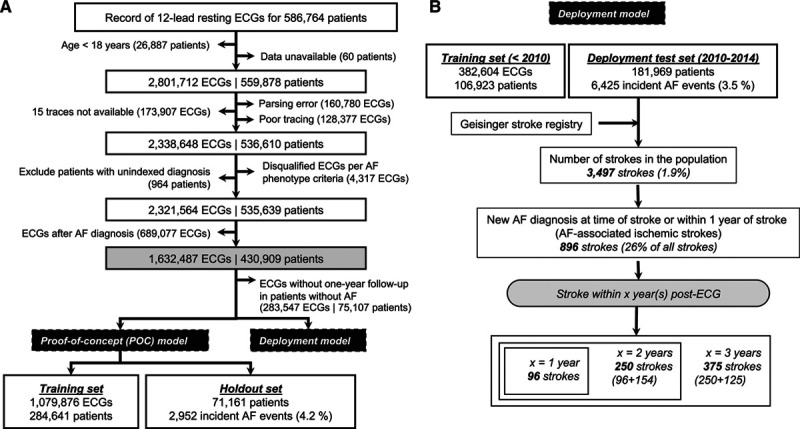
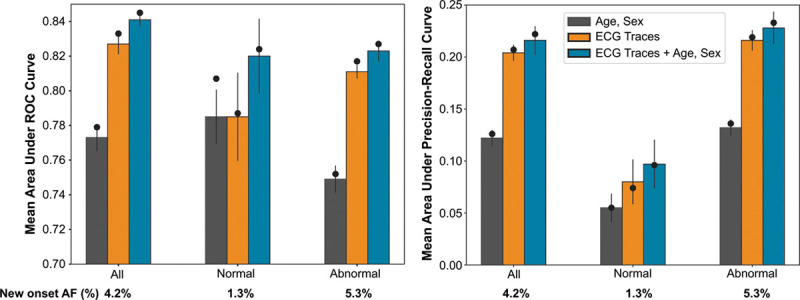
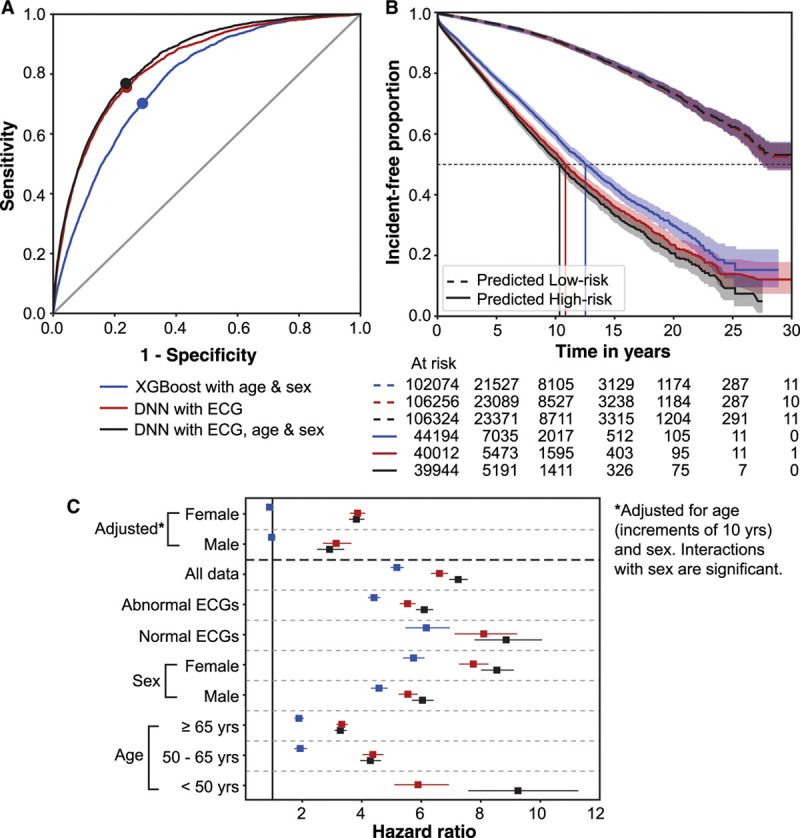
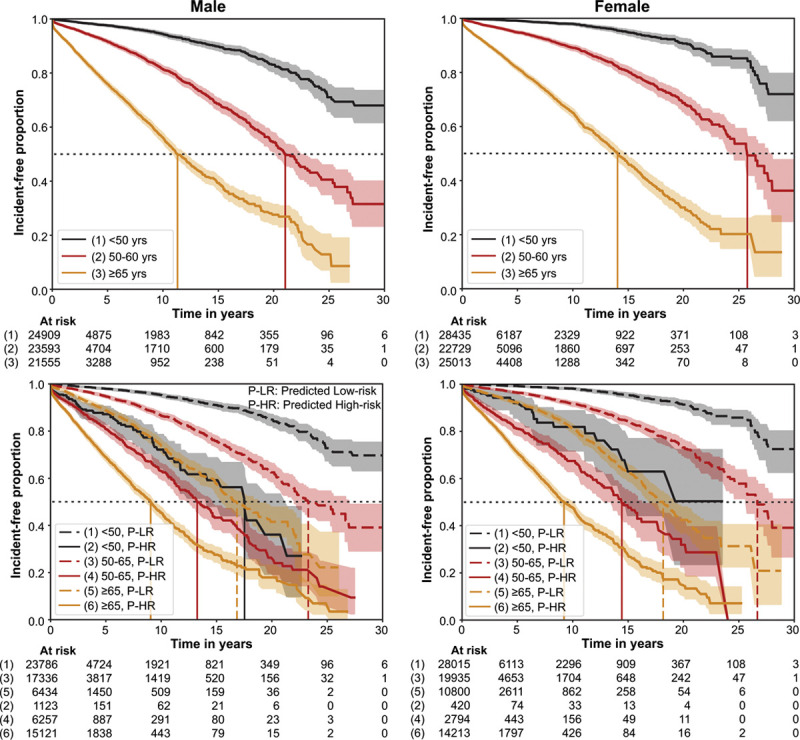
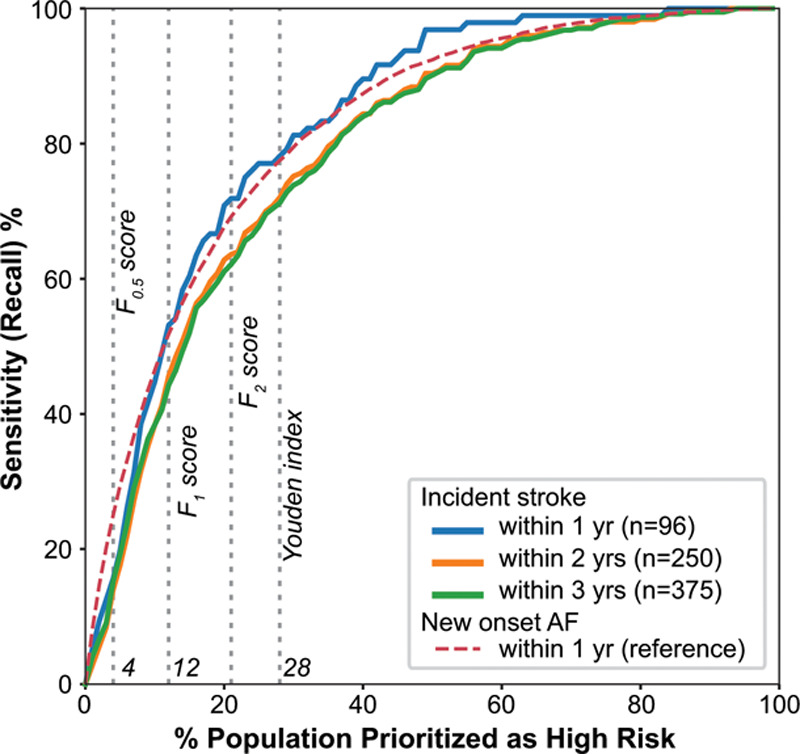
BACKGROUND: Atrial fibrillation (AF) is associated with substantial morbidity, especially when it goes undetected. If new-onset AF could be predicted, targeted screening could be used to find it early. We hypothesized that a deep neural network could predict new-onset AF from the resting 12-lead ECG and that this prediction may help identify those at risk of AF-related stroke. METHODS: We used 1.6 M resting 12-lead digital ECG traces from 430 000 patients collected from 1984 to 2019. Deep neural networks were trained to predict new-onset AF (within 1 year) in patients without a history of AF. Performance was evaluated using areas under the receiver operating characteristic curve and precision-recall curve. We performed an incidence-free survival analysis for a period of 30 years following the ECG stratified by model predictions. To simulate real-world deployment, we trained a separate model using all ECGs before 2010 and evaluated model performance on a test set of ECGs from 2010 through 2014 that were linked to our stroke registry. We identified the patients at risk for AF-related stroke among those predicted to be high risk for AF by the model at different prediction thresholds. RESULTS: The area under the receiver operating characteristic curve and area under the precision-recall curve were 0.85 and 0.22, respectively, for predicting new-onset AF within 1 year of an ECG. The hazard ratio for the predicted high- versus low-risk groups over a 30-year span was 7.2 (95% CI, 6.9-7.6). In a simulated deployment scenario, the model predicted new-onset AF at 1 year with a sensitivity of 69% and specificity of 81%. The number needed to screen to find 1 new case of AF was 9. This model predicted patients at high risk for new-onset AF in 62% of all patients who experienced an AF-related stroke within 3 years of the index ECG. CONCLUSIONS: Deep learning can predict new-onset AF from the 12-lead ECG in patients with no previous history of AF. This prediction may help identify patients at risk for AF-related strokes.
Overview
The claims and statistics of this paper haven’t been checked yet.
Run the check — free, no account needed. It reads the open-access text and checks the sources it cites.
Integrity signals
Registry
Cites
Statistics
Figures
Verification
Claims the paper makes
The claims and statistics of this paper haven’t been checked yet.
Run the check — free, no account needed. It reads the open-access text and checks the sources it cites.
Claims other papers make about this one
Each is checked against this paper’s own text: does it say what the citing paper says it does?
The cited source says what the claim attributes to it.
In the citing paper
“Raghunath et al. showed that AI-ECG prediction of future AF could also enrich for patients at risk of AF-related stroke, supporting the potential use of these models for targeted screening and rhythm monitoring [13].”
From Deep Learning Applied to 12-Lead ECGs for Detection of Structural, Metabolic and Systemic Disease (2026) · cites this paper as [13]
In the citing paper
“Contemporary examples of these clinical applications in cardiology include the use of ECGs to predict left ventricular dysfunction or future development of atrial fibrillation (AF).[13][14][15][16]”
From Unlocking Tomorrow’s Health Care: Expanding the Clinical Scope of Wearables by Applying Artificial Intelligence (2024) · cites this paper as [13]
Self-check
Percentages, sums and reported differences re-computed from the paper’s own numbers.
The self-check needs the paper’s full text.
Citations
Cites
XGBoost: A Scalable Tree Boosting System
Chen, T., & Guestrin, C. (2016) · Proceedings of the 22nd ACM SIGKDD International Conference on Knowledge Discovery and Data Mining · doi:10.1145/2939672.2939785 · Cited by 54,569
Regression Models and Life-Tables
Cox, D. R. (1972) · Journal of the Royal Statistical Society Series B: Statistical Methodology · doi:10.1111/j.2517-6161.1972.tb00899.x · Cited by 39,793
Nonparametric Estimation from Incomplete Observations
Kaplan, E. L., & Meier, P. (1958) · Journal of the American Statistical Association · doi:10.1080/01621459.1958.10501452 · Cited by 39,158
Batch Normalization: Accelerating Deep Network Training by Reducing Internal Covariate Shift
Ioffe, S., & Szegedy, C. (2015) · arXiv · doi:10.48550/arxiv.1502.03167 · Cited by 27,818
Batch Normalization: Accelerating Deep Network Training by Reducing Internal Covariate ShiftPreprint
Ioffe, S. (2024) · arXiv (Cornell University) · doi:10.57702/o9raffed · Cited by 15,273
Dabigatran versus warfarin in patients with atrial fibrillation
Connolly, S. J., Ezekowitz, M. D., Yusuf, S., Eikelboom, J., Oldgren, J., Parekh, A., Pogue, J., Reilly, P. A., Themeles, E., Varrone, J., et al. (2009) · New England Journal of Medicine · doi:10.1056/nejmoa0905561 · Cited by 11,215
Rivaroxaban versus warfarin in nonvalvular atrial fibrillation
Patel, M. R., Mahaffey, K. W., Garg, J., Pan, G., Singer, D. E., Hacke, W., Breithardt, G., Halperin, J. L., Hankey, G. J., Piccini, J. P., et al. (2011) · New England Journal of Medicine · doi:10.1056/nejmoa1009638 · Cited by 9,430
Apixaban versus warfarin in patients with atrial fibrillation
Granger, C. B., Alexander, J. H., McMurray, J. J. V., Lopes, R. D., Hylek, E. M., Hanna, M., Al-Khalidi, H. R., Ansell, J., Atar, D., Avezum, A., et al. (2011) · New England Journal of Medicine · doi:10.1056/nejmoa1107039 · Cited by 8,943
(2010) · Cited by 8,261
Lip, G. Y. H., Nieuwlaat, R., Pisters, R., Lane, D. A., & Crijns, H. J. G. M. (2010) · Chest · doi:10.1378/chest.09-1584 · Cited by 6,879
Research works printed but not linked: 1
- 10.2307/2281868 · DOI · Paper page
Cited by
Sorted by citations
Items 301–313 of 313
Cardiovascular Medicine: Autonomous Monitoring and Treatment Support
Dinç, R., & Ardıç, N. (2026) · Springer eBooks · doi:10.1007/978-3-032-26723-8_17
Senoo, K. (2026) · Japanese Journal of Electrocardiology · doi:10.5105/jse.46.161
Guo, Z. (2026) · Discover Computing · doi:10.1007/s10791-026-10434-0
Pfeifer, J. M., Haggerty, C. M., & Fornwalt, B. K. (2026) · Heart Rhythm · doi:10.1016/j.hrthm.2026.08.027
ECG-based longitudinal risk prediction across diseases and organ systemsPreprint
ye, Y., Zeng, Z., Tian, X., Yuan, Z., Wang, J., & Zhu, Y. (2026) · medRxiv · doi:10.64898/2026.08.29.26361697
Role of Polygenic Risk Scores and Artificial Intelligence
Rossi, M., Gandin, I., Barbati, G., Garoia, F., Ferro, M. D., Gigli, M., & Sinagra, G. (2026) · Springer eBooks · doi:10.1007/978-3-032-34334-5_13
Riek, N. T., Gokhale, T., Ji, R. Q., Aktas, M., Dzikowicz, D. J., Akcakaya, M., Sejdić, E., Al‐Zaiti, S. S., & Saba, S. (2026) · Heart Rhythm O2 · doi:10.1016/j.hroo.2026.09.012
Huang, C.-S., Hsieh, D.-L., Lin, J.-Y., Sreesawat, M., Yeh, T., & Lin, C. (2026) · International Journal of Molecular Sciences · doi:10.3390/ijms27198812
Vorhofflimmer-Screening – Was die P-Welle schon weiß
Wiedmann, F., Weitkamp, F. M., & Schmidt, C. (2026) · Die Innere Medizin · doi:10.1007/s00108-026-02193-3
Systems-based perspectives on atrial fibrillation: integrating classification and severity
Chhabra, P., & Madaan, R. (2026) · Indian Journal of Thoracic and Cardiovascular Surgery · doi:10.1007/s12055-026-02284-8
Bontinck, L., Fonteyn, K., Ribeiro, A. H., Dhaene, T., & Deschrijver, D. (2026) · Expert Systems with Applications · doi:10.1016/j.eswa.2026.134714
Tao, Z., Pan, S., Zhang, S., Gao, Z., Zhang, Y. W., & Fan, G. (2026) · Computer Methods and Programs in Biomedicine · doi:10.1016/j.cmpb.2026.109671
Ahmed, A. A. O., Ahmed, O., Ahmed, R. A. O., Dishean, A. S., Gilbert, C., Mohamed, M. M. A., Ahmed, Y., Abdelmageed, M. H., & Eissa, A. A. (2026) · Annals of Noninvasive Electrocardiology · doi:10.1111/anec.70248
Metadata
- Authors
- Raghunath, S., Pfeifer, J. M., Ulloa-Cerna, A. E., Nemani, A., Carbonati, T., Jing, L., vanMaanen, D. P., Hartzel, D. N., Ruhl, J. A., Lagerman, B. F., Rocha, D. B., Stoudt, N. J., Schneider, G., Johnson, K. W., Zimmerman, N., Leader, J. B., Kirchner, H. L., Griessenauer, C. J., Hafez, A., Good, C. W., Fornwalt, B. K., & Haggerty, C. M.
- Affiliations
- Department of Translational Data Science and Informatics (S.R., A.E.U.-C., L.J., D.P.v.M, J.A.R., N.J.S., G.S., B.K.F., C.M.H.), Geisinger, Danville, PA.
- Heart and Vascular Center, Evangelical Hospital, Lewisburg, PA (J.M.P.).
- Tempus Labs (United States) (US)
- Phenomic Analytics and Clinical Data Core (D.N.H., B.F.L., D.B.R., J.B.L.), Geisinger, Danville, PA.
- Geisinger Health System (US)
- Paracelsus Medical University (AT)
- UPMC Hamot (US)
- Corresponding author
- Haggerty, Christopher M.
- ORCID
- Venue
- Circulation
- Published
- 2021-03-30
- Volume
- 143
- Issue
- 13
- Pages
- 1287-1298
- ISSN
- 0009-7322 (ISSN-L)
- 1524-4539
- PMC
- PMC7996054
- OpenAlex
- W3133470659
- Cited by
- 312
- References
- 50
- Citations by year
- 2026: 56 · 2025: 74 · 2024: 65 · 2023: 51 · 2022: 40 · 2021: 25
- FWCI
- 30.50
- Type
- journal article
- Language
- en
- Open access
- hybrid
- doi.org
- Licence
- cc-by-nc-nd
- Locations
- Circulation (publishedVersion, cc-by-nc-nd)
- medRxiv (acceptedVersion)
- PubMed Central (publishedVersion, cc-by-nc-nd)
- PubMed (publishedVersion)
- Topics
- Health Sciences › Medicine › Cardiology and Cardiovascular Medicine › ECG Monitoring and Analysis
- Health Sciences › Medicine › Cardiology and Cardiovascular Medicine › Atrial Fibrillation Management and Outcomes
- Physical Sciences › Computer Science › Artificial Intelligence › Machine Learning in Healthcare
- Keywords
- new-onset atrial fibrillation, atrial fibrillation prediction, deep neural network, 12-lead ECG, stroke risk stratification, atrial fibrillation screening, digital ECG
- MeSH terms
- Deep Learning, Atrial Fibrillation, Electrocardiography, Female, Humans, Male, Survival Analysis, Neural Networks, Computer, Stroke
About these checks
Registry, retraction, Cites and statistics results are computed, not judged, with one exception: a printed reference that no index lists is read once by a model before it counts as a citation error. Claims are extracted by a model and kept only when their quote appears verbatim in the text; each cited source is then checked, with a model’s help, for whether it says what the claim relies on. Those verdicts can be wrong — read the claim’s quote and the cited source before relying on one.
Statistics and arithmetic are recomputed, not judged.
Confidence bands are shown only for fields calibrated on our annotated test set. None is calibrated yet, so no band is shown.
What counts as a claim ›How we measure confidence ›How we check this ›
Are you an author, or do you see a problem with this page? Request a review
