Cited by 53

The DOI matches its Crossref record; 8 of the 8 references it cites were found in a registry or an index.

microRNA-483 ameliorates hypercholesterolemia by inhibiting PCSK9 production

Dong, Jianjie, He, Ming, Li, Jie, Pessentheiner, Ariane, Wang, Chen, Zhang, Jin, Sun, Yameng, Wang, Wei-Ting, Zhang, Yuqing, Liu, Junhui, Wang, Shen-Chih, Huang, Po-Hsun, Gordts, Philip L.S.M., Yuan, Zu-Yi, Tsimikas, Sotirios, Shyy, John Y.J.·2020·JCI Insight

Abstract

Proprotein convertase subtilisin/kexin type 9 (PCSK9) affects cholesterol homeostasis by targeting hepatic LDL receptor (LDLR) for lysosomal degradation. Clinically, PCSK9 inhibitors effectively reduce LDL-cholesterol (LDL-C) levels and the incidence of cardiovascular events. Because microRNAs (miRs) are integral regulators of cholesterol homeostasis, we investigated the involvement of miR-483 in regulating LDL-C metabolism. Using in silico analysis, we predicted that miR-483-5p targets the 3′-UTR of PCSK9 mRNA. In HepG2 cells, miR-483-5p targeted the PCSK9 3′-UTR, leading to decreased PCSK9 protein and mRNA expression, increased LDLR expression, and enhanced LDL-C uptake. In hyperlipidemic mice and humans, serum levels of total cholesterol and LDL-C were inversely correlated with miR-483-5p levels. In mice, hepatic miR-483 overexpression increased LDLR levels by targeting Pcsk9 , with a significant reduction in plasma total cholesterol and LDL-C levels. Mechanistically, the cholesterol-lowering effect of miR-483-5p was significant in mice receiving AAV8 PCSK9-3′-UTR but not Ldlr -knockout mice or mice receiving AAV8 PCSK9-3′-UTR (ΔBS) with the miR-483-5p targeting site deleted. Thus, exogenously administered miR-483 or similarly optimized compounds have potential to ameliorate hypercholesterolemia.

Overview

The claims and statistics of this paper haven’t been checked yet.

Run the check — free, no account needed. It reads the open-access text and checks the sources it cites.

A few free checks a day · papers already verified open instantly · results are public

Integrity signals

Registry

Crossref · 10.1172/jci.insight.143812

Cites

8 of 8 references verified0 citation errors · 0 not checkable

Statistics

Figures

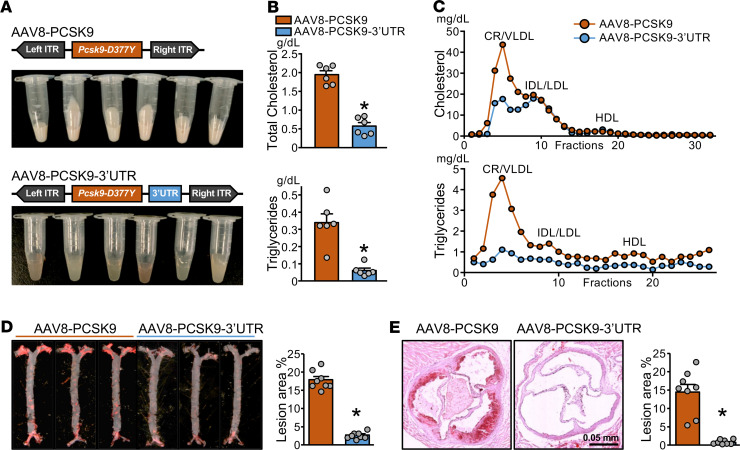
Figure 1 AAV8-PCSK9-3′-UTR alleviates hyperlipidemia and atherosclerosis. (A–E) Male and female C57BL/6 mice were administered a single dose of AAV8-PCSK9 (w/o 3′-UTR) or AAV8 PCSK9-3′-UTR (with 3′-UTR) via tail vein injection (n = 8 in each group) and fed an HFD for 12 weeks before killing. The gross appearance of mouse serum (A); serum levels of total cholesterol and triglycerides (B); FPLC detection of VLDL, LDL, and HDL (C); and representative Oil-red O staining of en face aortae (D) and aortic roots (E) are shown (original magnification, ×6; scale bars: 0.5 mm). In B, D, and E, data are mean ± SEM from 6–8 mice per group. Normally distributed data were analyzed by 2-tailed Student’s t test with Welch correction between 2 groups. *P < 0.05 vs. AAV8-PCSK9. AAV8, adeno-associated virus 8; PCSK9, proprotein convertase subtilisin/kexin type 9; AAV8-PCSK9-3′-UTR, AAV8-based recombinant virus encoding mouse Pcsk9 mRNA encompassing its native 3′-UTR; HFD, high-fat diet; FPLC, fast protein liquid chromatography; VLDL, very LDL-cholesterol.
Figure 1 AAV8-PCSK9-3′-UTR alleviates hyperlipidemia and atherosclerosis. (A–E) Male and female C57BL/6 mice were administered a single dose of AAV8-PCSK9 (w/o 3′-UTR) or AAV8 PCSK9-3′-UTR (with 3′-UTR) via tail vein injection (n = 8 in each group) and fed an HFD for 12 weeks before killing. The gross appearance of mouse serum (A); serum levels of total cholesterol and triglycerides (B); FPLC detection of VLDL, LDL, and HDL (C); and representative Oil-red O staining of en face aortae (D) and aortic roots (E) are shown (original magnification, ×6; scale bars: 0.5 mm). In B, D, and E, data are mean ± SEM from 6–8 mice per group. Normally distributed data were analyzed by 2-tailed Student’s t test with Welch correction between 2 groups. *P < 0.05 vs. AAV8-PCSK9. AAV8, adeno-associated virus 8; PCSK9, proprotein convertase subtilisin/kexin type 9; AAV8-PCSK9-3′-UTR, AAV8-based recombinant virus encoding mouse Pcsk9 mRNA encompassing its native 3′-UTR; HFD, high-fat diet; FPLC, fast protein liquid chromatography; VLDL, very LDL-cholesterol.CC BY · PubMed Central
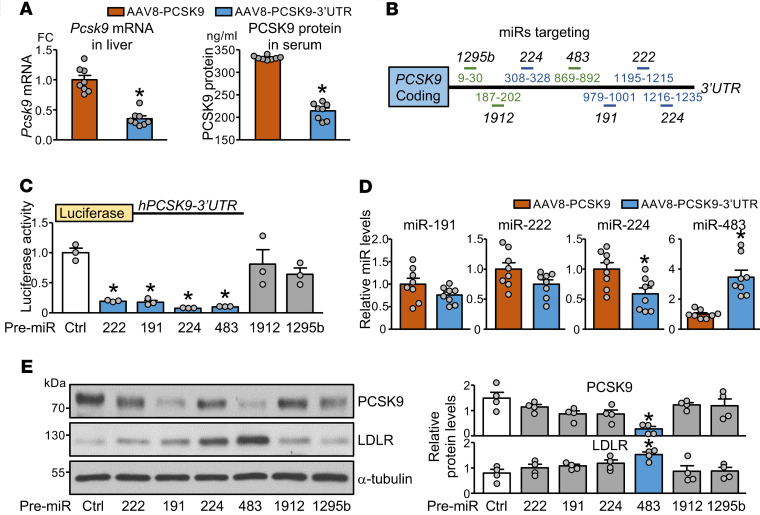
Figure 2 miR-483 regulates PCSK9 via posttranslational mechanism. (A and D) The animals were used as described in Figure 1. The hepatic Pcsk9 mRNA levels (A), ELISA detection of serum levels of PCSK9 (A), and hepatic levels of miR-191, -222, -224, and -483 (D) are shown. (B) Previously reported (blue lines) or newly predicted (green lines) miRs that bind to the hPCSK9-3′-UTR are shown. (C and E) HepG2 cells were transfected with pre–miR-222 mimic (222), pre–miR-224 mimic (224), pre–miR-483 mimic (483), pre–miR-191 mimic (191), pre–miR-1912 mimic (1912), pre–miR-1295b mimic (1295b), or scramble miR control (Ctrl). In C, cells were cotransfected with Luc-PCSK9-3′-UTR reporter. Luciferase activity was measured with pRL-TK activity as a transfection control. In E, protein levels of PCSK9 and LDLR were determined by Western blot analysis; α-tubulin was a loading control. In A and D, data are mean ± SEM from 6–8 mice per group. Normally distributed data were analyzed by 2-tailed Student’s t test with Welch correction between 2 groups. In C and E, data are mean ± SEM from 3–4 independent experiments. Non-normally distributed data were analyzed using Mann-Whitney U test between indicated group and control. *P < 0.05 vs. AAV8-PCSK9 or Ctrl. miR, microRNA; PCSK9, proprotein convertase subtilisin/kexin type 9; HepG2, human hepatocellular carcinoma; LDLR, LDL receptor.
Figure 2 miR-483 regulates PCSK9 via posttranslational mechanism. (A and D) The animals were used as described in Figure 1. The hepatic Pcsk9 mRNA levels (A), ELISA detection of serum levels of PCSK9 (A), and hepatic levels of miR-191, -222, -224, and -483 (D) are shown. (B) Previously reported (blue lines) or newly predicted (green lines) miRs that bind to the hPCSK9-3′-UTR are shown. (C and E) HepG2 cells were transfected with pre–miR-222 mimic (222), pre–miR-224 mimic (224), pre–miR-483 mimic (483), pre–miR-191 mimic (191), pre–miR-1912 mimic (1912), pre–miR-1295b mimic (1295b), or scramble miR control (Ctrl). In C, cells were cotransfected with Luc-PCSK9-3′-UTR reporter. Luciferase activity was measured with pRL-TK activity as a transfection control. In E, protein levels of PCSK9 and LDLR were determined by Western blot analysis; α-tubulin was a loading control. In A and D, data are mean ± SEM from 6–8 mice per group. Normally distributed data were analyzed by 2-tailed Student’s t test with Welch correction between 2 groups. In C and E, data are mean ± SEM from 3–4 independent experiments. Non-normally distributed data were analyzed using Mann-Whitney U test between indicated group and control. *P < 0.05 vs. AAV8-PCSK9 or Ctrl. miR, microRNA; PCSK9, proprotein convertase subtilisin/kexin type 9; HepG2, human hepatocellular carcinoma; LDLR, LDL receptor.CC BY · PubMed Central
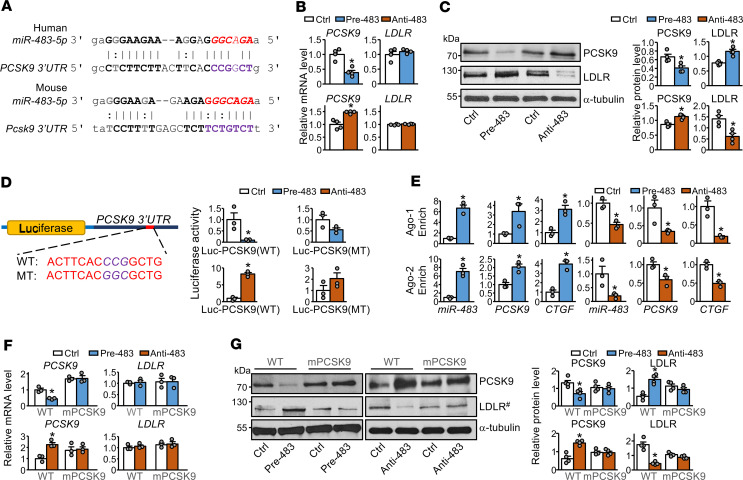
Figure 3 miR-483 targets PCSK9 and enhances LDLR expression in hepatocytes. (A) Bioinformatics prediction of miR-483-5p binding sites in the 3′-UTR of human and mouse PCSK9 mRNA. In B–G, HepG2 cells were transfected with pre–miR-483 mimic (pre-483) or anti–miR-483 (anti-483) for 24 hours. (B and C) mRNA and protein levels of PCSK9 and LDLR. (D) HepG2 cells transfected with pre-483 or anti-483 were cotransfected with Luc-PCSK9-3′-UTR (WT) or Luc-mutated PCSK9-3′-UTR (MT). Luciferase activity was measured with pRL-TK activity as a transfection control. (E) Ago-1 or Ago-2 immunoprecipitation was performed, and miRISCs-associated miR-483, PCSK9, and CTGF mRNA levels were quantified by qPCR. (F and G) mRNA and protein levels of PCSK9 and LDLR in WT HepG2 and mPCSK9 HepG2 cells were transfected with pre-483 or anti-483. #LDLR in the same samples were detected in parallel in a separate gel (G). Data are mean ± SEM from 3–4 independent experiments. In B–G, non-normally distributed data were analyzed using Mann-Whitney U test between indicated group and control. *P < 0.05 vs. control. miR, microRNA; PCSK9, proprotein convertase subtilisin/kexin type 9; HepG2, human hepatocellular carcinoma; LDLR, LDL receptor; Luc-PCSK9-3′-UTR (WT), WT PCSK9 3′-UTR; Luc-mutated PCSK9-3′-UTR (MT), mutant PCSK9 3′-UTR; miRISCs, miRNA-induced silencing complexes; CTGF, connective tissue growth factor.
Figure 3 miR-483 targets PCSK9 and enhances LDLR expression in hepatocytes. (A) Bioinformatics prediction of miR-483-5p binding sites in the 3′-UTR of human and mouse PCSK9 mRNA. In B–G, HepG2 cells were transfected with pre–miR-483 mimic (pre-483) or anti–miR-483 (anti-483) for 24 hours. (B and C) mRNA and protein levels of PCSK9 and LDLR. (D) HepG2 cells transfected with pre-483 or anti-483 were cotransfected with Luc-PCSK9-3′-UTR (WT) or Luc-mutated PCSK9-3′-UTR (MT). Luciferase activity was measured with pRL-TK activity as a transfection control. (E) Ago-1 or Ago-2 immunoprecipitation was performed, and miRISCs-associated miR-483, PCSK9, and CTGF mRNA levels were quantified by qPCR. (F and G) mRNA and protein levels of PCSK9 and LDLR in WT HepG2 and mPCSK9 HepG2 cells were transfected with pre-483 or anti-483. #LDLR in the same samples were detected in parallel in a separate gel (G). Data are mean ± SEM from 3–4 independent experiments. In B–G, non-normally distributed data were analyzed using Mann-Whitney U test between indicated group and control. *P < 0.05 vs. control. miR, microRNA; PCSK9, proprotein convertase subtilisin/kexin type 9; HepG2, human hepatocellular carcinoma; LDLR, LDL receptor; Luc-PCSK9-3′-UTR (WT), WT PCSK9 3′-UTR; Luc-mutated PCSK9-3′-UTR (MT), mutant PCSK9 3′-UTR; miRISCs, miRNA-induced silencing complexes; CTGF, connective tissue growth factor.CC BY · PubMed Central
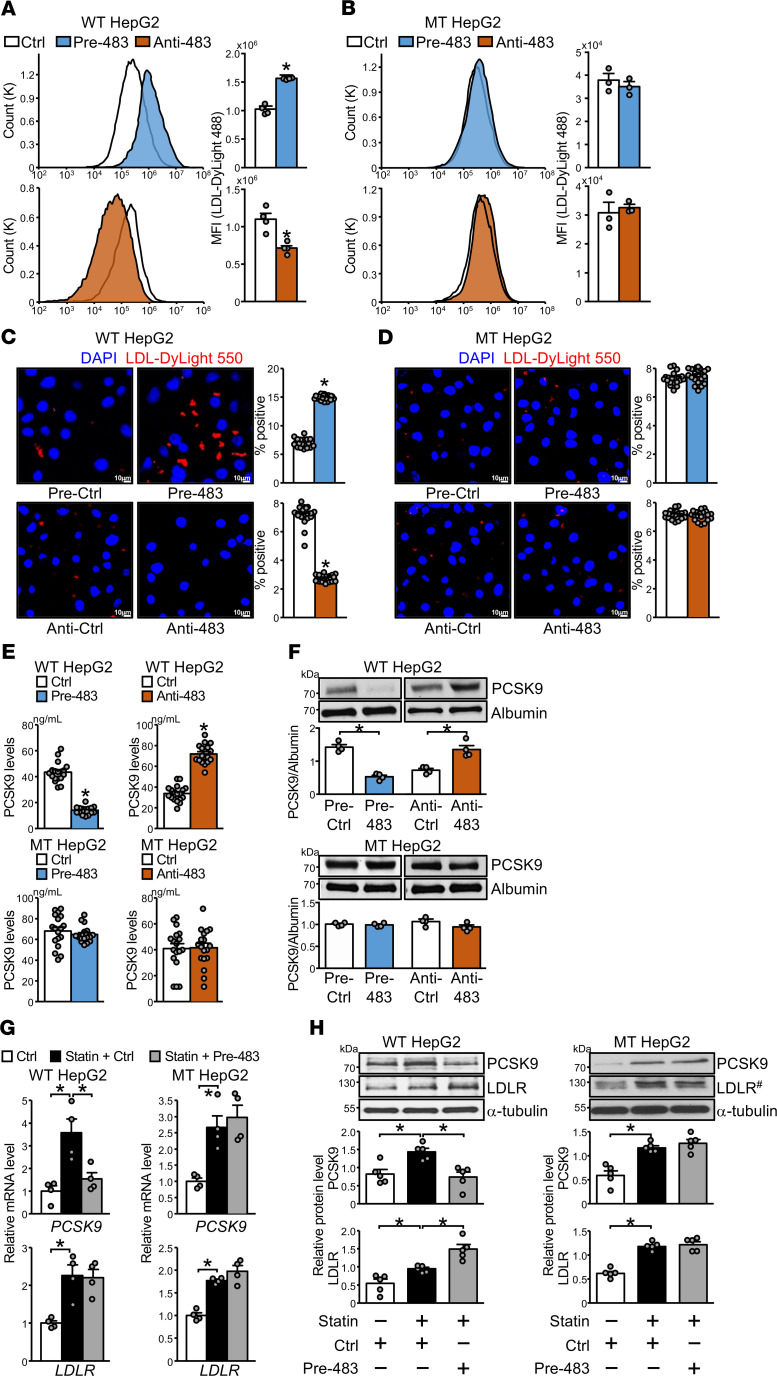
Figure 4 miR-483 overexpression in HepG2 cells increases LDL-C uptake. (A–H) HepG2 and mPCSK9 HepG2 cells were transfected with pre-483 or anti-483 as indicated. Fluorescent-labeled LDL was incubated with HepG2 and mPCSK9 HepG2 cells. LDL uptake was detected by flow cytometry (A and B) or confocal microscopy (C and D) (original magnification, ×20; scale bars: 10 μm). (E and F) Levels of PCSK9 in conditioned media were measured by ELISA and Western blot analysis. (G and H) HepG2 and mPCSK9 HepG2 cells were incubated with 1 μM atorvastatin for 24 hours. mRNA and protein levels of PCSK9 and LDLR were determined by qPCR and Western blot analysis. In MT HepG2 cells, #LDLR in the same samples were detected in parallel in a separate gel (H). Data are mean ± SEM from at least 4 independent experiments. In A, B, and F, non-normally distributed data were analyzed using Mann-Whitney U test between 2 groups. In C–E, normally distributed data were analyzed by 2-tailed Student’s t test with Welch correction between 2 groups. In G and H, non-normally distributed data were analyzed using Kruskal-Wallis test with Dunn’s multiple comparisons between indicated groups. *P < 0.05 vs. Ctrl or between 2 indicated groups. miR, microRNA; HepG2, human hepatocellular carcinoma; LDL-C, LDL-cholesterol; PCSK9, proprotein convertase subtilisin/kexin type 9.
Figure 4 miR-483 overexpression in HepG2 cells increases LDL-C uptake. (A–H) HepG2 and mPCSK9 HepG2 cells were transfected with pre-483 or anti-483 as indicated. Fluorescent-labeled LDL was incubated with HepG2 and mPCSK9 HepG2 cells. LDL uptake was detected by flow cytometry (A and B) or confocal microscopy (C and D) (original magnification, ×20; scale bars: 10 μm). (E and F) Levels of PCSK9 in conditioned media were measured by ELISA and Western blot analysis. (G and H) HepG2 and mPCSK9 HepG2 cells were incubated with 1 μM atorvastatin for 24 hours. mRNA and protein levels of PCSK9 and LDLR were determined by qPCR and Western blot analysis. In MT HepG2 cells, #LDLR in the same samples were detected in parallel in a separate gel (H). Data are mean ± SEM from at least 4 independent experiments. In A, B, and F, non-normally distributed data were analyzed using Mann-Whitney U test between 2 groups. In C–E, normally distributed data were analyzed by 2-tailed Student’s t test with Welch correction between 2 groups. In G and H, non-normally distributed data were analyzed using Kruskal-Wallis test with Dunn’s multiple comparisons between indicated groups. *P < 0.05 vs. Ctrl or between 2 indicated groups. miR, microRNA; HepG2, human hepatocellular carcinoma; LDL-C, LDL-cholesterol; PCSK9, proprotein convertase subtilisin/kexin type 9.CC BY · PubMed Central
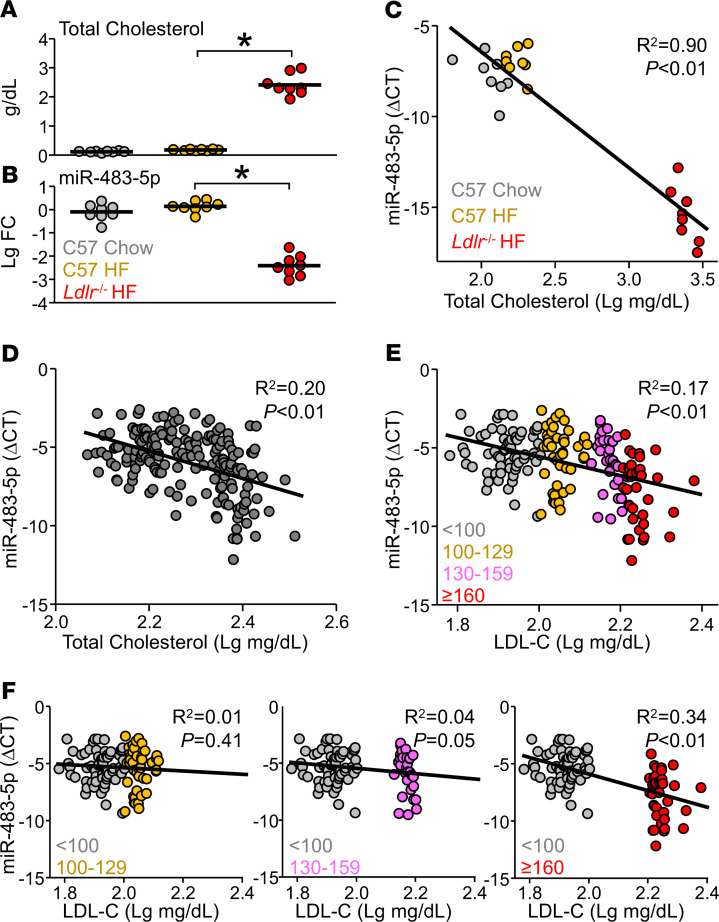
Figure 5 miR-483 levels were decreased in hyperlipidemic mice and human subjects. (A and B) Male and female C57BL/6 mice were fed an HFD or chow diet, and Ldlr-/- mice were fed an HFD for 6 weeks. (C) Correlation of serum levels of miR-483-5p and total cholesterol assessed by the Pearson correlation. (D) Serum was collected from humans (n = 179). Serum levels of total cholesterol and miR-483-5p were measured and correlated. (E and F) Humans (n = 179) were divided into 4 groups based on LDL-C levels: <100 mg/dL (optimal, n = 65, gray dots); 100–129 mg/dL (near/above optimal, n = 46, orange dots); 130–159 mg/dL (borderline high, n = 31, pink dots); and ≥160 mg/dL (high, n = 37, red dots). The correlation between serum levels of LDL-C and miR-483-5p is shown in E. Correlations between the optimal group with the other 3 subgroups (n = 111, 96, 102, respectively) are shown in F. ΔCT represents the difference between the cycle threshold of miR-483-5p and Cel-miR-39. In A and B, data are mean ± SEM from 8 mice per group. Normally distributed data were analyzed by 1-way ANOVA test with a Bonferroni’s post hoc test between 2 indicated groups. The correlation analysis was assessed by the Pearson method. *P < 0.05. miR, microRNA; HFD, high-fat diet; LDL-C, LDL-cholesterol.
Figure 5 miR-483 levels were decreased in hyperlipidemic mice and human subjects. (A and B) Male and female C57BL/6 mice were fed an HFD or chow diet, and Ldlr-/- mice were fed an HFD for 6 weeks. (C) Correlation of serum levels of miR-483-5p and total cholesterol assessed by the Pearson correlation. (D) Serum was collected from humans (n = 179). Serum levels of total cholesterol and miR-483-5p were measured and correlated. (E and F) Humans (n = 179) were divided into 4 groups based on LDL-C levels: <100 mg/dL (optimal, n = 65, gray dots); 100–129 mg/dL (near/above optimal, n = 46, orange dots); 130–159 mg/dL (borderline high, n = 31, pink dots); and ≥160 mg/dL (high, n = 37, red dots). The correlation between serum levels of LDL-C and miR-483-5p is shown in E. Correlations between the optimal group with the other 3 subgroups (n = 111, 96, 102, respectively) are shown in F. ΔCT represents the difference between the cycle threshold of miR-483-5p and Cel-miR-39. In A and B, data are mean ± SEM from 8 mice per group. Normally distributed data were analyzed by 1-way ANOVA test with a Bonferroni’s post hoc test between 2 indicated groups. The correlation analysis was assessed by the Pearson method. *P < 0.05. miR, microRNA; HFD, high-fat diet; LDL-C, LDL-cholesterol.CC BY · PubMed Central
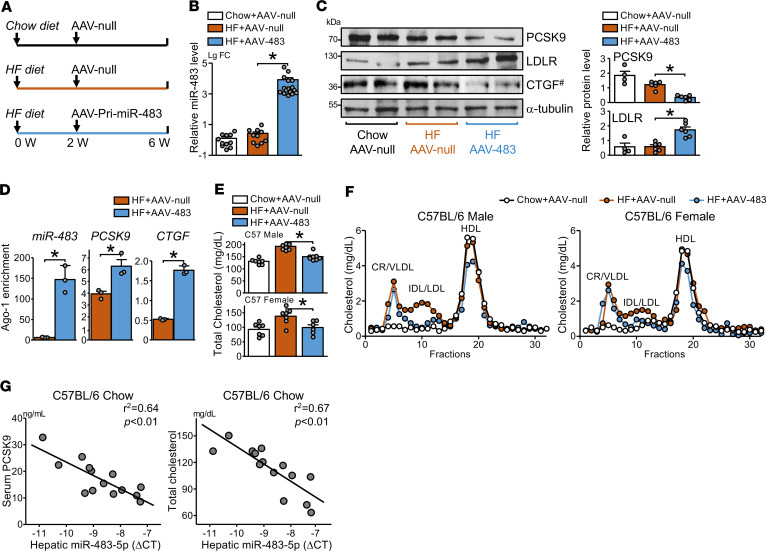
Figure 6 miR-483 reduces circulatory levels of LDL-C in mice. (A) Male and female C57BL/6 mice were fed an HFD or chow diet for 6 weeks. A single dose of AAV8-null (AAV-null) or AAV8-pri-miR-483 (AAV-483) was administered by tail vein injection at the end of week 2. (B and C) Hepatic miR-483-5p levels were determined by qPCR, protein levels of PCSK9, LDLR, and CTGF were detected by Western blot. #CTGF in the same samples were detected in parallel in a separate gel (C). (D) Ago-1 was immunoprecipitated from fixed liver tissue, and Ago1-associated miR-483-5p, Pcsk9, and Ctgf mRNA levels were quantified by qPCR. (E) Total cholesterol levels measured by cholesterol assay. (F) Serum levels of VLDL, LDL, and HDL were determined by FPLC. (G) The correlations between hepatic miR-483-5p expression levels and serum levels of PCSK9 (left) or total cholesterol (right) are shown. ΔCT represents the difference between the cycle threshold of miR-483-5p and U6. The numbers of mice used are shown in Supplemental Table 1. Data are mean ± SEM. In B, non-normally distributed data were analyzed using Kruskal-Wallis test with Dunn’s multiple comparisons between indicated groups. In C and D, non-normally distributed data were analyzed using Mann-Whitney U test. In E, normally distributed data were analyzed by 1-way ANOVA test with a Bonferroni’s post hoc test between 2 indicated groups. In G, the correlation analysis was assessed by the Pearson method. *P < 0.05. miR, microRNA; LDL-C, LDL-cholesterol; HFD, high-fat diet; AAV8, adeno-associated virus 8; PCSK9, proprotein convertase subtilisin/kexin type 9; LDLR, LDL receptor; CTGF, connective tissue growth factor; VLDL, very LDL; IDL, intermediate-density lipoprotein.
Figure 6 miR-483 reduces circulatory levels of LDL-C in mice. (A) Male and female C57BL/6 mice were fed an HFD or chow diet for 6 weeks. A single dose of AAV8-null (AAV-null) or AAV8-pri-miR-483 (AAV-483) was administered by tail vein injection at the end of week 2. (B and C) Hepatic miR-483-5p levels were determined by qPCR, protein levels of PCSK9, LDLR, and CTGF were detected by Western blot. #CTGF in the same samples were detected in parallel in a separate gel (C). (D) Ago-1 was immunoprecipitated from fixed liver tissue, and Ago1-associated miR-483-5p, Pcsk9, and Ctgf mRNA levels were quantified by qPCR. (E) Total cholesterol levels measured by cholesterol assay. (F) Serum levels of VLDL, LDL, and HDL were determined by FPLC. (G) The correlations between hepatic miR-483-5p expression levels and serum levels of PCSK9 (left) or total cholesterol (right) are shown. ΔCT represents the difference between the cycle threshold of miR-483-5p and U6. The numbers of mice used are shown in Supplemental Table 1. Data are mean ± SEM. In B, non-normally distributed data were analyzed using Kruskal-Wallis test with Dunn’s multiple comparisons between indicated groups. In C and D, non-normally distributed data were analyzed using Mann-Whitney U test. In E, normally distributed data were analyzed by 1-way ANOVA test with a Bonferroni’s post hoc test between 2 indicated groups. In G, the correlation analysis was assessed by the Pearson method. *P < 0.05. miR, microRNA; LDL-C, LDL-cholesterol; HFD, high-fat diet; AAV8, adeno-associated virus 8; PCSK9, proprotein convertase subtilisin/kexin type 9; LDLR, LDL receptor; CTGF, connective tissue growth factor; VLDL, very LDL; IDL, intermediate-density lipoprotein.CC BY · PubMed Central
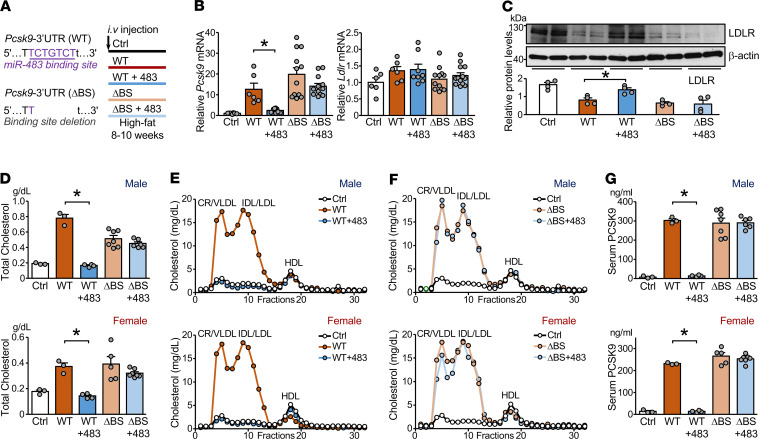
Figure 7 miR-483 targets Pcsk9 3′-UTR to reduce LDL-C levels in mice. (A) Male and female C57BL/6 mice were administered AAV8-PCSK9-3′-UTR WT (WT) or AAV8-PCSK9-3′-UTR with a deleted miR-483 binding site (ΔBS) together with AAV-miR-483 or AAV-null by tail vein injection (n = 6–13 in each group). All mice were fed an HFD for 8–10 weeks. (B) Levels of Pcsk9 and Ldlr mRNA in mouse liver were determined by qPCR. (C) Protein levels of hepatic LDLR were detected by Western blot analysis. (D–F) Serum levels of total cholesterol, VLDL, LDL, and HDL are shown. (G) Serum levels of PCSK9 assessed by ELISA are shown. The numbers of mice used are shown in Supplemental Table 1. Data are mean ± SEM. In B, normally distributed data was analyzed by 1-way ANOVA test with a Bonferroni’s post hoc test between 2 indicated groups. In C, D, and G, non-normally distributed data were analyzed using Mann-Whitney U test between 2 indicated groups. *P < 0.05 vs. WT. miR, microRNA; LDL-C, LDL-cholesterol; AAV8, adeno-associated virus 8; PCSK9, proprotein convertase subtilisin/kexin type 9; AAV8-PCSK9-3′-UTR, AAV8-based recombinant virus encoding mouse Pcsk9 mRNA encompassing its native 3′-UTR; HFD, high-fat diet; LDLR, LDL receptor; VLDL, very LDL.
Figure 7 miR-483 targets Pcsk9 3′-UTR to reduce LDL-C levels in mice. (A) Male and female C57BL/6 mice were administered AAV8-PCSK9-3′-UTR WT (WT) or AAV8-PCSK9-3′-UTR with a deleted miR-483 binding site (ΔBS) together with AAV-miR-483 or AAV-null by tail vein injection (n = 6–13 in each group). All mice were fed an HFD for 8–10 weeks. (B) Levels of Pcsk9 and Ldlr mRNA in mouse liver were determined by qPCR. (C) Protein levels of hepatic LDLR were detected by Western blot analysis. (D–F) Serum levels of total cholesterol, VLDL, LDL, and HDL are shown. (G) Serum levels of PCSK9 assessed by ELISA are shown. The numbers of mice used are shown in Supplemental Table 1. Data are mean ± SEM. In B, normally distributed data was analyzed by 1-way ANOVA test with a Bonferroni’s post hoc test between 2 indicated groups. In C, D, and G, non-normally distributed data were analyzed using Mann-Whitney U test between 2 indicated groups. *P < 0.05 vs. WT. miR, microRNA; LDL-C, LDL-cholesterol; AAV8, adeno-associated virus 8; PCSK9, proprotein convertase subtilisin/kexin type 9; AAV8-PCSK9-3′-UTR, AAV8-based recombinant virus encoding mouse Pcsk9 mRNA encompassing its native 3′-UTR; HFD, high-fat diet; LDLR, LDL receptor; VLDL, very LDL.CC BY · PubMed Central

Verification

Claims the paper makes

The claims and statistics of this paper haven’t been checked yet.

Run the check — free, no account needed. It reads the open-access text and checks the sources it cites.

A few free checks a day · papers already verified open instantly · results are public

Claims other papers make about this one

Each is checked against this paper’s own text: does it say what the citing paper says it does?

Self-check

Percentages, sums and reported differences re-computed from the paper’s own numbers.

The self-check needs the paper’s full text.

Citations

Cites

Research works printed but not linked: 27

  1. 10.1074/jbc.M409699200 · DOI · Paper page
  2. 10.1161/01.ATV.0000134621.14315.43 · DOI · Paper page
  3. 10.1074/jbc.M109.037085 · DOI · Paper page
  4. 10.1172/JCI29383 · DOI · Paper page
  5. 10.1074/jbc.M702027200 · DOI · Paper page
  6. 10.1038/ng1161 · DOI · Paper page
  7. 10.1056/NEJMoa1201832 · DOI
  8. 10.1194/jlr.M700437-JLR200 · DOI
  9. 10.1161/CIRCRESAHA.114.302937 · DOI
  10. 10.1152/ajpgi.00238.2018 · DOI · Paper page
  11. 10.1016/j.cmet.2013.06.010 · DOI
  12. 10.1371/journal.pone.0157085 · DOI
  13. 10.1126/science.1189862 · DOI · Paper page
  14. 10.1161/CIRCRESAHA.116.310233 · DOI
  15. 10.1111/jcmm.12293 · DOI
  16. Zhang, 2020, MicroRNA-483 amelioration of experimental pulmonary hypertension, EMBO Mol Med, 12, 10.15252/emmm.201911303 · DOI
  17. 10.1016/j.yjmcc.2014.06.008 · DOI
  18. 10.1373/clinchem.2007.091280 · DOI
  19. 10.1001/jama.285.19.2486 · DOI · Paper page
  20. 10.1016/j.cell.2010.03.009 · DOI · Paper page
  21. 10.1016/j.atherosclerosis.2015.11.010 · DOI
  22. 10.1056/NEJMoa1501031 · DOI · Paper page
  23. 10.1016/j.omtm.2017.11.007 · DOI · Paper page
  24. 10.1002/1521-3773(20011119)40:22<4128::AID-ANIE4128>3.0.CO;2-S · DOI
  25. 10.1016/j.cmet.2018.03.004 · DOI · Paper page
  26. 10.1371/journal.pbio.0020363 · DOI · Paper page
  27. 10.1021/acssynbio.6b00343 · DOI

Cited by

Sorted by citations

See all 53

Metadata

Authors
Dong, J., He, M., Li, J., Pessentheiner, A., Wang, C., Zhang, J., Sun, Y., Wang, W.-T., Zhang, Y., Liu, J., Wang, S.-C., Huang, P.-H., Gordts, P. L. S. M., Yuan, Z.-Y., Tsimikas, S., & Shyy, J. Y. J.
Affiliations
  • Department of Cardiology, First Affiliated Hospital, and
  • Division of Cardiology and
  • Cardiovascular Research Center, School of Basic Medical Sciences, First Affiliated Hospital, Xi’an Jiaotong University, Xi’an, China.
  • Division of Endocrinology and Metabolism, Department of Medicine, University of California, San Diego, La Jolla, California, USA.
  • Department of Clinical Laboratory, First Affiliated Hospital, Xi’an Jiaotong University, Xi’an, China.
  • Department of Anesthesiology,
  • Department of Critical Care Medicine, Taipei Veterans General Hospital, and
Venue
JCI Insight
Published
2020-12-03
Volume
5
Issue
23
ISSN
2379-3708
Cited by
53
References
8
Language
en
Funders
  • National Institutes of Health (R01HL106579,R01HL108735)
  • National Natural Science Foundation of China (81941005)
  • National Key Research and Development Program grant (2018YFC1311500)
  • Key Project of Research and Development Plan of Shaanxi Province (2017ZDCXL-SF-02-04-01)
  • Ministry of Science and Technology, Taiwan (MOST 108-2633-B-009-001)
  • Academic Senate, University of California, San Diego (RG096470)
  • Foundation Leducq (16CVD01)

About these checks

Registry, retraction, Cites and statistics results are computed, not judged, with one exception: a printed reference that no index lists is read once by a model before it counts as a citation error. Claims are extracted by a model and kept only when their quote appears verbatim in the text; each cited source is then checked, with a model’s help, for whether it says what the claim relies on. Those verdicts can be wrong — read the claim’s quote and the cited source before relying on one.

Statistics and arithmetic are recomputed, not judged.

Confidence bands are shown only for fields calibrated on our annotated test set. None is calibrated yet, so no band is shown.

What counts as a claim ›How we measure confidence ›How we check this ›

Are you an author, or do you see a problem with this page? Request a review