Cited by 13

The DOI matches its Crossref record; 1 of the 1 references it cites were found in a registry or an index.

Mast cell‐derived factor XIIIA contributes to sexual dimorphic defense against group B streptococcal infections

Piliponsky, Adrian M., Sharma, Kavita, Quach, Phoenicia, Brokaw, Alyssa, Nguyen, Shayla, Orvis, Austyn, Saha, Siddhartha S., Samanas, Nyssa Becker, Seepersaud, Ravin, Tang, Yu Ping, Mackey, Emily, Bhise, Gauri, Gendrin, Claire, Furuta, Anna, Seo, Albert J., Guga, Eric, Miralda, Irina, Coleman, Michelle, Sweeney, Erin L., Bäuml, Charlotte A., Imhof, Diana, Snyder, Jessica M., Moeser, Adam J., Rajagopal, Lakshmi·2022·Journal of Clinical Investigation

Overview

The claims and statistics of this paper haven’t been checked yet.

Run the check — free, no account needed. It reads the open-access text and checks the sources it cites.

A few free checks a day · papers already verified open instantly · results are public

Integrity signals

Registry

Crossref · 10.1172/jci157999

Cites

1 of 1 references verified0 citation errors · 0 not checkable

Statistics

Figures

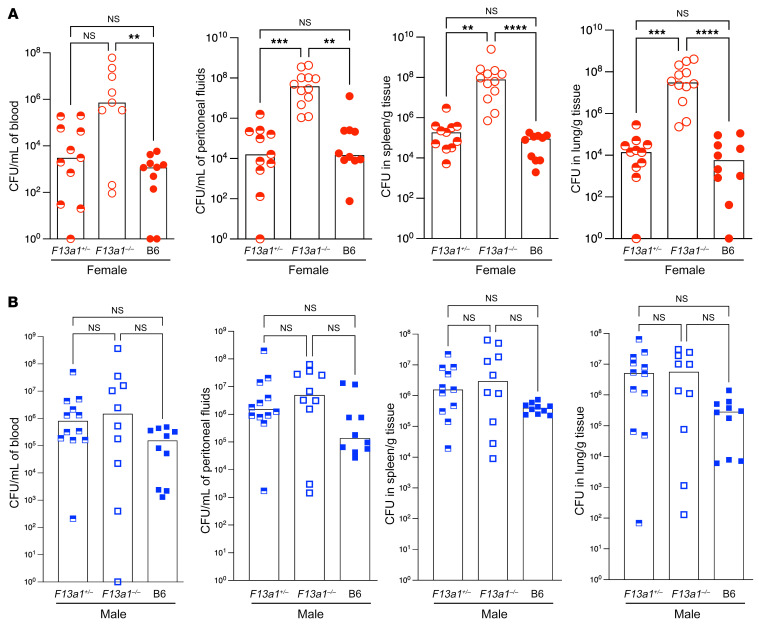
Figure 1 FXIIIA-deficient female mice exhibit increased GBS dissemination during systemic infection. Female FXIIIA-sufficient (B6, F13a1+/–) and FXIIIA-deficient (F13a1–/–) mice (A) and male FXIIIA-sufficient (B6, F13a1+/–) and FXIIIA-deficient (F13a1–/–) mice (B) were infected i.p. with 0.5 to 1 × 10⁸ CFU of WT GBS strain A909. n = 10–12 mice/group. At 24 hours after GBS infection, bacterial burden was evaluated in blood, peritoneal fluids, spleen, and lungs. Data are represented as medians with values from individual mice depicted. The Kruskal-Wallis test with Dunn’s multiple-comparison test was used for comparison of bacterial burden between FXIIIA-sufficient and FXIIIA-deficient mice. **P < 0.01; ***P < 0.001; **** P <0.0001.
Figure 1 FXIIIA-deficient female mice exhibit increased GBS dissemination during systemic infection. Female FXIIIA-sufficient (B6, F13a1+/–) and FXIIIA-deficient (F13a1–/–) mice (A) and male FXIIIA-sufficient (B6, F13a1+/–) and FXIIIA-deficient (F13a1–/–) mice (B) were infected i.p. with 0.5 to 1 × 10⁸ CFU of WT GBS strain A909. n = 10–12 mice/group. At 24 hours after GBS infection, bacterial burden was evaluated in blood, peritoneal fluids, spleen, and lungs. Data are represented as medians with values from individual mice depicted. The Kruskal-Wallis test with Dunn’s multiple-comparison test was used for comparison of bacterial burden between FXIIIA-sufficient and FXIIIA-deficient mice. **P < 0.01; ***P < 0.001; **** P <0.0001.CC BY · PubMed Central
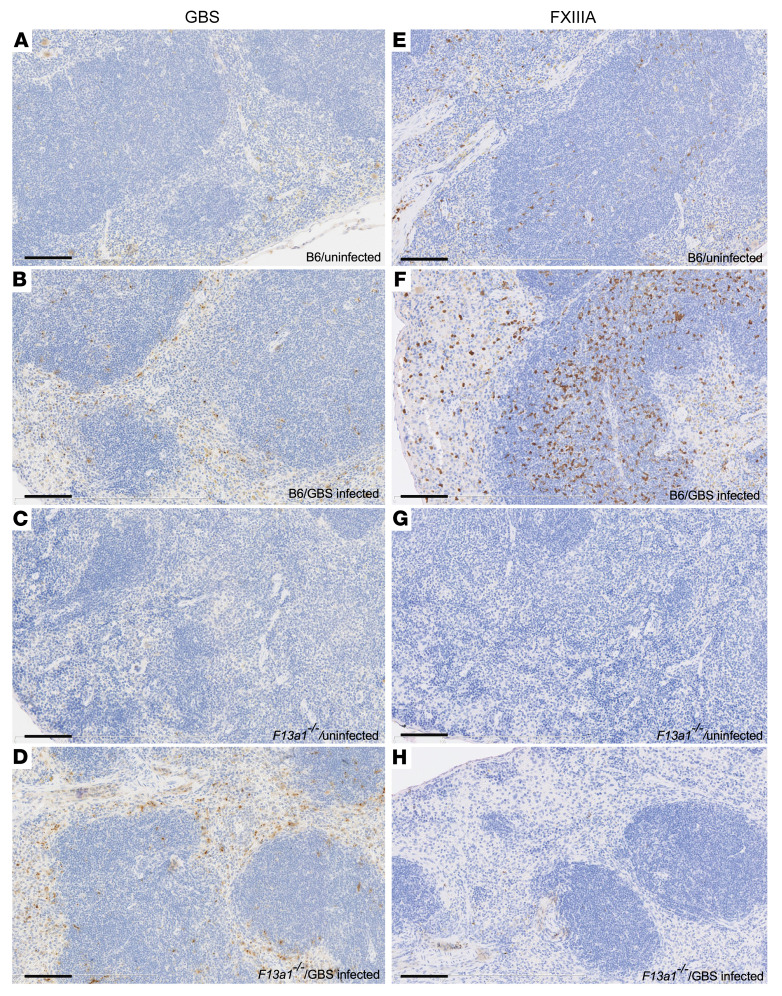
Figure 2 Increased FXIIIA staining in GBS-infected WT mice. Uninfected and GBS-infected mouse spleens from FXIIIA-sufficient (B6) and FXIIIA-deficient mice were immunostained for GBS (left panels) or FXIIIA (right panels). (A and E) Uninfected B6 mice. (B and F) GBS-infected B6 mice. (C and G) Uninfected FXIIIA-deficient mice. (D and H) GBS-infected FXIIIA-deficient mice. Immunostaining was performed on uninfected FXIIIA-sufficient (n = 2) and -deficient mice (n = 1) and GBS-infected FXIIIA-sufficient and -deficient mice (n = 3/group). GBS and FXIIIA immunopositive cells are shown as brown. Hematoxylin counterstain was used. Original magnification, ×20. Scale bars: 100 μm.
Figure 2 Increased FXIIIA staining in GBS-infected WT mice. Uninfected and GBS-infected mouse spleens from FXIIIA-sufficient (B6) and FXIIIA-deficient mice were immunostained for GBS (left panels) or FXIIIA (right panels). (A and E) Uninfected B6 mice. (B and F) GBS-infected B6 mice. (C and G) Uninfected FXIIIA-deficient mice. (D and H) GBS-infected FXIIIA-deficient mice. Immunostaining was performed on uninfected FXIIIA-sufficient (n = 2) and -deficient mice (n = 1) and GBS-infected FXIIIA-sufficient and -deficient mice (n = 3/group). GBS and FXIIIA immunopositive cells are shown as brown. Hematoxylin counterstain was used. Original magnification, ×20. Scale bars: 100 μm.CC BY · PubMed Central
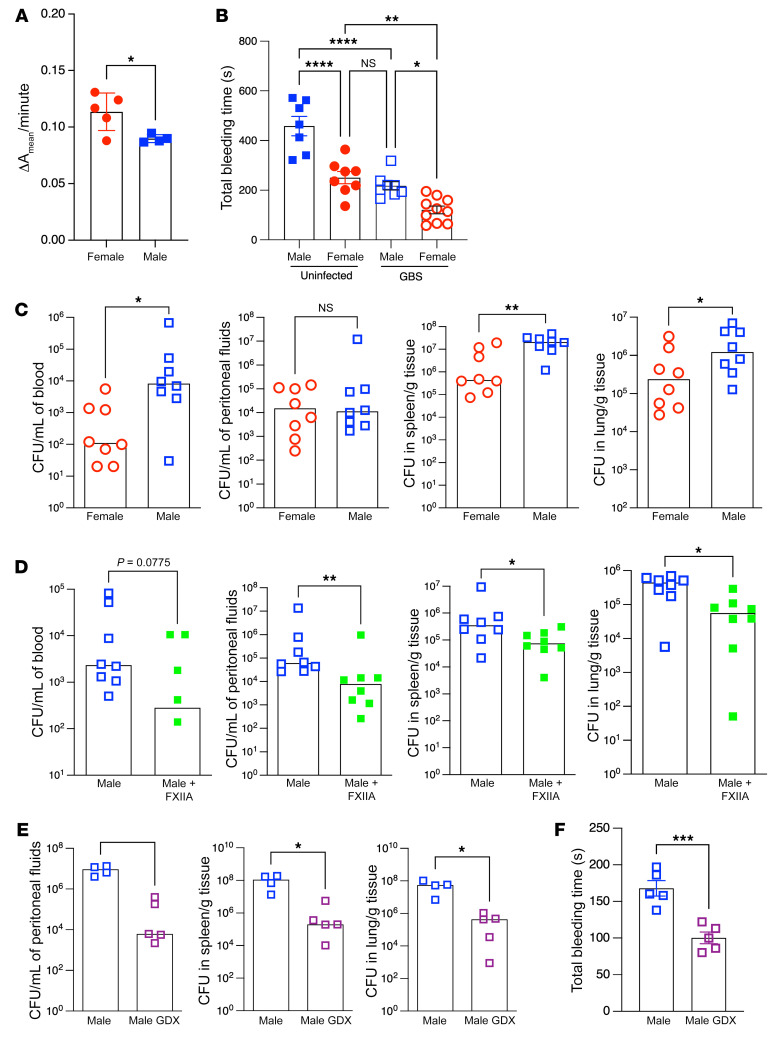
Figure 3 Increased FXIIIA levels promote resistance to GBS infection. (A) FXIIIA activity in plasma from uninfected male and female B6 mice (n = 4–5/group). Data are represented as mean ± SD with individual values. *P < 0.05, unpaired Student’s t test. (B) Bleeding time tests on uninfected or GBS-infected B6 male and female mice at 24 hours after infection (n = 7–10/group). Data are represented as mean ± SEM with individual values. *P < 0.05; **P < 0.01; ****P < 0.0001, Tukey’s multiple-comparison test following 1-way ANOVA. (C) Male and female B6 mice (n = 8–9/group) were infected i.p. with 0.5 to 1 × 10⁸ of WT GBS A909. Bacterial burden in blood, peritoneal fluids, spleen, and lungs at 24 hours after infection. Data are represented as median with individual values. *P < 0.05; **P < 0.01, Mann-Whitney U test. (D) Exogenous FXIIIA (1 unit/mouse) or control PBS was administered i.v. to male B6 mice (n = 8 mice/group) 2 hours after GBS infection as above. Bacterial burden in blood, peritoneal fluids, spleen, and lungs at 24 hours after infection. Data are represented as medians with individual values. *P < 0.05; **P < 0.01, Mann-Whitney U test. (E) GDX and control (sham operated) male B6 mice (n = 4-5/group) were infected with WT GBS, and bacterial burden was evaluated in the peritoneal fluids, spleen, and lungs as above. Data are represented as median with individual values. *P < 0.05, Mann-Whitney U test. Many of the infected mice in the control group were morbid and hence blood could not be collected. (F) Bleeding time tests were performed on GBS-infected male GDX or control (sham operated) B6 mice at 24 hours after infection (n = 5/group). Data are represented as mean ± SEM with individual mouse values. ***P < 0.001, unpaired t test.
Figure 3 Increased FXIIIA levels promote resistance to GBS infection. (A) FXIIIA activity in plasma from uninfected male and female B6 mice (n = 4–5/group). Data are represented as mean ± SD with individual values. *P < 0.05, unpaired Student’s t test. (B) Bleeding time tests on uninfected or GBS-infected B6 male and female mice at 24 hours after infection (n = 7–10/group). Data are represented as mean ± SEM with individual values. *P < 0.05; **P < 0.01; ****P < 0.0001, Tukey’s multiple-comparison test following 1-way ANOVA. (C) Male and female B6 mice (n = 8–9/group) were infected i.p. with 0.5 to 1 × 10⁸ of WT GBS A909. Bacterial burden in blood, peritoneal fluids, spleen, and lungs at 24 hours after infection. Data are represented as median with individual values. *P < 0.05; **P < 0.01, Mann-Whitney U test. (D) Exogenous FXIIIA (1 unit/mouse) or control PBS was administered i.v. to male B6 mice (n = 8 mice/group) 2 hours after GBS infection as above. Bacterial burden in blood, peritoneal fluids, spleen, and lungs at 24 hours after infection. Data are represented as medians with individual values. *P < 0.05; **P < 0.01, Mann-Whitney U test. (E) GDX and control (sham operated) male B6 mice (n = 4-5/group) were infected with WT GBS, and bacterial burden was evaluated in the peritoneal fluids, spleen, and lungs as above. Data are represented as median with individual values. *P < 0.05, Mann-Whitney U test. Many of the infected mice in the control group were morbid and hence blood could not be collected. (F) Bleeding time tests were performed on GBS-infected male GDX or control (sham operated) B6 mice at 24 hours after infection (n = 5/group). Data are represented as mean ± SEM with individual mouse values. ***P < 0.001, unpaired t test.CC BY · PubMed Central
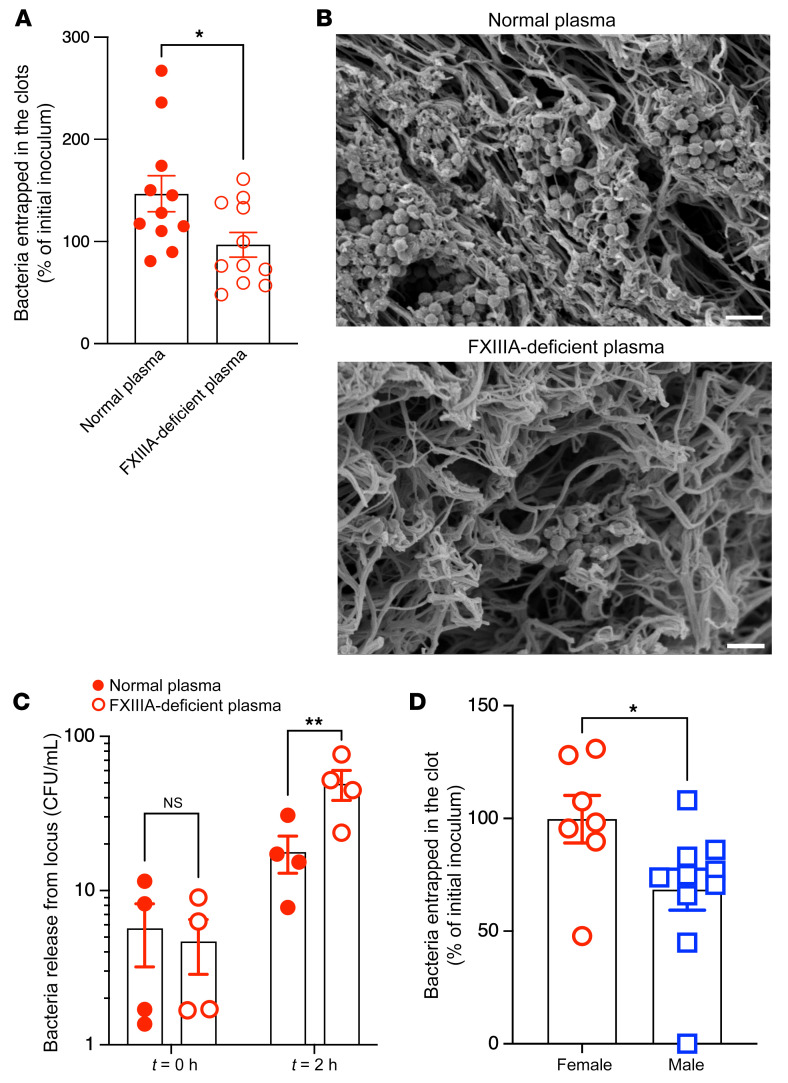
Figure 4 FXIIIA contributes to GBS entrapment within fibrin clots. (A–C) WT GBS COH1 (107 CFU) in 100 μL was incubated with normal human plasma (Normal plasma) or plasma obtained from patients with congenital FXIIIA deficiency (FXIIIA-deficient plasma). Thrombin was added to induce clotting. (A) GBS CFU that were entrapped within the fibrin clot were enumerated. Data are shown as percentage of initial inoculum. n > 5. *P <0.05, unpaired t test. Data are represented as mean ± SEM. (B) Representative scanning electron micrograph showing GBS entrapped in normal plasma or FXIIIA-deficient plasma. Scale bars: 2 μm. (C) In separate experiments, clots obtained from normal or FXIIIA-deficient plasma containing entrapped GBS were washed and incubated in buffer at 37°C for 2 hours. At t = 0 and 2 hours, the number of bacteria released into the supernatant was determined. Data represent mean ± SEM of 4 independent experiments. **P < 0.01, Šidák’s multiple-comparison test following 2-way ANOVA. (D) WT GBS COH1 (107 CFU) was incubated with male or female mouse (B6) plasma. Thrombin was added to induce clotting. GBS CFU that were entrapped within the fibrin clot were enumerated, and data are shown as percentages of initial inoculum. n = 7–10. *P <0.05, unpaired t test. Data are represented as mean ± SEM.
Figure 4 FXIIIA contributes to GBS entrapment within fibrin clots. (A–C) WT GBS COH1 (107 CFU) in 100 μL was incubated with normal human plasma (Normal plasma) or plasma obtained from patients with congenital FXIIIA deficiency (FXIIIA-deficient plasma). Thrombin was added to induce clotting. (A) GBS CFU that were entrapped within the fibrin clot were enumerated. Data are shown as percentage of initial inoculum. n > 5. *P <0.05, unpaired t test. Data are represented as mean ± SEM. (B) Representative scanning electron micrograph showing GBS entrapped in normal plasma or FXIIIA-deficient plasma. Scale bars: 2 μm. (C) In separate experiments, clots obtained from normal or FXIIIA-deficient plasma containing entrapped GBS were washed and incubated in buffer at 37°C for 2 hours. At t = 0 and 2 hours, the number of bacteria released into the supernatant was determined. Data represent mean ± SEM of 4 independent experiments. **P < 0.01, Šidák’s multiple-comparison test following 2-way ANOVA. (D) WT GBS COH1 (107 CFU) was incubated with male or female mouse (B6) plasma. Thrombin was added to induce clotting. GBS CFU that were entrapped within the fibrin clot were enumerated, and data are shown as percentages of initial inoculum. n = 7–10. *P <0.05, unpaired t test. Data are represented as mean ± SEM.CC BY · PubMed Central
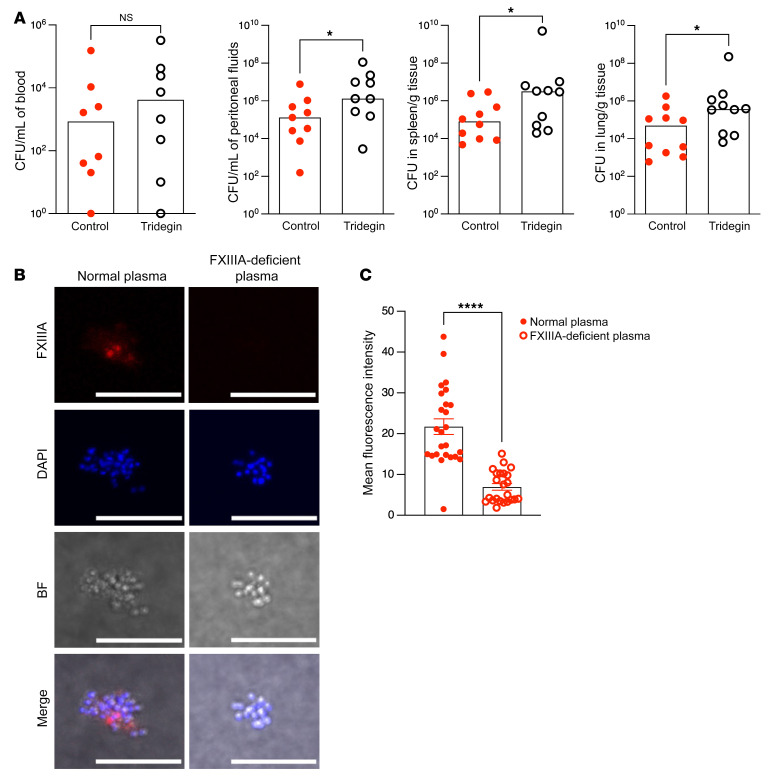
Figure 5 FXIIIA transglutaminase activity is important for limited GBS dissemination. (A) Tridegin (6 μg/mouse) or equivalent volume of control PBS was administered i.v. to female B6 mice (n = 9–10/group) 2 hours after GBS infection (i.p., WT A909). Bacterial burden was evaluated 24 hours after infection. Data are represented as median with values from individual mice shown. *P < 0.05, Mann-Whitney U test. (B and C) WT GBS COH1 was incubated with normal plasma or FXIIIA-deficient plasma. (B) Biotin-cadaverine and streptavidin-cy3 were used to visualize FXIIIA transglutaminase activity on the bacterial surface by immunofluorescence/confocal microscopy. DAPI and bright-field images are also shown. Scale bars: 10 μm. (C) Quantification of FXIIIA transglutaminase activity via immunostaining fluorescence intensity. ****P < 0.0001, unpaired t test. Data are represented as mean ± SEM.
Figure 5 FXIIIA transglutaminase activity is important for limited GBS dissemination. (A) Tridegin (6 μg/mouse) or equivalent volume of control PBS was administered i.v. to female B6 mice (n = 9–10/group) 2 hours after GBS infection (i.p., WT A909). Bacterial burden was evaluated 24 hours after infection. Data are represented as median with values from individual mice shown. *P < 0.05, Mann-Whitney U test. (B and C) WT GBS COH1 was incubated with normal plasma or FXIIIA-deficient plasma. (B) Biotin-cadaverine and streptavidin-cy3 were used to visualize FXIIIA transglutaminase activity on the bacterial surface by immunofluorescence/confocal microscopy. DAPI and bright-field images are also shown. Scale bars: 10 μm. (C) Quantification of FXIIIA transglutaminase activity via immunostaining fluorescence intensity. ****P < 0.0001, unpaired t test. Data are represented as mean ± SEM.CC BY · PubMed Central
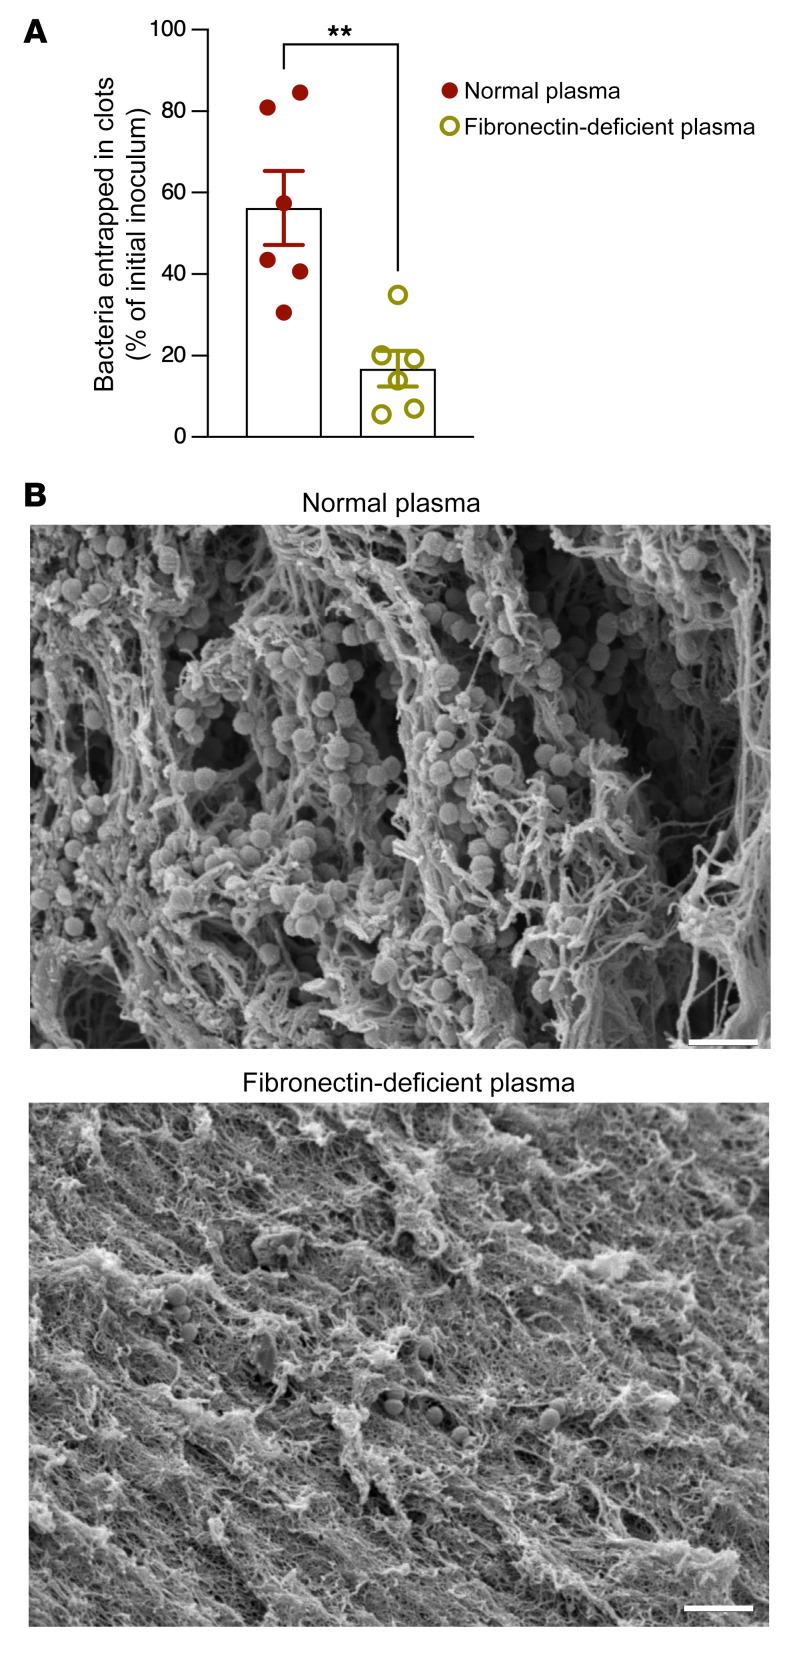
Figure 6 Fibronectin is important for GBS entrapment in fibrin clots. (A and B) GBS WT COH1 (107 CFU) was incubated in 100 μL of normal or fibronectin-deficient human plasma. (A) GBS CFU that were entrapped within the clot were enumerated. Data are shown as percentage of initial inoculum. n = 6. **P < 0.01, unpaired t test. Data are represented as mean ± SEM. (B) Representative scanning electron micrograph showing GBS entrapped in normal plasma or fibronectin-deficient plasma. Scale bar: 2 μm.
Figure 6 Fibronectin is important for GBS entrapment in fibrin clots. (A and B) GBS WT COH1 (107 CFU) was incubated in 100 μL of normal or fibronectin-deficient human plasma. (A) GBS CFU that were entrapped within the clot were enumerated. Data are shown as percentage of initial inoculum. n = 6. **P < 0.01, unpaired t test. Data are represented as mean ± SEM. (B) Representative scanning electron micrograph showing GBS entrapped in normal plasma or fibronectin-deficient plasma. Scale bar: 2 μm.CC BY · PubMed Central
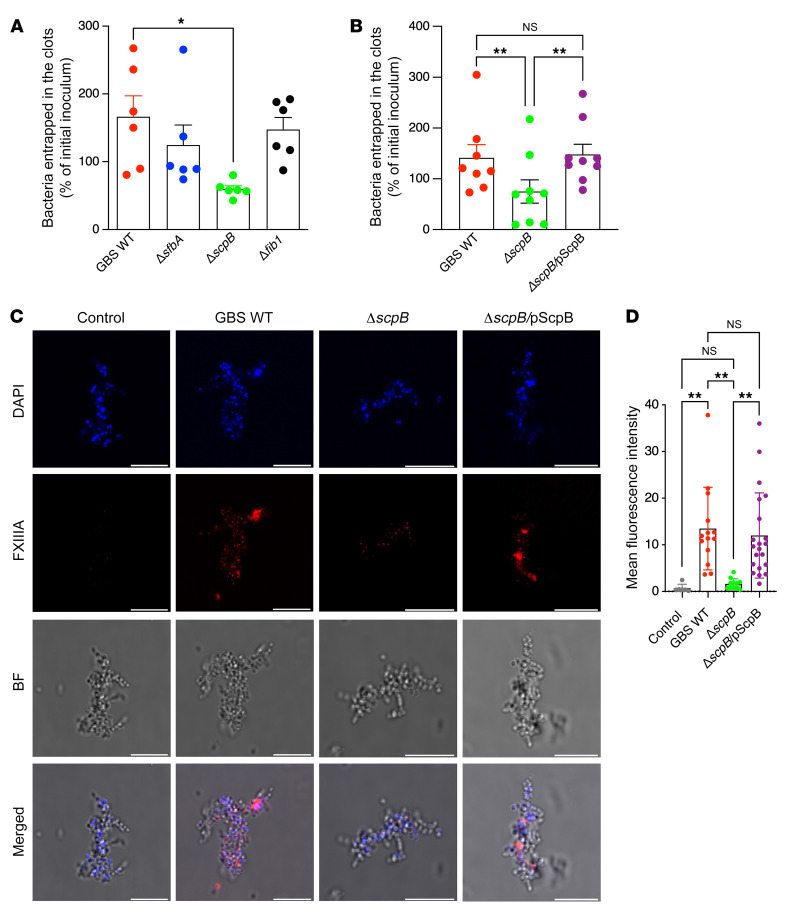
Figure 7 The fibronectin-binding protein ScpB promotes GBS entrapment within fibrin clots. (A) Approximately 107 CFU of GBS WT strain COH1 or isogenic mutants deficient in expression of fibronectin-binding proteins SfbA, ScpB, and FibA (denoted as ΔsfbA, ΔscpB, ΔfibA, respectively) were incubated in normal human plasma. After the addition of thrombin to induce clotting, GBS CFU that were entrapped within the fibrin clot were enumerated. Data are shown as percentage of initial inoculum. n = 6. *P < 0.05, Tukey’s multiple-comparison test following 1-way ANOVA. Data are represented as mean ± SEM. (B) Complementation of ΔscpB with the WT allele exhibited increased entrapment in fibrin clots. GBS WT COH1 and isogenic ΔscpB and the complemented strain ΔscpB/pScpB were incubated in normal human plasma. After the addition of thrombin to induce clotting, GBS CFU that were entrapped within the fibrin clot were enumerated. Data are shown as percentage of initial inoculum. n ≥ 8. **P < 0.01, Tukey’s multiple-comparison test following 1-way ANOVA. Data are represented as mean ± SEM. (C) Plasma obtained from WT mice was activated with thrombin in the presence of either GBS WT COH1, isogenic ΔscpB, or the complemented strain ΔscpB/pScpB. Biotin-cadaverine and streptavidin-cy3 were used to visualize FXIII transglutaminase activity at the bacterial surface using immunofluorescence/confocal microscopy. DAPI and bright field images are also shown. Control samples were processed as above, except that biotin-cadaverine was not added to these samples. Scale bars: 10 μm. (D) Quantification of FXIIIA transglutaminase activity via immunostaining fluorescence intensity. **P < 0.01, Šidák’s multiple-comparison test following 1-way ANOVA. Data are represented as mean ± SD.
Figure 7 The fibronectin-binding protein ScpB promotes GBS entrapment within fibrin clots. (A) Approximately 107 CFU of GBS WT strain COH1 or isogenic mutants deficient in expression of fibronectin-binding proteins SfbA, ScpB, and FibA (denoted as ΔsfbA, ΔscpB, ΔfibA, respectively) were incubated in normal human plasma. After the addition of thrombin to induce clotting, GBS CFU that were entrapped within the fibrin clot were enumerated. Data are shown as percentage of initial inoculum. n = 6. *P < 0.05, Tukey’s multiple-comparison test following 1-way ANOVA. Data are represented as mean ± SEM. (B) Complementation of ΔscpB with the WT allele exhibited increased entrapment in fibrin clots. GBS WT COH1 and isogenic ΔscpB and the complemented strain ΔscpB/pScpB were incubated in normal human plasma. After the addition of thrombin to induce clotting, GBS CFU that were entrapped within the fibrin clot were enumerated. Data are shown as percentage of initial inoculum. n ≥ 8. **P < 0.01, Tukey’s multiple-comparison test following 1-way ANOVA. Data are represented as mean ± SEM. (C) Plasma obtained from WT mice was activated with thrombin in the presence of either GBS WT COH1, isogenic ΔscpB, or the complemented strain ΔscpB/pScpB. Biotin-cadaverine and streptavidin-cy3 were used to visualize FXIII transglutaminase activity at the bacterial surface using immunofluorescence/confocal microscopy. DAPI and bright field images are also shown. Control samples were processed as above, except that biotin-cadaverine was not added to these samples. Scale bars: 10 μm. (D) Quantification of FXIIIA transglutaminase activity via immunostaining fluorescence intensity. **P < 0.01, Šidák’s multiple-comparison test following 1-way ANOVA. Data are represented as mean ± SD.CC BY · PubMed Central
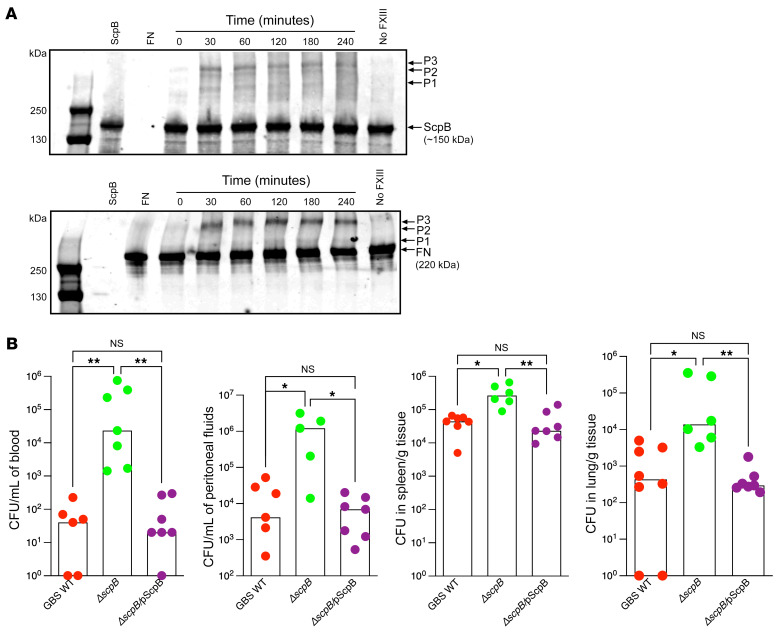
Figure 8 GBS ScpB forms protein complexes with fibronectin and attenuates GBS dissemination. (A) FXIIIA-mediated crosslinking between purified ScpB and fibronectin. ScpB (2 μM) was incubated with fibronectin (1 μM) and FXIIIA (30 μg/mL) in TBS, pH 7.4, 5 mM CaCl2 buffer at 25°C from 0 to 240 minutes. Aliquots were removed at the indicated times and were separated on SDS-PAGE, followed by Western blotting with either the anti-ScpB (top panel) or anti-fibronectin (bottom panel) antibodies. Controls included ScpB alone, fibronectin (FN) alone, or samples lacking FXIIIA. Arrows indicate the positions of the ScpB, FN, and products of the crosslinking reaction, which are depicted as P1, P2, and P3. A representative blot from 3 independent experiments is shown. (B) WT B6 mice were infected i.p. with 0.5 to 1 × 10⁸ CFU of WT GBS strain COH1, isogenic ScpB-deficient GBS (ΔscpB), or the complemented strain(ΔscpB/pScpB). At 24 hours after infection, bacterial burden was evaluated in blood, peritoneal fluids, spleen, and lungs. Data are shown as medians with boxes representing values from individual mice. *P < 0.05; **P < 0.01, Kruskal-Wallis test with Dunn’s multiple-comparison test.
Figure 8 GBS ScpB forms protein complexes with fibronectin and attenuates GBS dissemination. (A) FXIIIA-mediated crosslinking between purified ScpB and fibronectin. ScpB (2 μM) was incubated with fibronectin (1 μM) and FXIIIA (30 μg/mL) in TBS, pH 7.4, 5 mM CaCl2 buffer at 25°C from 0 to 240 minutes. Aliquots were removed at the indicated times and were separated on SDS-PAGE, followed by Western blotting with either the anti-ScpB (top panel) or anti-fibronectin (bottom panel) antibodies. Controls included ScpB alone, fibronectin (FN) alone, or samples lacking FXIIIA. Arrows indicate the positions of the ScpB, FN, and products of the crosslinking reaction, which are depicted as P1, P2, and P3. A representative blot from 3 independent experiments is shown. (B) WT B6 mice were infected i.p. with 0.5 to 1 × 10⁸ CFU of WT GBS strain COH1, isogenic ScpB-deficient GBS (ΔscpB), or the complemented strain(ΔscpB/pScpB). At 24 hours after infection, bacterial burden was evaluated in blood, peritoneal fluids, spleen, and lungs. Data are shown as medians with boxes representing values from individual mice. *P < 0.05; **P < 0.01, Kruskal-Wallis test with Dunn’s multiple-comparison test.CC BY · PubMed Central
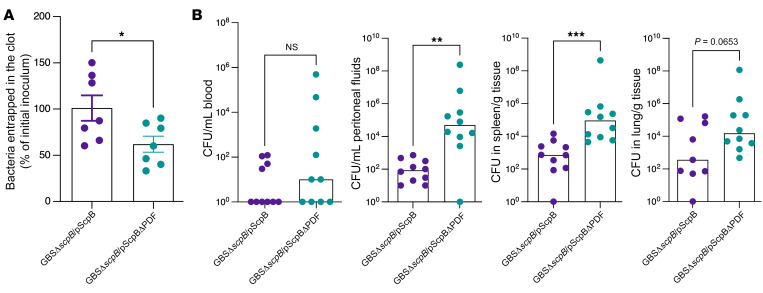
Figure 9 ScpB PDF domain is important for GBS entrapment. (A) Approximately 107 CFU of GBS COH1 with and without the PDF domain in ScpB (GBSΔscpB/pScpB and GBSΔscpB/pScpBΔPDF) was incubated in normal human plasma. After the addition of thrombin to induce clotting, GBS CFU that were entrapped within the fibrin clot were enumerated. Data are shown as percentage of initial inoculum. n = 7. *P < 0.05, unpaired t test. Data are represented as mean ± SEM. (B) Female B6 mice were infected i.p. with 0.5 to 1 × 10⁸ CFU of the above GBS strains (n =10 mice/group). At 24 hours after GBS infection, bacterial burden was evaluated in blood, peritoneal fluids, spleen, and lungs. Data are shown as medians with circles representing values from individual mice. ** P < 0.01; *** P < 0.001. Mann-Whitney U test was used for comparisons of bacterial burden between groups.
Figure 9 ScpB PDF domain is important for GBS entrapment. (A) Approximately 107 CFU of GBS COH1 with and without the PDF domain in ScpB (GBSΔscpB/pScpB and GBSΔscpB/pScpBΔPDF) was incubated in normal human plasma. After the addition of thrombin to induce clotting, GBS CFU that were entrapped within the fibrin clot were enumerated. Data are shown as percentage of initial inoculum. n = 7. *P < 0.05, unpaired t test. Data are represented as mean ± SEM. (B) Female B6 mice were infected i.p. with 0.5 to 1 × 10⁸ CFU of the above GBS strains (n =10 mice/group). At 24 hours after GBS infection, bacterial burden was evaluated in blood, peritoneal fluids, spleen, and lungs. Data are shown as medians with circles representing values from individual mice. ** P < 0.01; *** P < 0.001. Mann-Whitney U test was used for comparisons of bacterial burden between groups.CC BY · PubMed Central
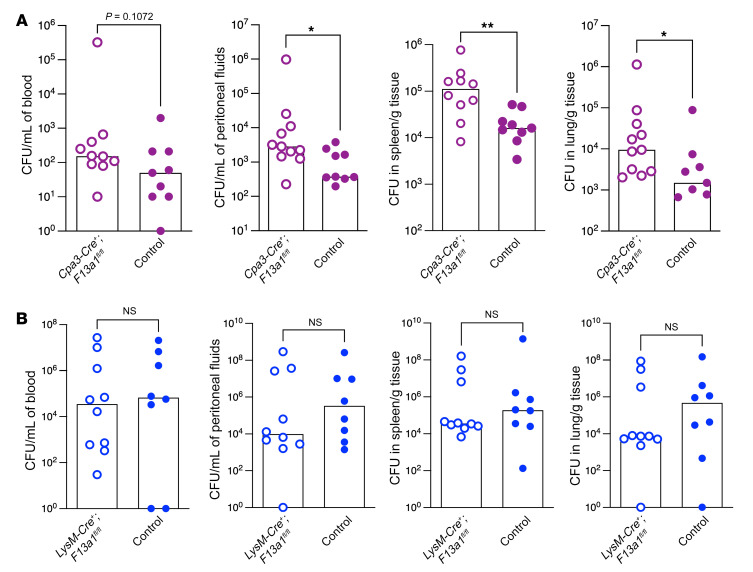
Figure 10 Mast cell–derived FXIIIA is important for defense against GBS infections. (A) Female mice with mast cells lacking FXIIIA (Cpa3-Cre+; F13a1fl/fl) and control mice (n = 9–11/group) were infected i.p. with 0.5 to 1 × 10⁸ of WT GBS strain A909. At 24 hours after infection, bacterial burden was evaluated in peritoneal fluids, spleen, and lungs. Data are shown as medians with values from individual mice also shown. *P < 0.05; **P < 0.01. Mann-Whitney U test was used for comparisons of bacterial burden between the GBS strains. (B) Female mice with myeloid cells lacking FXIIIA (LysM-Cre+; F13a1fl/fl) and control mice were infected with WT GBS as above. At 24 hours after infection, bacterial burden was evaluated in blood, peritoneal fluids, spleen, and lungs. Data are shown as medians with values from individual mice also shown. Mann-Whitney U test was used for comparisons of bacterial burden between the GBS strains.
Figure 10 Mast cell–derived FXIIIA is important for defense against GBS infections. (A) Female mice with mast cells lacking FXIIIA (Cpa3-Cre+; F13a1fl/fl) and control mice (n = 9–11/group) were infected i.p. with 0.5 to 1 × 10⁸ of WT GBS strain A909. At 24 hours after infection, bacterial burden was evaluated in peritoneal fluids, spleen, and lungs. Data are shown as medians with values from individual mice also shown. *P < 0.05; **P < 0.01. Mann-Whitney U test was used for comparisons of bacterial burden between the GBS strains. (B) Female mice with myeloid cells lacking FXIIIA (LysM-Cre+; F13a1fl/fl) and control mice were infected with WT GBS as above. At 24 hours after infection, bacterial burden was evaluated in blood, peritoneal fluids, spleen, and lungs. Data are shown as medians with values from individual mice also shown. Mann-Whitney U test was used for comparisons of bacterial burden between the GBS strains.CC BY · PubMed Central
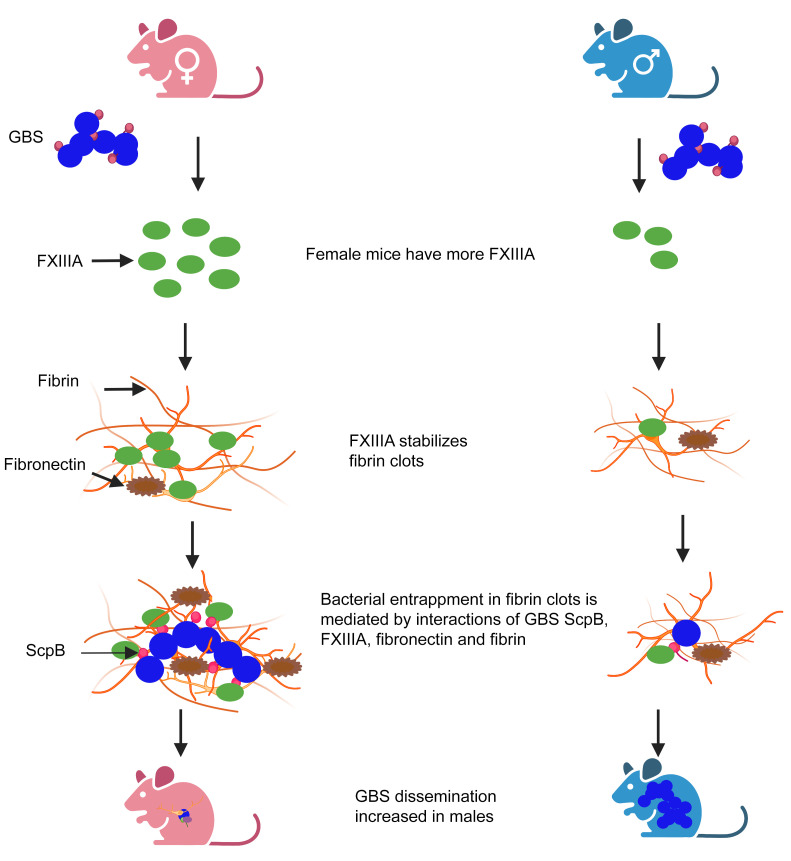
Figure 11 Increased FXIIIA in female mice provides protection against GBS infection. Proposed model shows that female mice produce increased levels of FXIIIA. FXIIIA stabilizes fibrin clots. During GBS infection, FXIIIA interacts with the GBS fibronectin-binding surface protein ScpB and fibronectin, promoting bacterial entrapment, leading to diminished GBS dissemination and infection. Created with BioRender.com.
Figure 11 Increased FXIIIA in female mice provides protection against GBS infection. Proposed model shows that female mice produce increased levels of FXIIIA. FXIIIA stabilizes fibrin clots. During GBS infection, FXIIIA interacts with the GBS fibronectin-binding surface protein ScpB and fibronectin, promoting bacterial entrapment, leading to diminished GBS dissemination and infection. Created with BioRender.com.CC BY · PubMed Central

Verification

Claims the paper makes

The claims and statistics of this paper haven’t been checked yet.

Run the check — free, no account needed. It reads the open-access text and checks the sources it cites.

A few free checks a day · papers already verified open instantly · results are public

Claims other papers make about this one

Each is checked against this paper’s own text: does it say what the citing paper says it does?

Self-check

Percentages, sums and reported differences re-computed from the paper’s own numbers.

The self-check needs the paper’s full text.

Citations

Cites

Show all 1 references

Research works printed but not linked: 72

  1. 10.1093/cid/cix661 · DOI
  2. 10.1093/cid/cix655 · DOI
  3. 10.1093/cid/cix585 · DOI
  4. 10.1001/jamainternmed.2018.7269 · DOI
  5. 10.1007/s10096-020-04041-0 · DOI
  6. 10.1001/jamanetworkopen.2019.18324 · DOI
  7. 10.1016/j.jinf.2018.07.009 · DOI
  8. 10.1371/journal.pntd.0007421 · DOI
  9. 10.1159/000504002 · DOI
  10. 10.1046/j.1538-7836.2003.00334.x · DOI
  11. 10.1016/S0968-0004(01)02007-2 · DOI
  12. 10.1182/blood-2009-05-199208 · DOI
  13. 10.1159/000321005 · DOI
  14. 10.1016/j.jaci.2017.07.042 · DOI
  15. 10.1126/sciadv.1400225 · DOI
  16. 10.1016/j.jaci.2016.03.051 · DOI
  17. 10.1016/j.blre.2016.06.002 · DOI
  18. 10.1160/TH14-07-0625 · DOI
  19. Shi, 2017, Advances of coagulation factor XIII, Chin Med J (Engl), 130, 219
  20. 10.1055/s-0036-1571341 · DOI
  21. 10.1111/jth.12074 · DOI
  22. 10.1371/journal.ppat.1000763 · DOI
  23. 10.1021/bi035239h · DOI
  24. 10.1074/jbc.M113.517904 · DOI
  25. 10.1055/s-0029-1225765 · DOI
  26. 10.1111/ijlh.12756 · DOI
  27. 10.1182/blood.V84.2.517.517 · DOI
  28. 10.1182/blood.V96.3.988 · DOI
  29. 10.1161/ATVBAHA.117.309271 · DOI
  30. 10.3389/fimmu.2021.698121 · DOI
  31. Lauer, 2002, Targeted inactivation of the mouse locus encoding coagulation factor XIII-A: hemostatic abnormalities in mutant mice and characterization of the coagulation deficit, Thromb Haemost, 88, 967, 10.1055/s-0037-1613342 · DOI
  32. 10.1016/j.ijmm.2016.06.001 · DOI
  33. 10.1182/blood-2011-02-337568 · DOI
  34. 10.1021/jm501058g · DOI
  35. 10.1161/01.ATV.18.9.1363 · DOI
  36. 10.1128/IAI.70.6.2869-2876.2002 · DOI
  37. 10.1128/IAI.01559-13 · DOI
  38. 10.1096/fj.09-131458 · DOI
  39. 10.1182/blood-2011-03-343962 · DOI · Paper page
  40. 10.1128/iai.64.7.2387-2390.1996 · DOI
  41. 10.1128/IAI.00241-06 · DOI
  42. 10.1128/IAI.68.9.5018-5025.2000 · DOI
  43. 10.1128/IAI.70.11.6409-6415.2002 · DOI
  44. 10.1128/iai.48.1.83-86.1985 · DOI
  45. 10.1099/00222615-38-2-90 · DOI
  46. 10.1074/jbc.M113.493122 · DOI
  47. 10.1159/000333447 · DOI
  48. Bagoly, 2007, Down-regulation of activated factor XIII by polymorphonuclear granulocyte proteases within fibrin clot, Thromb Haemost, 98, 359, 10.1160/TH07-02-0098 · DOI
  49. 10.1016/j.thromres.2012.02.040 · DOI
  50. 10.1161/01.ATV.19.8.2012 · DOI
  51. 10.1080/00016340701802888 · DOI
  52. 10.1001/jamainternmed.2018.7269 · DOI
  53. 10.1128/JCM.05488-11 · DOI
  54. 10.1186/s12879-019-4177-y · DOI
  55. 10.1097/INF.0000000000002943 · DOI
  56. 10.1186/s12879-017-2811-0 · DOI
  57. 10.1093/humrep/17.10.2762 · DOI · Paper page
  58. 10.1038/s41598-019-45029-x · DOI
  59. van Kassel, 2021, Sex differences in long-term outcomes after Group B streptococcal infections during infancy in Denmark and the Netherlands: national cohort studies of neurodevelopmental impairments and mortality, Clin Infect Dis, 74, 54
  60. 10.1111/1471-0528.15801 · DOI
  61. 10.1128/IAI.00076-11 · DOI
  62. 10.7554/eLife.48772 · DOI
  63. 10.3390/ijms23094978 · DOI
  64. 10.3132/pcrj.2007.00006 · DOI
  65. Russi, 2018, Male-specific IL-33 expression regulates sex-dimorphic EAE susceptibility, Proc Natl Acad Sci U S A, 115, E1520, 10.1073/pnas.1710401115 · DOI
  66. Moorman, 2007, National surveillance for asthma—United States, 1980-2004, MMWR Surveill Summ, 56, 1
  67. 10.1186/s13293-016-0113-7 · DOI
  68. 10.1073/pnas.1915075117 · DOI
  69. 10.1002/cmdc.201100405 · DOI
  70. 10.1084/jem.142.1.165 · DOI
  71. 10.1093/infdis/157.1.91 · DOI
  72. Saha, 2021, Mast cell surfaceome characterization reveals CD98 heavy chain is critical for optimal cell function, J Allergy Clin Immunol, 149, 685, 10.1016/j.jaci.2021.07.014 · DOI

Cited by

Sorted by citations

Metadata

Authors
Piliponsky, A. M., Sharma, K., Quach, P., Brokaw, A., Nguyen, S., Orvis, A., Saha, S. S., Samanas, N. B., Seepersaud, R., Tang, Y. P., Mackey, E., Bhise, G., Gendrin, C., Furuta, A., Seo, A. J., Guga, E., Miralda, I., Coleman, M., Sweeney, E. L., Bäuml, C. A., Imhof, D., Snyder, J. M., Moeser, A. J., & Rajagopal, L.
Venue
Journal of Clinical Investigation
Published
2022-10-17
Volume
132
Issue
20
ISSN
1558-8238
Cited by
13
References
1
Language
en
Funders
National Institutes of Health (R01AI152268,R01AI133976,R01AI145890,R01HD072968,R21 AI140413,T32 AI07509,T32 AI055396)

About these checks

Registry, retraction, Cites and statistics results are computed, not judged, with one exception: a printed reference that no index lists is read once by a model before it counts as a citation error. Claims are extracted by a model and kept only when their quote appears verbatim in the text; each cited source is then checked, with a model’s help, for whether it says what the claim relies on. Those verdicts can be wrong — read the claim’s quote and the cited source before relying on one.

Statistics and arithmetic are recomputed, not judged.

Confidence bands are shown only for fields calibrated on our annotated test set. None is calibrated yet, so no band is shown.

What counts as a claim ›How we measure confidence ›How we check this ›

Are you an author, or do you see a problem with this page? Request a review