Cited by 15

The DOI matches its Crossref record; 4 of the 4 references it cites were found in a registry or an index.

Biofilm-derived oxylipin 10-HOME–mediated immune response in women with breast implants

Khan, Imran, Minto, Robert E., Kelley-Patteson, Christine, Singh, Kanhaiya, Timsina, Lava, Suh, Lily J., Rinne, Ethan, Van Natta, Bruce W., Neumann, Colby R., Mohan, Ganesh, Lester, Mary, VonDerHaar, R. Jason, German, Rana, Marino, Natascia, Hassanein, Aladdin H., Gordillo, Gayle M., Kaplan, Mark H., Sen, Chandan K., Kadin, Marshall E., Sinha, Mithun·2023·Journal of Clinical Investigation

Overview

The claims and statistics of this paper haven’t been checked yet.

Run the check — free, no account needed. It reads the open-access text and checks the sources it cites.

A few free checks a day · papers already verified open instantly · results are public

Integrity signals

Registry

Crossref · 10.1172/jci165644

Cites

4 of 4 references verified0 citation errors · 0 not checkable

Statistics

Figures

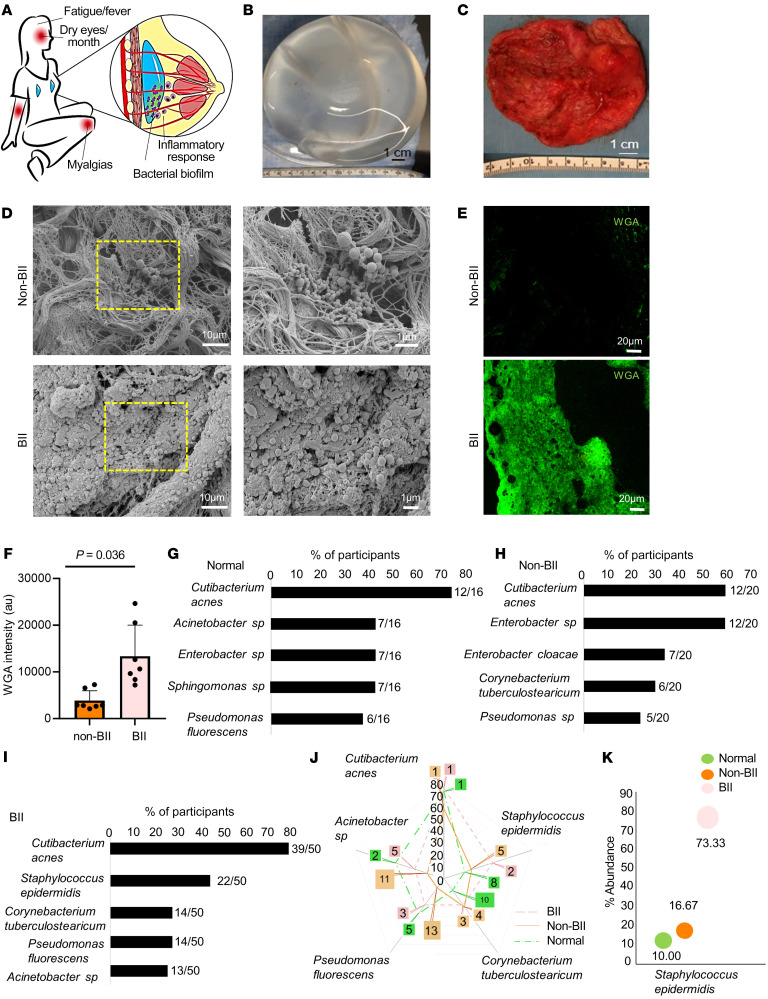
Figure 1 Bacterial biofilm in implants is associated with BII. (A) Schematic presentation of the bacterial biofilm association with BII. (B) Breast implant isolated from a participant. (C) Capsule associated with breast implant of the participant shown in panel B. (D) Increased abundance of bacterial biofilm from the implant-associated capsule of BII compared with non-BII implant-associated capsules as determined through scanning electron microscopy. Zoomed insets of region of interest (ROI) are shown by the dotted yellow square. n = 10 (non-BII), n = 25 (BII) participants. (E) Increased abundance of bacterial biofilm as measured through WGA assay in the capsules of BII participants compared with the non-BII capsules. (F) Quantification of biofilm aggregates using WGA staining. Data presented as mean ± SEM, n = 7 (non-BII), n = 7 (BII) participants. t test was used for analysis of BII versus non-BII (P = 0.0036). (G–I) 16S rRNA NGS-based bacterial typing from the breast tissues of participants with G, normal; H, non-BII; and I, BII tissues. Top 5 bacterial species in each group represented. Fraction of participant samples associated with a bacterial species is provided in parenthesis n = 16 (normal), n = 20 (non-BII), n = 50 (BII). (J) Spider-plot depicting the ranking of the top 5 bacterial infection types in the BII group compared to their ranking in the non-BII and normal groups. The intersection of the group lines with the spikes of the spider-plot indicates the proportion of these infections by groups. The call out numbers are the ranks for each of these infections within each group. n = 16 (normal), n = 20 (non-BII), n = 50 (BII). (K) Increased abundance of biofilm forming Staphylococcus epidermidis in implant-associated breast tissues of participants with BII. Bubble plot indicating the percentage of patients with Staphylococcus epidermidis provided above the individual bars. The bubble percentage indicates the likelihood of a participant with S. epidermidis biofilm in each of the 3 groups. n = 16 (normal), n = 20 (non-BII), n = 50 (BII) participants.
Figure 1 Bacterial biofilm in implants is associated with BII. (A) Schematic presentation of the bacterial biofilm association with BII. (B) Breast implant isolated from a participant. (C) Capsule associated with breast implant of the participant shown in panel B. (D) Increased abundance of bacterial biofilm from the implant-associated capsule of BII compared with non-BII implant-associated capsules as determined through scanning electron microscopy. Zoomed insets of region of interest (ROI) are shown by the dotted yellow square. n = 10 (non-BII), n = 25 (BII) participants. (E) Increased abundance of bacterial biofilm as measured through WGA assay in the capsules of BII participants compared with the non-BII capsules. (F) Quantification of biofilm aggregates using WGA staining. Data presented as mean ± SEM, n = 7 (non-BII), n = 7 (BII) participants. t test was used for analysis of BII versus non-BII (P = 0.0036). (G–I) 16S rRNA NGS-based bacterial typing from the breast tissues of participants with G, normal; H, non-BII; and I, BII tissues. Top 5 bacterial species in each group represented. Fraction of participant samples associated with a bacterial species is provided in parenthesis n = 16 (normal), n = 20 (non-BII), n = 50 (BII). (J) Spider-plot depicting the ranking of the top 5 bacterial infection types in the BII group compared to their ranking in the non-BII and normal groups. The intersection of the group lines with the spikes of the spider-plot indicates the proportion of these infections by groups. The call out numbers are the ranks for each of these infections within each group. n = 16 (normal), n = 20 (non-BII), n = 50 (BII). (K) Increased abundance of biofilm forming Staphylococcus epidermidis in implant-associated breast tissues of participants with BII. Bubble plot indicating the percentage of patients with Staphylococcus epidermidis provided above the individual bars. The bubble percentage indicates the likelihood of a participant with S. epidermidis biofilm in each of the 3 groups. n = 16 (normal), n = 20 (non-BII), n = 50 (BII) participants.CC BY · PubMed Central
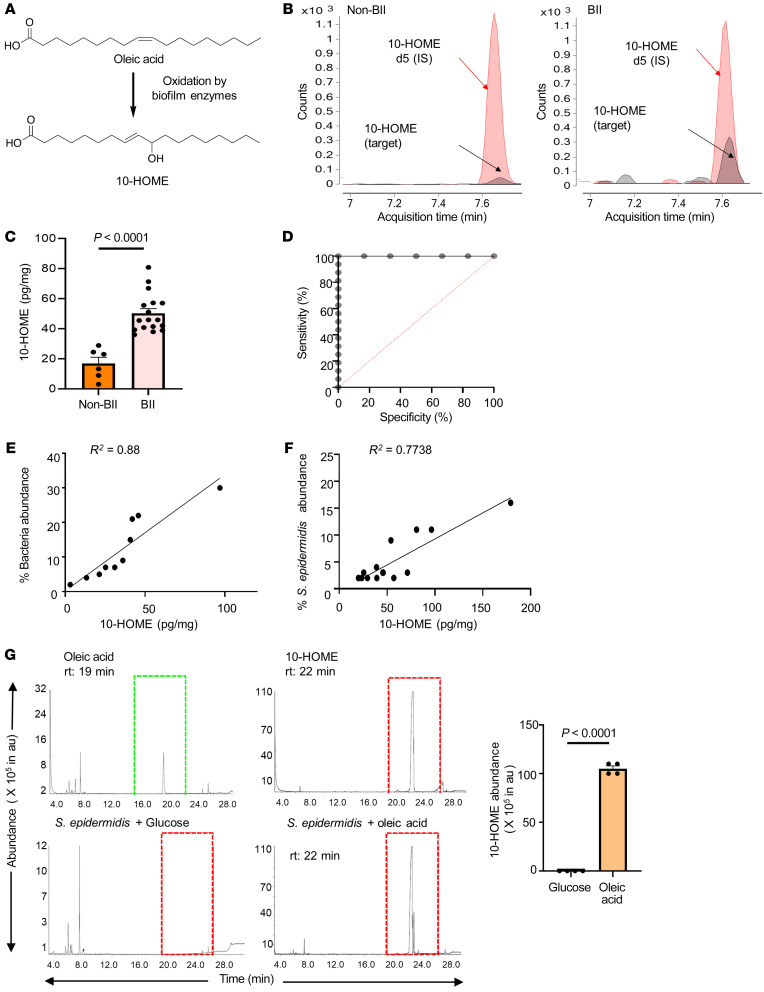
Figure 2 Increased abundance of biofilm-derived 10-HOME in participants with BII. (A) Schematic of formation of 10-HOME from oleic acid. (B–D). Increased abundance of 10-HOME in implant-associated tissue of participants with BII. (B) Chromatograms of 10-HOME from non-BII and BII tissues using LC-MS/MS targeted analyses. (C) Data presented as mean ± SEM, n = 6 (non-BII), n = 17 (BII), t test was used to determine BII versus non-BII (P < 0.0001). (D) Receiver operating characteristic (ROC) curve analysis to determine specificity and sensitivity of 10-HOME detection. (E) Increased abundance of bacteria associated with 10-HOME detected from the implant-associated tissue of participants with BII. (F) Increased abundance of Staphylococcus epidermidis associated with 10-HOME detected from the implant-associated tissue of participants with BII. (G) Synthesis of 10-HOME by S. epidermidis in vitro upon using oleic acid as carbon source. Gas chromatography-mass spectrometry analyses for detection of 10-HOME derivatized both as trimethylsilyl ethers and methyl estersoleic acid standard, 10-HOME standard, S. epidermidis with glucose as carbon source, S. epidermidis with oleic acid as carbon source, quantification of 10-HOME abundance. n = 4. t test was used to determine glucose versus oleic acid (P < 0.0001).
Figure 2 Increased abundance of biofilm-derived 10-HOME in participants with BII. (A) Schematic of formation of 10-HOME from oleic acid. (B–D). Increased abundance of 10-HOME in implant-associated tissue of participants with BII. (B) Chromatograms of 10-HOME from non-BII and BII tissues using LC-MS/MS targeted analyses. (C) Data presented as mean ± SEM, n = 6 (non-BII), n = 17 (BII), t test was used to determine BII versus non-BII (P < 0.0001). (D) Receiver operating characteristic (ROC) curve analysis to determine specificity and sensitivity of 10-HOME detection. (E) Increased abundance of bacteria associated with 10-HOME detected from the implant-associated tissue of participants with BII. (F) Increased abundance of Staphylococcus epidermidis associated with 10-HOME detected from the implant-associated tissue of participants with BII. (G) Synthesis of 10-HOME by S. epidermidis in vitro upon using oleic acid as carbon source. Gas chromatography-mass spectrometry analyses for detection of 10-HOME derivatized both as trimethylsilyl ethers and methyl estersoleic acid standard, 10-HOME standard, S. epidermidis with glucose as carbon source, S. epidermidis with oleic acid as carbon source, quantification of 10-HOME abundance. n = 4. t test was used to determine glucose versus oleic acid (P < 0.0001).CC BY · PubMed Central
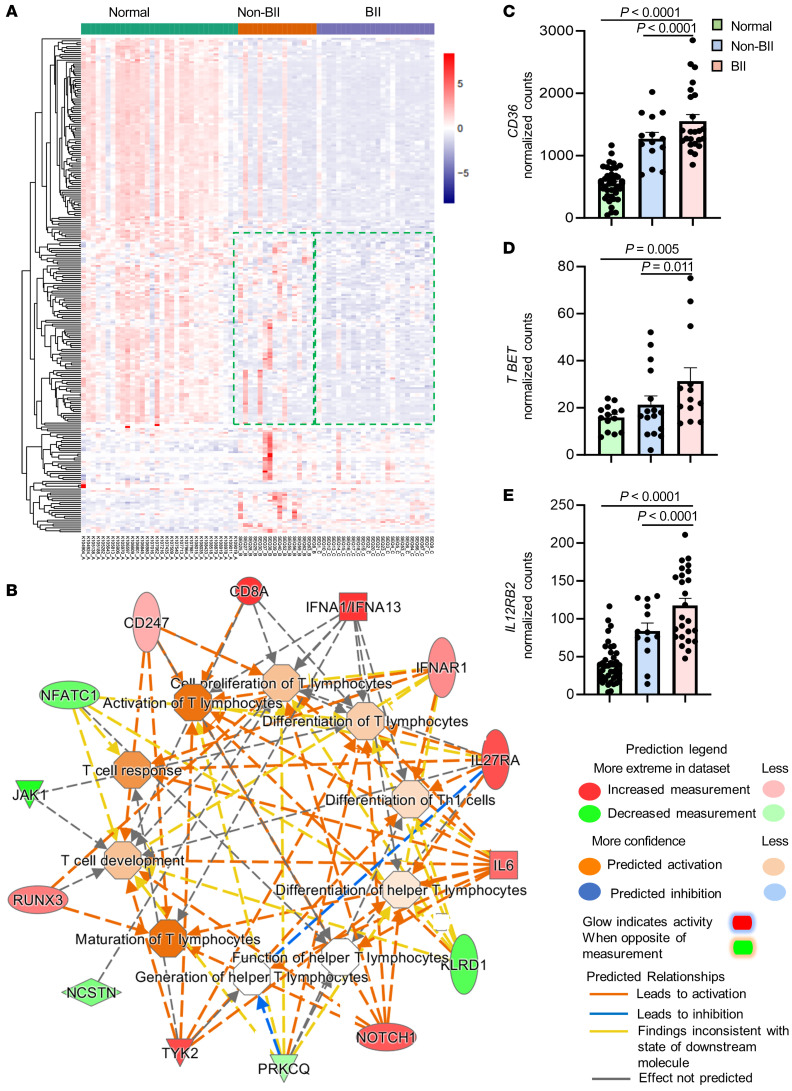
Figure 3 Comparative transcriptomic and molecular pathway analyses of participants with BII. (A) Hierarchical clustering of genes with at least 2-fold change and controlled by FDR of 0.05 breast tissue from participants in the normal (n = 34), non-BII (n = 16), and BII (n = 24) groups. (B) Gene interaction networks for functions related to differentiation of T-lymphocytes, differentiation of Th1 cells, cell proliferation of T-lymphocytes, maturation of T-lymphocytes, generation of T-helper lymphocytes, differentiation of helper T-lymphocytes, T cell response, T cell development, and quantity of T-lymphocytes in BII specimens. Represented functional networks relevant to the set of imported genes generated by the canonical pathway function relevant to Th1 pathway. The list was selected from the hierarchical cluster of Th1 genes; upregulated genes are shown in red and downregulated in green. The intensity of red and green corresponds to an increase and decrease, respectively, in log2 fold change. (C) Comparison of normalized RNA-Seq counts for CD36 between samples from normal, non-BII, and BII groups. In an age-adjusted nonparametric regression model, compared with participants in the normal group, normalized number of CD36 counts was approximately 1,116 units higher in the BII group (P < 0.0001) and 650 units higher in the non-BII group (P < 0.0001). (D) Comparison of normalized RNA-Seq counts for Th1 gene T-BET (TBX21) between normal, non-BII, and BII samples. In an age-adjusted nonparametric regression model, compared with participants in the normal group, the normalized number of T-BET counts was approximately 18 units higher in the BII group (P = 0.005) and 11 units higher in the non-BII group (P = 0.011). (E) Comparison of normalized RNA-Seq counts for Th1 gene IL12RB2 between normal, non-BII, and BII samples. In an age-adjusted nonparametric regression model, compared with participants in the normal group, the normalized number of IL12RB2 counts was approximately 84 units higher in the BII group (P < 0.0001) and 45 units higher in the non-BII group (P < 0.0001).
Figure 3 Comparative transcriptomic and molecular pathway analyses of participants with BII. (A) Hierarchical clustering of genes with at least 2-fold change and controlled by FDR of 0.05 breast tissue from participants in the normal (n = 34), non-BII (n = 16), and BII (n = 24) groups. (B) Gene interaction networks for functions related to differentiation of T-lymphocytes, differentiation of Th1 cells, cell proliferation of T-lymphocytes, maturation of T-lymphocytes, generation of T-helper lymphocytes, differentiation of helper T-lymphocytes, T cell response, T cell development, and quantity of T-lymphocytes in BII specimens. Represented functional networks relevant to the set of imported genes generated by the canonical pathway function relevant to Th1 pathway. The list was selected from the hierarchical cluster of Th1 genes; upregulated genes are shown in red and downregulated in green. The intensity of red and green corresponds to an increase and decrease, respectively, in log2 fold change. (C) Comparison of normalized RNA-Seq counts for CD36 between samples from normal, non-BII, and BII groups. In an age-adjusted nonparametric regression model, compared with participants in the normal group, normalized number of CD36 counts was approximately 1,116 units higher in the BII group (P < 0.0001) and 650 units higher in the non-BII group (P < 0.0001). (D) Comparison of normalized RNA-Seq counts for Th1 gene T-BET (TBX21) between normal, non-BII, and BII samples. In an age-adjusted nonparametric regression model, compared with participants in the normal group, the normalized number of T-BET counts was approximately 18 units higher in the BII group (P = 0.005) and 11 units higher in the non-BII group (P = 0.011). (E) Comparison of normalized RNA-Seq counts for Th1 gene IL12RB2 between normal, non-BII, and BII samples. In an age-adjusted nonparametric regression model, compared with participants in the normal group, the normalized number of IL12RB2 counts was approximately 84 units higher in the BII group (P < 0.0001) and 45 units higher in the non-BII group (P < 0.0001).CC BY · PubMed Central
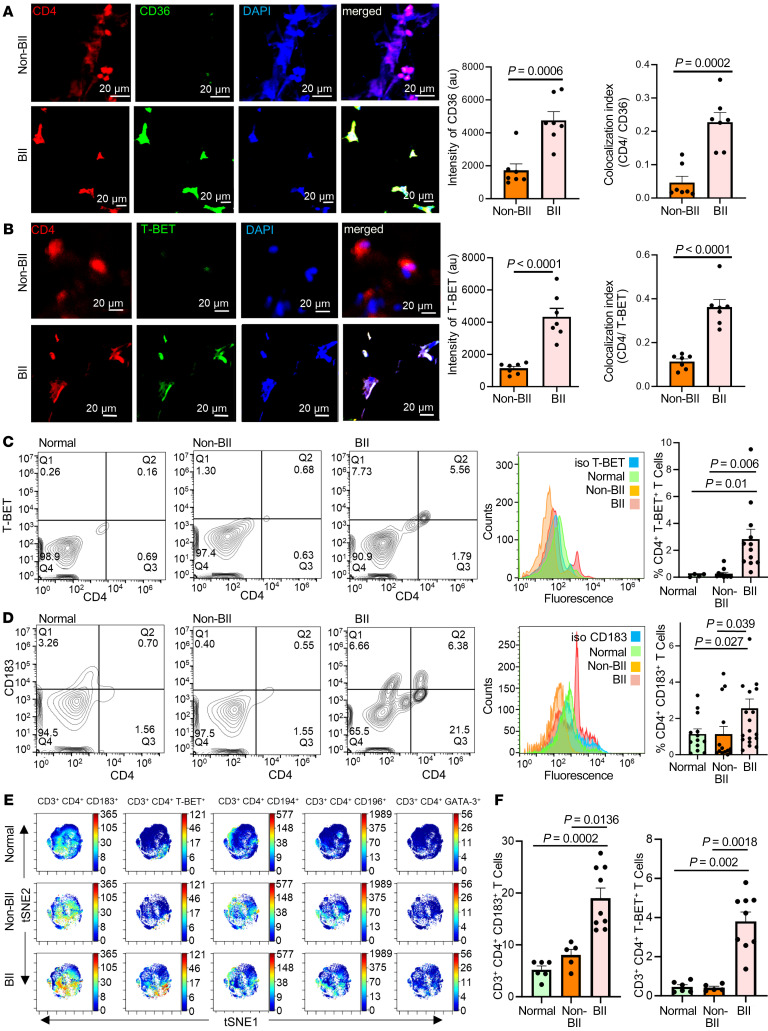
Figure 4 Abundance of CD4+ Th1 cells in implant-associated tissue of participants with BII. (A) Increased expression of CD36 in breast tissue associated with participants with BII, immunostained with anti-CD4 (red), anti-CD36 (green), and DAPI (blue). Data presented as mean ± SEM, (n = 7). Scale bar: 20 μm. A t test was used to determine BII versus non-BII intensity (P = 0.0006), colocalization (P = 0.0002). (B) Increased expression of T-BET in breast tissue associated with participants with BII, immunostained with anti-CD4 (red), anti-T-BET (green), and DAPI (blue). Data presented as mean ± SEM, (n = 7). Scale bar: 20 μm. A t test was used to determine BII versus non-BII Intensity (P < 0.0001) and colocalization (P < 0.0001). (C) Flow cytometry with anti-CD4 (FITC) and anti-TBET (PE). Representative plots: normal, BII, histogram with isotype control for T-BET. Data presented as mean ± SEM, n = 4 (normal), n = 11 (non-BII), and n = 12 (BII). Bivariate Kruskal-Wallis with posthoc Benjamini-Hochberg adjusted pairwise comparison analysis was used to compare BII versus normal (P = 0.01) and BII versus non-BII (P = 0.006). (D) Elevated Th1 subtype in the peripheral blood of participants with BII. Flow cytometry analyses peripheral blood of participants stained with anti-CD4 (FITC) and anti-CD183 (PE). Representative flow plots: normal, non-BII, BII, histogram with isotype control for CD183. Data presented as mean ± SEM, n = 13 (normal), n = 14 (non-BII), n = 20 (BII). Bivariate Kruskal-Wallis with posthoc Benjamini-Hochberg adjusted pairwise comparison analysis was used to determine BII versus normal (P = 0.027) and BII versus non-BII (P = 0.039). (E) Representative viSNE plots for CD3+ CD4+ T cells. Color depicts the intensity of the marker labeled on arcsinh scales from blue (low) to red (high). The analyses indicated elevated Th1 subtype in the peripheral blood of participants with BII. (F) Quantification of median marker expression using CytoBank software for panel E, CD183 and T-BET, n = 6 (normal), n = 5 (non-BII), and n = 9 (BII). Bivariate Kruskal-Wallis with posthoc Benjamini-Hochberg adjusted pairwise comparison analysis were used for analyses. For CD183, BII versus normal (P = 0.0002); BII versus non-BII (P = 0.0136); for T-BET, BII versus normal (P = 0.002); BII versus non-BII (P = 0.0018). The quantification of the remainder of viSNE plots is in Supplemental Figure 15.
Figure 4 Abundance of CD4+ Th1 cells in implant-associated tissue of participants with BII. (A) Increased expression of CD36 in breast tissue associated with participants with BII, immunostained with anti-CD4 (red), anti-CD36 (green), and DAPI (blue). Data presented as mean ± SEM, (n = 7). Scale bar: 20 μm. A t test was used to determine BII versus non-BII intensity (P = 0.0006), colocalization (P = 0.0002). (B) Increased expression of T-BET in breast tissue associated with participants with BII, immunostained with anti-CD4 (red), anti-T-BET (green), and DAPI (blue). Data presented as mean ± SEM, (n = 7). Scale bar: 20 μm. A t test was used to determine BII versus non-BII Intensity (P < 0.0001) and colocalization (P < 0.0001). (C) Flow cytometry with anti-CD4 (FITC) and anti-TBET (PE). Representative plots: normal, BII, histogram with isotype control for T-BET. Data presented as mean ± SEM, n = 4 (normal), n = 11 (non-BII), and n = 12 (BII). Bivariate Kruskal-Wallis with posthoc Benjamini-Hochberg adjusted pairwise comparison analysis was used to compare BII versus normal (P = 0.01) and BII versus non-BII (P = 0.006). (D) Elevated Th1 subtype in the peripheral blood of participants with BII. Flow cytometry analyses peripheral blood of participants stained with anti-CD4 (FITC) and anti-CD183 (PE). Representative flow plots: normal, non-BII, BII, histogram with isotype control for CD183. Data presented as mean ± SEM, n = 13 (normal), n = 14 (non-BII), n = 20 (BII). Bivariate Kruskal-Wallis with posthoc Benjamini-Hochberg adjusted pairwise comparison analysis was used to determine BII versus normal (P = 0.027) and BII versus non-BII (P = 0.039). (E) Representative viSNE plots for CD3+ CD4+ T cells. Color depicts the intensity of the marker labeled on arcsinh scales from blue (low) to red (high). The analyses indicated elevated Th1 subtype in the peripheral blood of participants with BII. (F) Quantification of median marker expression using CytoBank software for panel E, CD183 and T-BET, n = 6 (normal), n = 5 (non-BII), and n = 9 (BII). Bivariate Kruskal-Wallis with posthoc Benjamini-Hochberg adjusted pairwise comparison analysis were used for analyses. For CD183, BII versus normal (P = 0.0002); BII versus non-BII (P = 0.0136); for T-BET, BII versus normal (P = 0.002); BII versus non-BII (P = 0.0018). The quantification of the remainder of viSNE plots is in Supplemental Figure 15.CC BY · PubMed Central
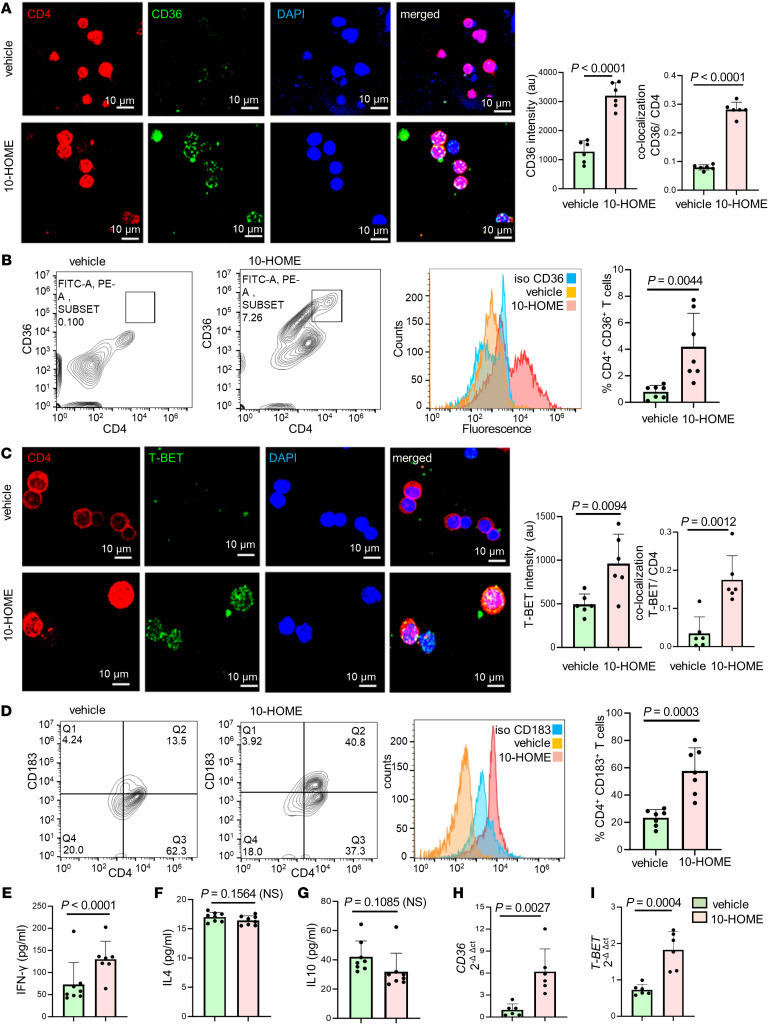
Figure 5 Oxylipin 10-HOME polarizes naive CD4+ T cells to Th1 subtype in vitro. (A) Increased expression of CD36 in naive CD4+ T cells treated with 10-HOME immunostained with anti-CD4 (red), anti-CD36 (green), and DAPI (blue). We quantified the fluorescent intensity of CD36. Colocalization of CD4 and CD36 depicted increased abundance of CD4+ CD36+ cells. Data presented as mean ± SD, (n = 6). Scale bar: 10 μm. A t test was used to determine vehicle versus 10-HOME, intensity (P < 0.0001), colocalization (P < 0.0001). (B) We found elevated CD36 in the 10-HOME treated naive T cells. Flow cytometry analyses of treated cells stained with anti-CD4 (FITC) and anti-CD36 (APC). Representative plots: vehicle, 10-HOME-treated cells, histograms with isotype control for CD36. Data presented as mean ± SD, (n = 7). t test was used to determine vehicle versus 10-HOME(P = 0.0044). (C) Increased expression of T-BET in the 10-HOME–treated naive CD4+ T cells immunostained with anti-CD4 (red), anti-TBET (green), and DAPI (blue). We quantified the fluorescent intensity of TBET. Colocalization of CD4 and TBET depicted increased abundance of CD4+ TBET+ cells. Data presented as mean ± SD, (n = 6). Scale bar: 10 μm. A t test was used to determine vehicle versus 10-HOME intensity (P = 0.0094) and colocalization(P = 0.0012). (D) Elevated Th1 subtype (CD183+) in the 10-HOME–treated naive CD4+ T cells. Flow cytometry analyses with anti-CD4 (FITC) and anti-CD183 (PE). Representative plots: vehicle-treated, 10-HOME–treated cells, and histograms of cells with isotype control for CD183. Data presented as mean ± SD, (n = 7). t test was used to determine vehicle versus 10-HOME Intensity (P = 0.0094) and colocalization (P = 0.0003). (E) Increased expression of IFN-γ in the 10-HOME–treated naive CD4+ T cells as measured through ELISA. Data presented as mean ± SD (n = 7). t test was used to determine vehicle versus 10-HOME Intensity (P = 0.0094), colocalization(P < 0.0001). (F and G) There was no significant change in IL4 and IL10 following 10-HOME treatment of naive CD4+ T cells. Data presented as mean ± SD, (n = 8). t test was used to determine vehicle versus 10-HOME, 1L4 (P = 0.1564), IL10 (P = 0.1085). (H and I) Increased expression of (H) CD36 and (I) T-BET in 10-HOME–treated naive T cells. Data presented as mean ± SD, (n = 6). t test was used to determine vehicle versus 10-HOME CD36 (P = 0.0027) and T-BET (P = 0.0004).
Figure 5 Oxylipin 10-HOME polarizes naive CD4+ T cells to Th1 subtype in vitro. (A) Increased expression of CD36 in naive CD4+ T cells treated with 10-HOME immunostained with anti-CD4 (red), anti-CD36 (green), and DAPI (blue). We quantified the fluorescent intensity of CD36. Colocalization of CD4 and CD36 depicted increased abundance of CD4+ CD36+ cells. Data presented as mean ± SD, (n = 6). Scale bar: 10 μm. A t test was used to determine vehicle versus 10-HOME, intensity (P < 0.0001), colocalization (P < 0.0001). (B) We found elevated CD36 in the 10-HOME treated naive T cells. Flow cytometry analyses of treated cells stained with anti-CD4 (FITC) and anti-CD36 (APC). Representative plots: vehicle, 10-HOME-treated cells, histograms with isotype control for CD36. Data presented as mean ± SD, (n = 7). t test was used to determine vehicle versus 10-HOME(P = 0.0044). (C) Increased expression of T-BET in the 10-HOME–treated naive CD4+ T cells immunostained with anti-CD4 (red), anti-TBET (green), and DAPI (blue). We quantified the fluorescent intensity of TBET. Colocalization of CD4 and TBET depicted increased abundance of CD4+ TBET+ cells. Data presented as mean ± SD, (n = 6). Scale bar: 10 μm. A t test was used to determine vehicle versus 10-HOME intensity (P = 0.0094) and colocalization(P = 0.0012). (D) Elevated Th1 subtype (CD183+) in the 10-HOME–treated naive CD4+ T cells. Flow cytometry analyses with anti-CD4 (FITC) and anti-CD183 (PE). Representative plots: vehicle-treated, 10-HOME–treated cells, and histograms of cells with isotype control for CD183. Data presented as mean ± SD, (n = 7). t test was used to determine vehicle versus 10-HOME Intensity (P = 0.0094) and colocalization (P = 0.0003). (E) Increased expression of IFN-γ in the 10-HOME–treated naive CD4+ T cells as measured through ELISA. Data presented as mean ± SD (n = 7). t test was used to determine vehicle versus 10-HOME Intensity (P = 0.0094), colocalization(P < 0.0001). (F and G) There was no significant change in IL4 and IL10 following 10-HOME treatment of naive CD4+ T cells. Data presented as mean ± SD, (n = 8). t test was used to determine vehicle versus 10-HOME, 1L4 (P = 0.1564), IL10 (P = 0.1085). (H and I) Increased expression of (H) CD36 and (I) T-BET in 10-HOME–treated naive T cells. Data presented as mean ± SD, (n = 6). t test was used to determine vehicle versus 10-HOME CD36 (P = 0.0027) and T-BET (P = 0.0004).CC BY · PubMed Central
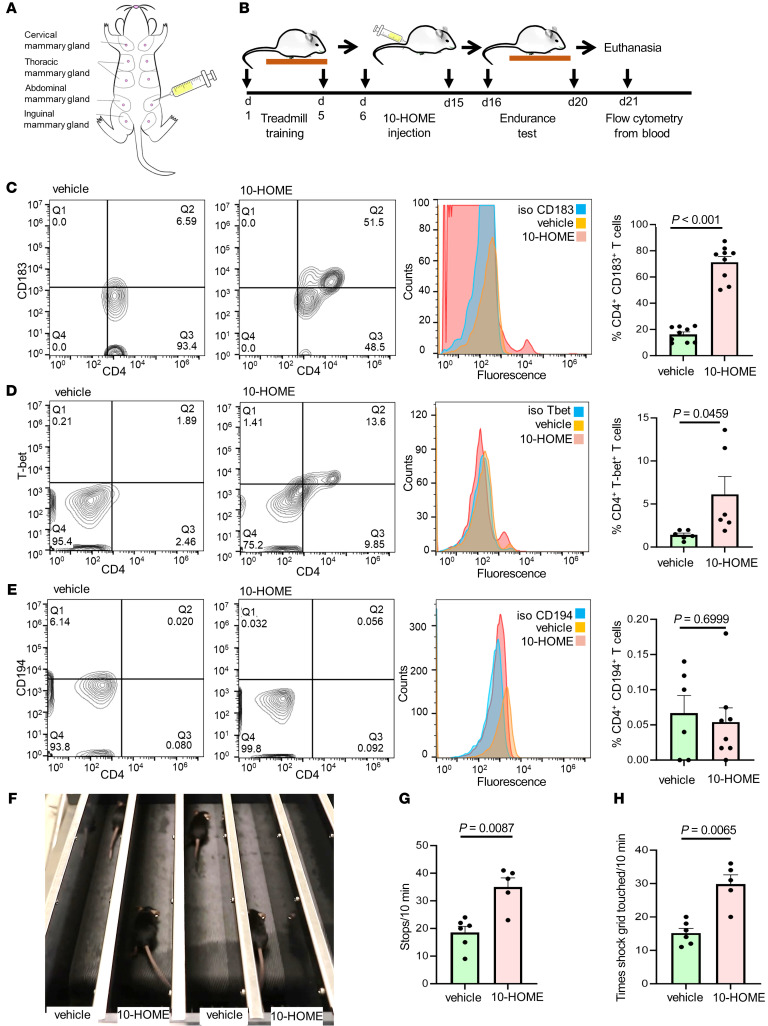
Figure 6 Elevated CD4+ Th1 and fatigue-like symptoms in mice administered with 10-HOME. (A) Schematic representation of injection of 10-HOME in the abdominal mammary fat pad of mice. (B) Timeline of 10-HOME administration in mice. (C) Elevated CD4+ Th1 subtype in the blood of mice injected with 10-HOME. Flow cytometry analyses of blood of mice stained with anti-CD4 (FITC) and anti-CD183 (PE). Representative flow plots: vehicle-treated, 10-HOME-treated, and histograms with isotype control for CD183. Data presented as mean ± SEM, vehicle (n = 9) and 10-HOME (n = 9) –treated mice. Wilcoxon-Rank test analysis was used to determine vehicle versus 10-HOME (P < 0.001). (D) Elevated CD4+ Th1 subtype in the blood of mice injected with 10-HOME. Flow cytometry analyses of blood of mice stained with anti-CD4 (FITC) and anti-Tbet (PE). Representative flow plots: vehicle-treated and 10-HOME–treated histograms with isotype control for T-bet. Data presented as mean ± SEM, vehicle (n = 6) and 10-HOME (n = 6) mice. t test was used to determine vehicle versus 10-HOME (P = 0.0459). (E) Unaltered CD4+ Th2 subtype in the blood of mice injected with 10-HOME. Flow cytometry analyses of blood of mice stained with anti-CD4 (FITC) and anti-CD194 (PE). Representative flow plots: vehicle-treated and 10-HOME–treated histograms with isotype control for CD194. Data presented as mean ± SEM, vehicle (n = 6) and 10-HOME (n = 8) –treated mice. t test was used to determine vehicle versus 10-HOME (P = 0.6999). (F) Representative image of murine endurance test after 10-HOME administration. Video provided as Supplemental Video 1. (G) Increased stops exhibited by 10-HOME administered mice compared with those treated with vehicle. Data presented as mean ± SEM, vehicle (n = 6) and 10-HOME (n = 5) –treated mice. Mann-Whitney U test with a Bonferroni correction was performed (P = 0.0087). (H) Increased aversive stimulation (shock grid touching) exhibited by mice administered 10-HOME compared with those treated with vehicle. Data presented as mean ± SEM, vehicle (n = 6) and 10-HOME (n = 5) –treated mice. Mann-Whitney U test with a Bonferroni correction was performed (P = 0.0065).
Figure 6 Elevated CD4+ Th1 and fatigue-like symptoms in mice administered with 10-HOME. (A) Schematic representation of injection of 10-HOME in the abdominal mammary fat pad of mice. (B) Timeline of 10-HOME administration in mice. (C) Elevated CD4+ Th1 subtype in the blood of mice injected with 10-HOME. Flow cytometry analyses of blood of mice stained with anti-CD4 (FITC) and anti-CD183 (PE). Representative flow plots: vehicle-treated, 10-HOME-treated, and histograms with isotype control for CD183. Data presented as mean ± SEM, vehicle (n = 9) and 10-HOME (n = 9) –treated mice. Wilcoxon-Rank test analysis was used to determine vehicle versus 10-HOME (P < 0.001). (D) Elevated CD4+ Th1 subtype in the blood of mice injected with 10-HOME. Flow cytometry analyses of blood of mice stained with anti-CD4 (FITC) and anti-Tbet (PE). Representative flow plots: vehicle-treated and 10-HOME–treated histograms with isotype control for T-bet. Data presented as mean ± SEM, vehicle (n = 6) and 10-HOME (n = 6) mice. t test was used to determine vehicle versus 10-HOME (P = 0.0459). (E) Unaltered CD4+ Th2 subtype in the blood of mice injected with 10-HOME. Flow cytometry analyses of blood of mice stained with anti-CD4 (FITC) and anti-CD194 (PE). Representative flow plots: vehicle-treated and 10-HOME–treated histograms with isotype control for CD194. Data presented as mean ± SEM, vehicle (n = 6) and 10-HOME (n = 8) –treated mice. t test was used to determine vehicle versus 10-HOME (P = 0.6999). (F) Representative image of murine endurance test after 10-HOME administration. Video provided as Supplemental Video 1. (G) Increased stops exhibited by 10-HOME administered mice compared with those treated with vehicle. Data presented as mean ± SEM, vehicle (n = 6) and 10-HOME (n = 5) –treated mice. Mann-Whitney U test with a Bonferroni correction was performed (P = 0.0087). (H) Increased aversive stimulation (shock grid touching) exhibited by mice administered 10-HOME compared with those treated with vehicle. Data presented as mean ± SEM, vehicle (n = 6) and 10-HOME (n = 5) –treated mice. Mann-Whitney U test with a Bonferroni correction was performed (P = 0.0065).CC BY · PubMed Central
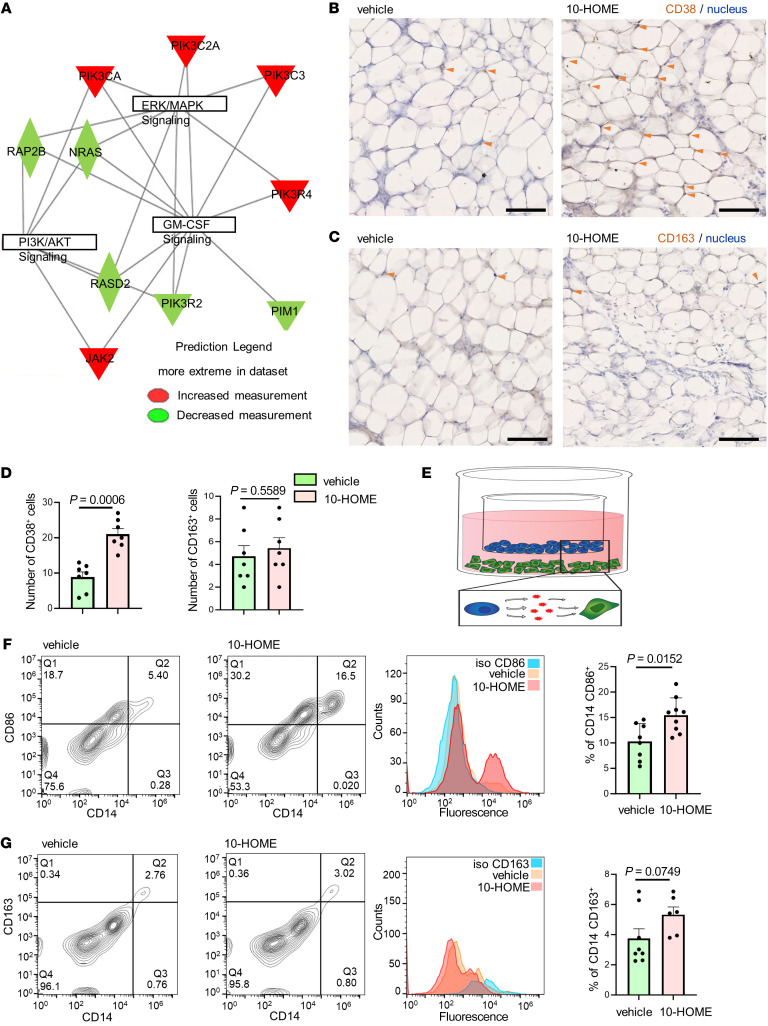
Figure 7 CD4+ T cells in reaction with 10-HOME polarize macrophages to M1 phenotype. (A) Gene interaction networks from human bulk RNA-Seq. Upregulated genes in red and downregulated are in green, in log2 fold change. Table exhibited in Supplemental Figure 21A. (B) Increased expression of CD38 (M1 macrophage marker) in 10-HOME–treated mice compared with vehicle. Murine mammary fat pads stained with anti-CD38 antibody (DAB) and nucleus (hematoxylin). The cells in adipose tissues are bordered by adipose cells. Cells coexpressing DAB and hematoxylin were considered for analysis (arrows). Data presented as mean ± SEM, vehicle (n = 7) and 10-HOME (n = 7) mice. Scale bar: 100μm. Enlarged image in Supplemental Figure 22. (C) No significant difference of CD163 (M2 macrophage marker) in 10-HOME treated mice. Murine mammary fat pads stained with anti-CD38 antibody (DAB). Cells co-expressing DAB and hematoxylin were considered for analysis (arrows). Data presented as mean ± SEM, vehicle (n = 7) and 10-HOME (n = 7) mice. Scale bar: 100μm. Enlarged image in Supplemental Figure 23. (D) Quantification of B–C. Total number of CD38+ and CD163+ cells were calculated. Data presented as mean ± SEM, (n = 7). Mann Whitney test was used to determine vehicle versus 10-HOME CD38 (P = 0.0006) and CD163 (P = 0.558). (E) Schematic representation of macrophage/T cell transwell assay. PBMC-derived naive T cells treated with 10-HOME (blue), PBMC-derived M0 macrophages (green). (F) Increased polarization to M1 phenotype (CD86-human M1 marker) in the transwell coculture of PBMC-derived M0 macrophages incubated with10-HOME–treated naive CD4+ T cells. Flow cytometry analyses with anti-CD86 (FITC) and anti-CD14 (PE). Representative plots: vehicle treated and 10-HOME treated, histograms of cells with isotype control for CD86. Data presented as mean ± SD, (n = 8). Mann Whitney test was used for comparison of vehicle versus 10-HOME (P = 0.0152). (G) Unaltered M2 phenotype(CD163). Flow cytometry analyses with anti-CD163 (APC) and anti-CD14 (PE). Representative plots, vehicle treated and 10-HOME-treated, histograms with isotype control for CD163. Data presented as mean ± SD, (n = 8). Mann Whitney test was used to determine vehicle versus 10-HOME (P = 0.0749).
Figure 7 CD4+ T cells in reaction with 10-HOME polarize macrophages to M1 phenotype. (A) Gene interaction networks from human bulk RNA-Seq. Upregulated genes in red and downregulated are in green, in log2 fold change. Table exhibited in Supplemental Figure 21A. (B) Increased expression of CD38 (M1 macrophage marker) in 10-HOME–treated mice compared with vehicle. Murine mammary fat pads stained with anti-CD38 antibody (DAB) and nucleus (hematoxylin). The cells in adipose tissues are bordered by adipose cells. Cells coexpressing DAB and hematoxylin were considered for analysis (arrows). Data presented as mean ± SEM, vehicle (n = 7) and 10-HOME (n = 7) mice. Scale bar: 100μm. Enlarged image in Supplemental Figure 22. (C) No significant difference of CD163 (M2 macrophage marker) in 10-HOME treated mice. Murine mammary fat pads stained with anti-CD38 antibody (DAB). Cells co-expressing DAB and hematoxylin were considered for analysis (arrows). Data presented as mean ± SEM, vehicle (n = 7) and 10-HOME (n = 7) mice. Scale bar: 100μm. Enlarged image in Supplemental Figure 23. (D) Quantification of B–C. Total number of CD38+ and CD163+ cells were calculated. Data presented as mean ± SEM, (n = 7). Mann Whitney test was used to determine vehicle versus 10-HOME CD38 (P = 0.0006) and CD163 (P = 0.558). (E) Schematic representation of macrophage/T cell transwell assay. PBMC-derived naive T cells treated with 10-HOME (blue), PBMC-derived M0 macrophages (green). (F) Increased polarization to M1 phenotype (CD86-human M1 marker) in the transwell coculture of PBMC-derived M0 macrophages incubated with10-HOME–treated naive CD4+ T cells. Flow cytometry analyses with anti-CD86 (FITC) and anti-CD14 (PE). Representative plots: vehicle treated and 10-HOME treated, histograms of cells with isotype control for CD86. Data presented as mean ± SD, (n = 8). Mann Whitney test was used for comparison of vehicle versus 10-HOME (P = 0.0152). (G) Unaltered M2 phenotype(CD163). Flow cytometry analyses with anti-CD163 (APC) and anti-CD14 (PE). Representative plots, vehicle treated and 10-HOME-treated, histograms with isotype control for CD163. Data presented as mean ± SD, (n = 8). Mann Whitney test was used to determine vehicle versus 10-HOME (P = 0.0749).CC BY · PubMed Central

Verification

Claims the paper makes

The claims and statistics of this paper haven’t been checked yet.

Run the check — free, no account needed. It reads the open-access text and checks the sources it cites.

A few free checks a day · papers already verified open instantly · results are public

Claims other papers make about this one

Each is checked against this paper’s own text: does it say what the citing paper says it does?

Self-check

Percentages, sums and reported differences re-computed from the paper’s own numbers.

The self-check needs the paper’s full text.

Citations

Cites

Show all 4 references

Research works printed but not linked: 72

  1. 10.1097/00006534-200101000-00034 · DOI
  2. Maijers, 2013, Women with silicone breast implants and unexplained systemic symptoms: a descriptive cohort study, Neth J Med, 71, 534
  3. 10.7326/M15-1169 · DOI
  4. 10.1097/SLA.0000000000002990 · DOI
  5. 10.1007/s10067-019-04447-y · DOI
  6. 10.1093/ije/dyq164 · DOI
  7. 10.1097/PRS.0000000000003711 · DOI
  8. 10.1093/ije/dyy217 · DOI
  9. 10.1155/2022/8536149 · DOI
  10. 10.1093/asj/sjad098 · DOI
  11. 10.1007/s12026-016-8813-y · DOI
  12. 10.1097/00000637-199707000-00002 · DOI
  13. 10.1136/bmj.39048.332650.DB · DOI
  14. 10.1007/s12026-017-8980-5 · DOI
  15. 10.1016/S1047-2797(97)00212-3 · DOI
  16. 10.1093/aje/154.7.610 · DOI
  17. 10.1080/03009740151095321 · DOI
  18. 10.1615/JLongTermEffMedImplants.v12.i4.40 · DOI
  19. 10.3390/bioengineering10030356 · DOI
  20. 10.1016/j.heliyon.2018.e01067 · DOI
  21. 10.1007/s00238-012-0728-9 · DOI
  22. 10.1016/0190-9622(95)91328-9 · DOI
  23. 10.1097/PAI.0b013e318266476c · DOI
  24. 10.1007/s10549-014-3034-3 · DOI
  25. 10.1016/j.jhin.2017.11.008 · DOI
  26. 10.1016/j.jaad.2008.08.030 · DOI
  27. 10.1111/1346-8138.16288 · DOI
  28. 10.1371/journal.pone.0177365 · DOI
  29. 10.1038/s12276-020-00486-7 · DOI
  30. 10.1002/eji.201040466 · DOI
  31. 10.1084/jem.185.12.2089 · DOI
  32. 10.1126/science.272.5270.1947 · DOI
  33. De Jong, 2014, Fatty acids, lipid mediators, and T-cell function, Front Immunol, 5, 10.3389/fimmu.2014.00483 · DOI
  34. 10.1097/SAP.0000000000000440 · DOI
  35. 10.1111/cmi.13025 · DOI
  36. 10.1073/pnas.0307308101 · DOI
  37. 10.1038/s41564-019-0498-2 · DOI
  38. 10.1007/s00284-008-9226-5 · DOI
  39. 10.1038/ncomms13823 · DOI
  40. Levan SR, et al. Neonatal gut-microbiome-derived 12,13 DiHOME impedes tolerance and promotes childhood atopy and asthma [preprint]. https://doi.org/10.1101/311704 Posted on bioRxiv April 30, 2018 · DOI
  41. 10.1002/ajh.24794 · DOI
  42. 10.3324/haematol.2019.245860 · DOI
  43. 10.1182/bloodadvances.2020002493 · DOI
  44. 10.1084/jem.190.12.1909 · DOI
  45. 10.1097/00000637-199407000-00001 · DOI
  46. 10.1289/ehp.95103s8263 · DOI
  47. 10.1093/ndt/gfh571 · DOI
  48. 10.1097/PRS.0000000000002010 · DOI
  49. 10.1097/SLA.0000000000002504 · DOI
  50. 10.1097/SLA.0000000000003053 · DOI
  51. 10.1097/SLA.0000000000005252 · DOI
  52. 10.1007/s00266-018-1234-7 · DOI
  53. 10.1038/s41522-016-0004-z · DOI
  54. 10.1097/GOX.0000000000002755 · DOI
  55. 10.1016/j.cps.2020.09.006 · DOI
  56. 10.1007/s00266-019-01521-3 · DOI
  57. Metzinger, 2022, Breast implant illness: treatment using total capsulectomy and implant removal, Eplasty, 22
  58. 10.1097/GOX.0000000000003813 · DOI
  59. 10.1128/microbiolspec.VMBF-0001-2014 · DOI
  60. 10.1080/01635589509514403 · DOI
  61. 10.1093/femspd/fty023 · DOI
  62. 10.1016/0167-5699(95)80068-9 · DOI
  63. 10.3389/fimmu.2020.550946 · DOI
  64. 10.1111/jcmm.14415 · DOI
  65. 10.1016/j.celrep.2022.110891 · DOI
  66. 10.1097/MCO.0000000000000929 · DOI
  67. 10.1038/nm872 · DOI
  68. 10.3390/ijms20143580 · DOI
  69. 10.4049/jimmunol.1102474 · DOI
  70. 10.3389/fimmu.2023.1144172 · DOI
  71. 10.3390/jfb14040223 · DOI
  72. 10.3389/fphar.2019.01147 · DOI

Cited by

Sorted by citations

See all 15

Metadata

Authors
Khan, I., Minto, R. E., Kelley-Patteson, C., Singh, K., Timsina, L., Suh, L. J., Rinne, E., Van Natta, B. W., Neumann, C. R., Mohan, G., Lester, M., VonDerHaar, R. J., German, R., Marino, N., Hassanein, A. H., Gordillo, G. M., Kaplan, M. H., Sen, C. K., Kadin, M. E., & Sinha, M.
Venue
Journal of Clinical Investigation
Published
2023-11-30
Volume
134
Issue
3
ISSN
1558-8238
Cited by
15
References
4
Language
en
Funders
  • National Institute of Allergy and Infectious Diseases (R01AI165958, R21AI171932)
  • Plastic Surgery Foundation (831458)
  • National Institute of Nursing Research (NR015676)
  • National Institute of Diabetes and Digestive and Kidney Diseases (R01DK125835)

About these checks

Registry, retraction, Cites and statistics results are computed, not judged, with one exception: a printed reference that no index lists is read once by a model before it counts as a citation error. Claims are extracted by a model and kept only when their quote appears verbatim in the text; each cited source is then checked, with a model’s help, for whether it says what the claim relies on. Those verdicts can be wrong — read the claim’s quote and the cited source before relying on one.

Statistics and arithmetic are recomputed, not judged.

Confidence bands are shown only for fields calibrated on our annotated test set. None is calibrated yet, so no band is shown.

What counts as a claim ›How we measure confidence ›How we check this ›

Are you an author, or do you see a problem with this page? Request a review

How to cite

Cite CoChat for the checks on this page, and the paper for its own findings.

This page
CoChat. (2026). Citation check: Biofilm-derived oxylipin 10-HOME–mediated immune response in women with breast implants. https://app.cochat.ai/papers/10.1172/jci165644
The paper
Khan, I., Minto, R. E., Kelley-Patteson, C., Singh, K., Timsina, L., Suh, L. J., Rinne, E., Van Natta, B. W., Neumann, C. R., Mohan, G., Lester, M., VonDerHaar, R. J., German, R., Marino, N., Hassanein, A. H., Gordillo, G. M., Kaplan, M. H., Sen, C. K., Kadin, M. E., & Sinha, M. (2023). Biofilm-derived oxylipin 10-HOME–mediated immune response in women with breast implants. Journal of Clinical Investigation. https://doi.org/10.1172/jci165644