Cited by 17

The DOI matches its Crossref record.

Protective effects of the notoginsenoside R1 on acute lung injury by regulating the miR-128-2-5p/Tollip signaling pathway in rats with severe acute pancreatitis

He, Ju, Liu, Ming-wei, Wang, Zhi-yi, Shi, Rong-jie·2022·Innate Immunity

Abstract

Notoginsenoside R1 (NG-R1), the extract and the main ingredient of Panax notoginseng, has anti-inflammatory effects and can be used in treating acute lung injury (ALI). In this study, we explored the pulmonary protective effect and the underlying mechanism of the NG-R1 on rats with ALI induced by severe acute pancreatitis (SAP). MiR-128-2-5p, ERK1, Tollip, HMGB1, TLR4, IκB, and NF-κB mRNA expression levels were measured using real-time qPCR, and TLR4, Tollip, HMGB1, IRAK1, MyD88, ERK1, NF-κB65, and P-IκB-α protein expression levels using Western blot. The NF-κB and the TLR4 activities were determined using immunohistochemistry, and TNF-α, IL-6, IL-1β, and ICAM-1 levels in the bronchoalveolar lavage fluid (BALF) using ELISA. Lung histopathological changes were observed in each group. NG-R1 treatment reduced miR-128-2-5p expression in the lung tissue, increased Tollip expression, inhibited HMGB1, TLR4, TRAF6, IRAK1, MyD88, NF-κB65, and p-IκB-α expression levels, suppressed NF-κB65 and the TLR4 expression levels, reduced MPO activity, reduced TNF-α, IL-1β, IL-6, and ICAM-1 levels in BALF, and alleviated SAP-induced ALI. NG-R1 can attenuate SAP-induced ALI. The mechanism of action may be due to a decreased expression of miR-128-2-5p, increased activity of the Tollip signaling pathway, decreased activity of HMGB1/TLR4 and ERK1 signaling pathways, and decreased inflammatory response to SAP-induced ALI. Tollip was the regulatory target of miR-128-2-5p.

Overview

The claims and statistics of this paper haven’t been checked yet.

Run the check — free, no account needed. It reads the open-access text and checks the sources it cites.

A few free checks a day · papers already verified open instantly · results are public

Integrity signals

Registry

Crossref · 10.1177/17534259211068744

Cites

Statistics

Figures

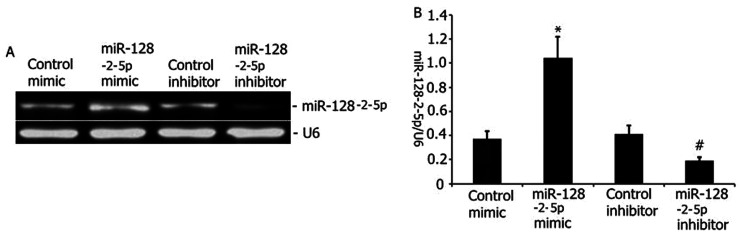
Figure 1. Transfection efficiency of the mimics or inhibitor. MiR-128-2-5p mimics, miR-128-2-5p mimic–NC, miR-128-2-5p inhibitor, and miR-128-2-5p inhibitor–NC were mixed with Lipofectamine 2000 (Invitrogen) and added to the A549 cell culture. The cultures were transfected for 24 h, and the miR-128-2-5p level was measured using qRT-PCR. The data obtained from quantitative densitometry are presented as mean ± SD of three independent experiments. The data from three independent experiments are presented as mean ± SD. *P < 0.05 vs control mimic. #P < 0.05 vs control inhibitor.
Figure 1. Transfection efficiency of the mimics or inhibitor. MiR-128-2-5p mimics, miR-128-2-5p mimic–NC, miR-128-2-5p inhibitor, and miR-128-2-5p inhibitor–NC were mixed with Lipofectamine 2000 (Invitrogen) and added to the A549 cell culture. The cultures were transfected for 24 h, and the miR-128-2-5p level was measured using qRT-PCR. The data obtained from quantitative densitometry are presented as mean ± SD of three independent experiments. The data from three independent experiments are presented as mean ± SD. *P < 0.05 vs control mimic. #P < 0.05 vs control inhibitor.CC BY-NC · PubMed Central
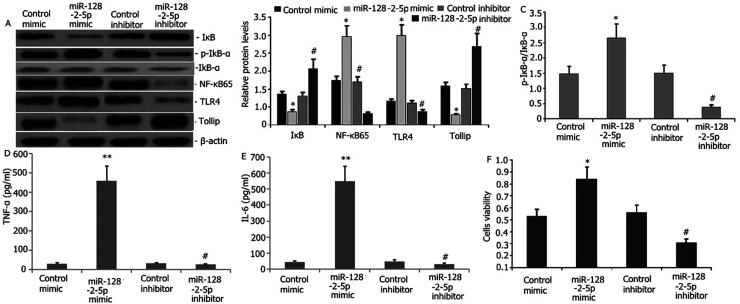
Figure 2. Effect of miR-128-2-5p on the tollip signaling pathway in RAW264.7 macrophages. MiR-128-2-5p mimics, miR-128-2-5p mimic–NC, miR-128-2-5p inhibitor, and miR-128-2-5p inhibitor–NC were mixed with Lipofectamine 2000 (Invitrogen) and added to the cell culture. The cultures were transfected for 24 h. (A–C) Expression levels of NF-κB65, p-IκB-α, TLR4, and Tollip were measured using Western blot. (D–E) IL-6 and TNF-α expression levels in RAW264.7 macrophages were measured using ELISA. (F) The growth inhibition rate was measured using the MTT assay. The data obtained from quantitative densitometry are presented as mean ± SD of three independent experiments. *P < 0.05 vs control mimic. #P < 0.05 vs control inhibitor.
Figure 2. Effect of miR-128-2-5p on the tollip signaling pathway in RAW264.7 macrophages. MiR-128-2-5p mimics, miR-128-2-5p mimic–NC, miR-128-2-5p inhibitor, and miR-128-2-5p inhibitor–NC were mixed with Lipofectamine 2000 (Invitrogen) and added to the cell culture. The cultures were transfected for 24 h. (A–C) Expression levels of NF-κB65, p-IκB-α, TLR4, and Tollip were measured using Western blot. (D–E) IL-6 and TNF-α expression levels in RAW264.7 macrophages were measured using ELISA. (F) The growth inhibition rate was measured using the MTT assay. The data obtained from quantitative densitometry are presented as mean ± SD of three independent experiments. *P < 0.05 vs control mimic. #P < 0.05 vs control inhibitor.CC BY-NC · PubMed Central
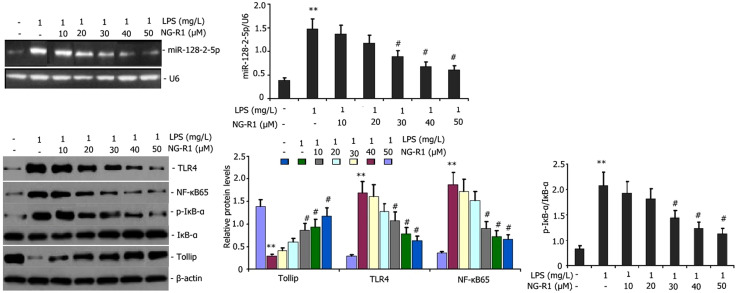
Figure 3. Effect of NG-R1 on miR-128-2-5p and the tollip signaling pathway in RAW264.7 macrophages. RAW264.7 macrophages were incubated with LPS (1 mg/l) and various concentrations of NG-R1 (10, 20, 30, 40, and 50 μM) for 24 h to analyze the effects of NG-R1 on LPS-induced miR-128-2-5p and the Tollip signaling pathway in RAW264.7 macrophages. The miR-128-2-5p expression was measured using qRT-PCR. The expression levels of Tollip, NF-κB65, p-IκB-α, and TLR4 were measured using Western blot. The data obtained from quantitative densitometry are presented as mean ± SD of three independent experiments. **P < 0.01, *P < 0.05 vs blank control group. #P < 0.05 vs LPS group.
Figure 3. Effect of NG-R1 on miR-128-2-5p and the tollip signaling pathway in RAW264.7 macrophages. RAW264.7 macrophages were incubated with LPS (1 mg/l) and various concentrations of NG-R1 (10, 20, 30, 40, and 50 μM) for 24 h to analyze the effects of NG-R1 on LPS-induced miR-128-2-5p and the Tollip signaling pathway in RAW264.7 macrophages. The miR-128-2-5p expression was measured using qRT-PCR. The expression levels of Tollip, NF-κB65, p-IκB-α, and TLR4 were measured using Western blot. The data obtained from quantitative densitometry are presented as mean ± SD of three independent experiments. **P < 0.01, *P < 0.05 vs blank control group. #P < 0.05 vs LPS group.CC BY-NC · PubMed Central
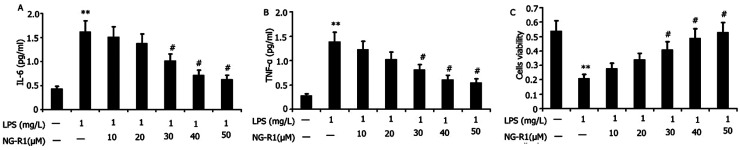
Figure 4. Effect of NG-R1 on cellular inflammation and cell viability of LPS-induced RAW264.7 macrophages. RAW264.7 macrophages were incubated with LPS (1 mg/l) and various concentrations of NG-R1 (10, 20, 30, 40, and 50 μM) for 24 h to analyze the effect of NG-R1 on cellular inflammation and cell viability of LPS-induced RAW264.7 macrophages. IL-6 and TNF-α levels were measured using ELISA. The cell viability was measured using the CCK-8 assay. Data are expressed as mean ± SD of three replicates. **P < 0.01 vs the blank control group; #P < 0.05 vs the LPS group.
Figure 4. Effect of NG-R1 on cellular inflammation and cell viability of LPS-induced RAW264.7 macrophages. RAW264.7 macrophages were incubated with LPS (1 mg/l) and various concentrations of NG-R1 (10, 20, 30, 40, and 50 μM) for 24 h to analyze the effect of NG-R1 on cellular inflammation and cell viability of LPS-induced RAW264.7 macrophages. IL-6 and TNF-α levels were measured using ELISA. The cell viability was measured using the CCK-8 assay. Data are expressed as mean ± SD of three replicates. **P < 0.01 vs the blank control group; #P < 0.05 vs the LPS group.CC BY-NC · PubMed Central
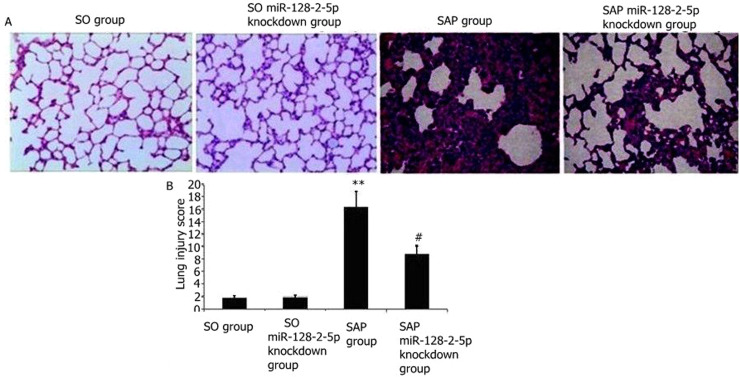
Figure 5. Effect of miR-128-2-5p knockdown on SAP-induced ALI. The miR-128-2-5p-knockdown construct was delivered to rats through intravenous tail administration of anti-miR-128-2-5p oligonucleotides, and SAP-induced ALI was induced through intraperitoneal taurocholate challenge. The rat lungs were histopathologically examined. The lung injury score was measured. (A) Representative images of H&E-stained lung sections from three experimental groups (400 × magnification). (B) Lung injury score. Data are expressed as mean ± SD of three experiments. **P < 0.01 vs SO or SO treatment group; ##P < 0.01 vs SAP group.
Figure 5. Effect of miR-128-2-5p knockdown on SAP-induced ALI. The miR-128-2-5p-knockdown construct was delivered to rats through intravenous tail administration of anti-miR-128-2-5p oligonucleotides, and SAP-induced ALI was induced through intraperitoneal taurocholate challenge. The rat lungs were histopathologically examined. The lung injury score was measured. (A) Representative images of H&E-stained lung sections from three experimental groups (400 × magnification). (B) Lung injury score. Data are expressed as mean ± SD of three experiments. **P < 0.01 vs SO or SO treatment group; ##P < 0.01 vs SAP group.CC BY-NC · PubMed Central
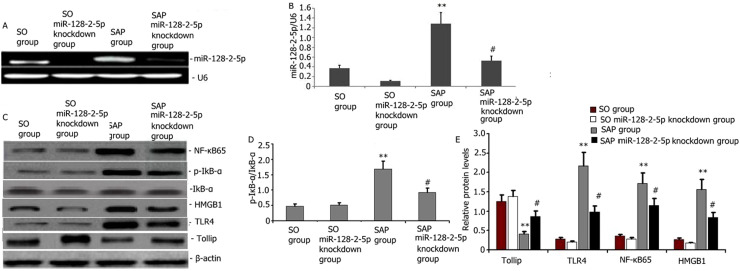
Figure 6. Effect of miR-128-2-5p knockdown on miR-128-2-5p and Tollip/TLR4 signaling pathway in SAP-induced ALI. The miR-128-2-5p-knockdown construct was delivered to rats through intravenous tail administration of anti-miR-128-2-5p oligonucleotides, and SAP-induced ALI was established through intraperitoneal taurocholate challenge. The rat lungs were histopathologically examined. (A–B) Representative qRT-PCR images showing the miR-128-2-5p expression level from four experimental groups. (C–E) Representative Western blots and statistical summary of the densitometric analysis of the expression levels of NF-κB65, p-IκB-α, HMGB1, TLR4, and Tollip in rat lungs with acute pancreatitis at 24 h after administering NG-R1 treatment. Data were expressed as mean ± SD of three experiments. **P < 0.01 vs SO group; #P < 0.05 vs SAP group.
Figure 6. Effect of miR-128-2-5p knockdown on miR-128-2-5p and Tollip/TLR4 signaling pathway in SAP-induced ALI. The miR-128-2-5p-knockdown construct was delivered to rats through intravenous tail administration of anti-miR-128-2-5p oligonucleotides, and SAP-induced ALI was established through intraperitoneal taurocholate challenge. The rat lungs were histopathologically examined. (A–B) Representative qRT-PCR images showing the miR-128-2-5p expression level from four experimental groups. (C–E) Representative Western blots and statistical summary of the densitometric analysis of the expression levels of NF-κB65, p-IκB-α, HMGB1, TLR4, and Tollip in rat lungs with acute pancreatitis at 24 h after administering NG-R1 treatment. Data were expressed as mean ± SD of three experiments. **P < 0.01 vs SO group; #P < 0.05 vs SAP group.CC BY-NC · PubMed Central
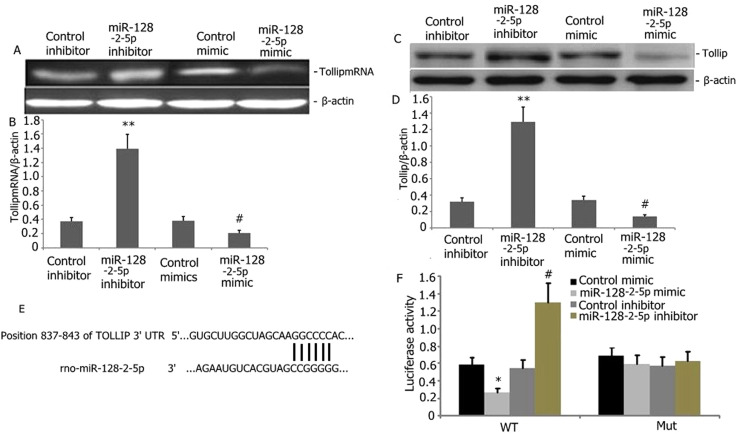
Figure 7. Tollip as a direct target of miR-128-2-5p. (A–B) Tollip mRNA levels increased with miR-128-2-5p down-regulation in RAW264.7 macrophages (P < 0.05). (C–D) The Tollip protein levels decreased with miR-128-2-5p overexpression in RAW264.7 macrophages compared with vector controls (P < 0.05). MiR-128-2-5p bound to Tollip-3′-UTR-wt, whereas binding was blocked by Tollip-3′-UTR-mt. (F) Dual luciferase reporter assays confirmed that the miR-128-2-5p mimic bound to Tollip-3′-UTR-wt but not to Tollip-3′-UTR-mt (P < 0.05).
Figure 7. Tollip as a direct target of miR-128-2-5p. (A–B) Tollip mRNA levels increased with miR-128-2-5p down-regulation in RAW264.7 macrophages (P < 0.05). (C–D) The Tollip protein levels decreased with miR-128-2-5p overexpression in RAW264.7 macrophages compared with vector controls (P < 0.05). MiR-128-2-5p bound to Tollip-3′-UTR-wt, whereas binding was blocked by Tollip-3′-UTR-mt. (F) Dual luciferase reporter assays confirmed that the miR-128-2-5p mimic bound to Tollip-3′-UTR-wt but not to Tollip-3′-UTR-mt (P < 0.05).CC BY-NC · PubMed Central
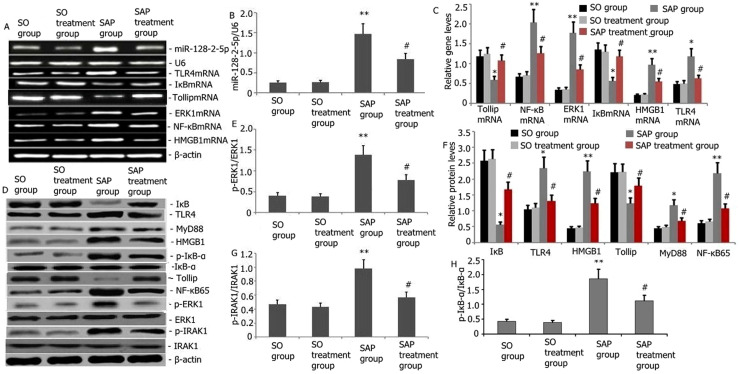
Figure 8. Effect of the notoginsenoside R1 treatment on the gene and the protein expression levels of miR-128-2-5p, ERK1, Tollip, HMGB1, TLR4, IκB, and NF-κB from the acute pancreatitis-induced lung tissue. (A) Representative qRT-PCR images showing the miR-128-2-5p, IκB, ERK1, Tollip, HMGB1, TLR4, and NF-κB genes expression level in rats' lungs at 48 h after the notoginsenoside R1 administration. (B–C) Statistical summary of the densitometric analysis of the expression levels of miR-128-2-5p, ERK1, Tollip, HMGB1, TLR4, and NF-κB genes in rats. (D) Representative Western blots showing the expression levels of TLR4, p-IRAK1, MyD88, Tollip, p-ERK1, NF-κB65, IκB, p-IκB-α and HMGB1 in rats' lungs with acute pancreatitis at 24 h after the notoginsenoside R1 administration. (E–H) Statistical summary of the densitometric analysis of the expression levels of TLR4, p-IRAK1, MyD88, Tollip, p-ERK1, NF-κB65, IκB, p-IκB-α, and HMGB1 in rat lung tissues. Data were presented as mean ± SD of three independent experiments. *P < 0.05, **P < 0.01 vs. the SO group; #P < 0.05, ##P < 0.01 vs. the SAP group.
Figure 8. Effect of the notoginsenoside R1 treatment on the gene and the protein expression levels of miR-128-2-5p, ERK1, Tollip, HMGB1, TLR4, IκB, and NF-κB from the acute pancreatitis-induced lung tissue. (A) Representative qRT-PCR images showing the miR-128-2-5p, IκB, ERK1, Tollip, HMGB1, TLR4, and NF-κB genes expression level in rats' lungs at 48 h after the notoginsenoside R1 administration. (B–C) Statistical summary of the densitometric analysis of the expression levels of miR-128-2-5p, ERK1, Tollip, HMGB1, TLR4, and NF-κB genes in rats. (D) Representative Western blots showing the expression levels of TLR4, p-IRAK1, MyD88, Tollip, p-ERK1, NF-κB65, IκB, p-IκB-α and HMGB1 in rats' lungs with acute pancreatitis at 24 h after the notoginsenoside R1 administration. (E–H) Statistical summary of the densitometric analysis of the expression levels of TLR4, p-IRAK1, MyD88, Tollip, p-ERK1, NF-κB65, IκB, p-IκB-α, and HMGB1 in rat lung tissues. Data were presented as mean ± SD of three independent experiments. *P < 0.05, **P < 0.01 vs. the SO group; #P < 0.05, ##P < 0.01 vs. the SAP group.CC BY-NC · PubMed Central
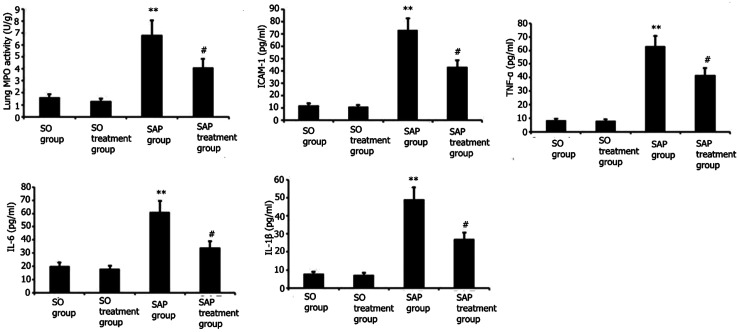
Figure 9. Attenuation of MPO activity and systemic inflammation in the lungs and pancreas in acute pancreatitis-induced lung injury by NG-R1 treatment. (A) The MPO activity in the lungs and pancreas were measured at 48 h after NG-R1 administration. (B–F) The BALF TNF-α, IL-1β, IL-6, and ICAM-1 levels were determined using ELISA at 48 h after NG-R1 administration. Data are expressed as mean ± SD. ** P < 0.01 vs SO group; #P < 0.05 vs SAP group.
Figure 9. Attenuation of MPO activity and systemic inflammation in the lungs and pancreas in acute pancreatitis-induced lung injury by NG-R1 treatment. (A) The MPO activity in the lungs and pancreas were measured at 48 h after NG-R1 administration. (B–F) The BALF TNF-α, IL-1β, IL-6, and ICAM-1 levels were determined using ELISA at 48 h after NG-R1 administration. Data are expressed as mean ± SD. ** P < 0.01 vs SO group; #P < 0.05 vs SAP group.CC BY-NC · PubMed Central
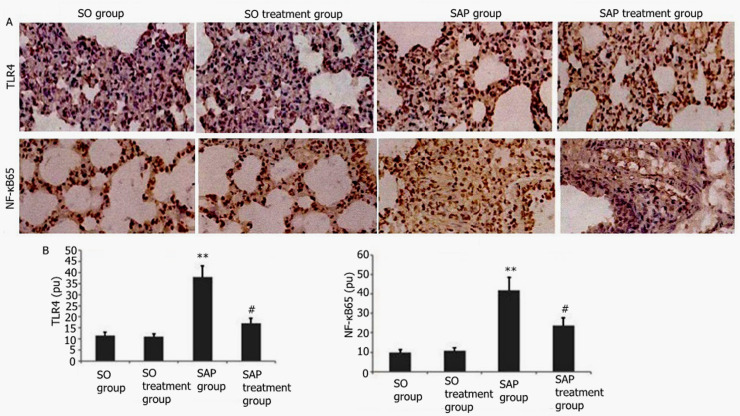
Figure 10. Effect of NG-R1 on the activation of NF-κB65 and TLR4 in acute pancreatitis-induced lung tissue observed using immunohistochemical staining. (A) Representative immunohistochemically stained graphs of NF-κB65- and TLR4-positive expression (400 × magnification). (B) Statistical analysis of NF-κB65- and TLR4-positive expression. Data are expressed as mean ± SD. **P < 0.01 vs SO group; #P < 0.05 vs SAP group.
Figure 10. Effect of NG-R1 on the activation of NF-κB65 and TLR4 in acute pancreatitis-induced lung tissue observed using immunohistochemical staining. (A) Representative immunohistochemically stained graphs of NF-κB65- and TLR4-positive expression (400 × magnification). (B) Statistical analysis of NF-κB65- and TLR4-positive expression. Data are expressed as mean ± SD. **P < 0.01 vs SO group; #P < 0.05 vs SAP group.CC BY-NC · PubMed Central
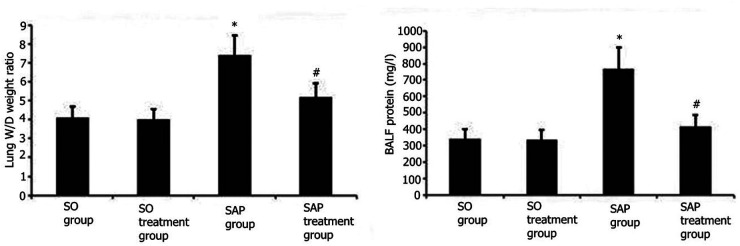
Figure 11. Effect of NG-R1 treatment on the lung wet/dry mass ratio and the BALF protein concentration in rats with taurocholate-induced acute pancreatitis. SAP was induced using intraperitoneal injection of 5% sodium taurocholate. Subsequently, the rats were administered with either 15 mg/kg NG-R1 injection or 300 μl aqueous saline via tail vein injection for 48 h. Lung wet/dry mass ratio and BALF protein concentration were measured. Data are expressed as mean ± SEM. **P < 0.01 vs control group; #P < 0.05 vs SAP group. Data are expressed as mean ± SD. * P < 0.05 vs SO group; #P < 0.05 vs model group.
Figure 11. Effect of NG-R1 treatment on the lung wet/dry mass ratio and the BALF protein concentration in rats with taurocholate-induced acute pancreatitis. SAP was induced using intraperitoneal injection of 5% sodium taurocholate. Subsequently, the rats were administered with either 15 mg/kg NG-R1 injection or 300 μl aqueous saline via tail vein injection for 48 h. Lung wet/dry mass ratio and BALF protein concentration were measured. Data are expressed as mean ± SEM. **P < 0.01 vs control group; #P < 0.05 vs SAP group. Data are expressed as mean ± SD. * P < 0.05 vs SO group; #P < 0.05 vs model group.CC BY-NC · PubMed Central
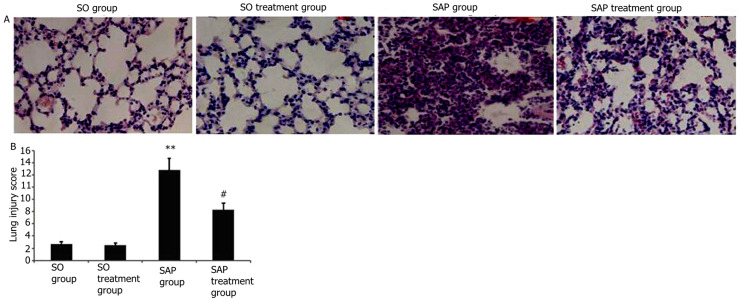
Figure 12. Effect of NG-R1 treatment on the changes in lung pathology and lung injury score in rats with taurocholate-induced acute pancreatitis. SAP was induced using intraperitoneal injection of 5% sodium taurocholate. Subsequently, rats were administered with either 15 mg/kg NG-R1 injection or 300 μl aqueous saline via tail vein injection for 48 h. (A) Representative images of H&E-stained lung sections from four experimental groups (200 × magnification). (B) Statistical analysis of lung injury score. Data are expressed as mean ± SD. **P < 0.01 vs control group; #P < 0.05 vs paraquat group. Data are expressed as mean ± SEM. * * P < 0.01 vs SO group; #P < 0.05 vs SAP group.
Figure 12. Effect of NG-R1 treatment on the changes in lung pathology and lung injury score in rats with taurocholate-induced acute pancreatitis. SAP was induced using intraperitoneal injection of 5% sodium taurocholate. Subsequently, rats were administered with either 15 mg/kg NG-R1 injection or 300 μl aqueous saline via tail vein injection for 48 h. (A) Representative images of H&E-stained lung sections from four experimental groups (200 × magnification). (B) Statistical analysis of lung injury score. Data are expressed as mean ± SD. **P < 0.01 vs control group; #P < 0.05 vs paraquat group. Data are expressed as mean ± SEM. * * P < 0.01 vs SO group; #P < 0.05 vs SAP group.CC BY-NC · PubMed Central

Verification

Claims the paper makes

The claims and statistics of this paper haven’t been checked yet.

Run the check — free, no account needed. It reads the open-access text and checks the sources it cites.

A few free checks a day · papers already verified open instantly · results are public

Claims other papers make about this one

Each is checked against this paper’s own text: does it say what the citing paper says it does?

Self-check

Percentages, sums and reported differences re-computed from the paper’s own numbers.

The self-check needs the paper’s full text.

Citations

Cites

No references could be resolved yet.

Research works printed but not linked: 62

  1. Pan L, 2018, Int J Mol Med, 42, 3582
  2. Zhao Q, 2018, Int J Mol Med, 42, 3513
  3. 10.1002/jcb.27356 · DOI
  4. Cui HX, 2014, Eur Rev Med Pharmacol Sci, 18, 2523
  5. 10.1111/bph.14169 · DOI
  6. 10.1016/j.jchromb.2014.08.034 · DOI
  7. 10.1186/s12906-018-2118-8 · DOI
  8. 10.1186/s13020-015-0045-x · DOI
  9. 10.1016/j.jep.2012.05.053 · DOI
  10. 10.1016/j.bbr.2018.02.037 · DOI
  11. 10.1155/2014/204840 · DOI
  12. 10.1038/35014038 · DOI
  13. 10.1016/j.intimp.2019.106072 · DOI
  14. 10.1007/s12602-019-09600-2 · DOI
  15. Wang X, 2016, Br J Nutr, 116, 1188, 10.1017/S000711451600297X · DOI
  16. 10.4049/jimmunol.1800062 · DOI
  17. 10.1016/j.mce.2018.06.005 · DOI
  18. 10.1080/15476286.2015.1112487 · DOI
  19. 10.1097/MCP.0000000000000532 · DOI
  20. 10.1002/jcb.26170 · DOI · Paper page
  21. Wang Y, 2018, J Cell Biochem, 20, 1133
  22. 10.1111/jcmm.13312 · DOI
  23. 10.1002/cbf.3365 · DOI
  24. 10.3349/ymj.2018.59.9.1096 · DOI · Paper page
  25. 10.1042/BSR20180540 · DOI
  26. 10.3892/ijmm.2014.1943 · DOI
  27. 10.1515/med-2021-0258 · DOI
  28. 10.3109/00365528009181493 · DOI
  29. 10.1016/j.omtn.2019.12.011 · DOI
  30. 10.2147/DDDT.S149700 · DOI
  31. 10.1124/jpet.114.218750 · DOI
  32. 10.1186/s12890-019-0799-5 · DOI
  33. 10.1038/s41598-019-43731-4 · DOI
  34. 10.1007/s12272-017-0991-1 · DOI
  35. 10.1111/jcmm.12269 · DOI
  36. Szapiel SV, 1979, Am Rev Respir Dis, 120, 893
  37. 10.1186/1472-6882-14-498 · DOI
  38. 10.1016/j.jad.2016.12.048 · DOI
  39. 10.1016/j.molimm.2018.09.003 · DOI
  40. 10.1172/JCI64931 · DOI
  41. Chooklin S, 2009, Hepatobiliary Pancreat Dis Int, 8, 186
  42. 10.1002/jcb.26859 · DOI
  43. 10.1016/j.ejphar.2018.07.004 · DOI
  44. 10.1093/abbs/gmx132 · DOI
  45. 10.18632/oncotarget.12283 · DOI
  46. 10.1002/ar.23763 · DOI
  47. 10.1002/hep.30705 · DOI
  48. 10.1038/s41598-017-15760-4 · DOI
  49. 10.1159/000489447 · DOI
  50. 10.1111/cei.12732 · DOI
  51. 10.1152/ajprenal.00170.2019 · DOI
  52. 10.1002/jcp.27265 · DOI
  53. 10.1002/cbf.3273 · DOI
  54. 10.1186/s12906-017-1635-1 · DOI
  55. 10.1111/j.1440-1843.2009.01586.x · DOI
  56. 10.3892/mmr.2014.2328 · DOI
  57. 10.1016/j.intimp.2018.12.065 · DOI
  58. 10.1097/MPA.0b013e3181575103 · DOI
  59. 10.1016/j.bcp.2020.113992 · DOI
  60. 10.1016/j.ecoenv.2018.07.080 · DOI
  61. 10.1142/S0192415X18500519 · DOI
  62. 10.1124/dmd.109.029819 · DOI

Cited by

Sorted by citations

Metadata

Authors
He, J., Liu, M.-W., Wang, Z.-Y., & Shi, R.-J.
Affiliations
  • Department of Gastrointestinal Surgery, First Affiliated Hospital of Dali University, Dali City, China
  • Department of Emergency, The First Hospital Affiliated of Kunming Medical University, Kunming, China
  • Department of Gastroenterology, First Affiliated Hospital of Dali University, Dali City, China
Venue
Innate Immunity
Published
2022-01
Volume
28
Issue
1
Pages
19-36
ISSN
  • 1753-4259
  • 1753-4267
Cited by
17
References
0
Language
en
Funders
Yunnan Applied Basic Research Project-Union Foundation (2017FE468[-032])

About these checks

Registry, retraction, Cites and statistics results are computed, not judged, with one exception: a printed reference that no index lists is read once by a model before it counts as a citation error. Claims are extracted by a model and kept only when their quote appears verbatim in the text; each cited source is then checked, with a model’s help, for whether it says what the claim relies on. Those verdicts can be wrong — read the claim’s quote and the cited source before relying on one.

Statistics and arithmetic are recomputed, not judged.

Confidence bands are shown only for fields calibrated on our annotated test set. None is calibrated yet, so no band is shown.

What counts as a claim ›How we measure confidence ›How we check this ›

Are you an author, or do you see a problem with this page? Request a review