Cited by 21

The DOI matches its Crossref record; 2 of the 2 references it cites were found in a registry or an index.

Therapeutic effects of the novel Leucyl-tRNA synthetase inhibitor BC-LI-0186 in non-small cell lung cancer

Kim, Eun Young, Lee, Jin Gu, Lee, Jung Mo, Kim, Arum, Yoo, Hee Chan, Kim, Kibum, Lee, Minji, Lee, Chulho, Han, Gyoonhee, Han, Jung Min, Chang, Yoon Soo·2019·Therapeutic Advances in Medical Oncology

Abstract

Objective: Leucyl-tRNA synthetase (LRS) is an aminoacyl-tRNA synthetase catalyzing ligation of leucine to its cognate tRNA and is involved in the activation of mTORC1 by sensing cytoplasmic leucine. In this study, the usefulness of LRS as a therapeutic target of non-small cell lung cancer (NSCLC) and the anticancer effect of the LRS inhibitor, BC-LI-0186, was evaluated. Methods: LRS expression and the antitumor effect of BC-LI-0186 were evaluated by immunohistochemical staining, immunoblotting, and live cell imaging. The in vivo antitumor effect of BC-LI-0186 was evaluated using Lox-Stop-Lox (LSL) K-ras G12D mice. Results: LRS was frequently overexpressed in NSCLC tissues, and its expression was positively correlated with mTORC1 activity. The guanosine-5’-triphosphate (GTP) binding status of RagB was related to the expression of LRS and the S6K phosphorylation. siRNA against LRS inhibited leucine-mediated mTORC1 activation and cell growth. BC-LI-0186 selectively inhibited phosphorylation of S6K without affecting phosphorylation of AKT and leucine-mediated co-localization of Raptor and LAMP2 in the lysosome. BC-LI-0186 induced cleaved poly (ADP-ribose) polymerase (PARP) and caspase-3 and increase of p62 expression, showing that it has the autophagy-inducing property. BC-LI-0186 has the cytotoxic effect at nanomolar concentration and its GI 50 value was negatively correlated with the degree of LRS expression. BC-LI-0186 showed the antitumor effect, which was comparable with that of cisplatin, and mTORC1 inhibitory effect in a lung cancer model. Conclusions: BC-LI-0186 inhibits the noncanonical mTORC1-activating function of LRS. These results provide a new therapeutic strategy for NSCLC and warrant future clinical development by targeting LRS.

Overview

The claims and statistics of this paper haven’t been checked yet.

Run the check — free, no account needed. It reads the open-access text and checks the sources it cites.

A few free checks a day · papers already verified open instantly · results are public

Integrity signals

Registry

Crossref · 10.1177/1758835919846798

Cites

2 of 2 references verified0 citation errors · 0 not checkable

Statistics

Figures

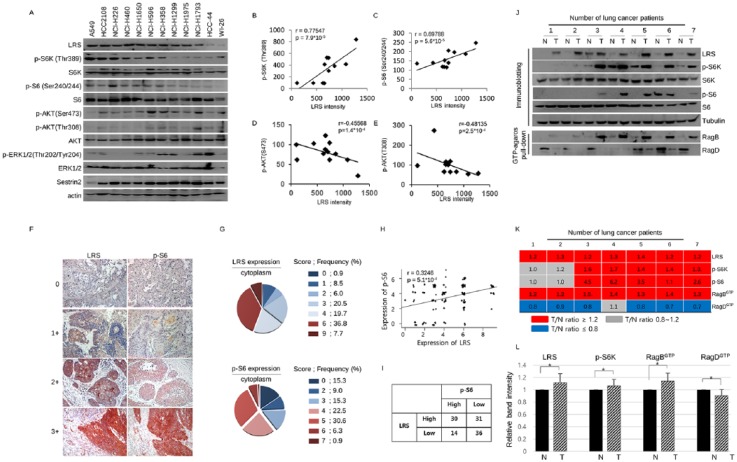
Figure 1. Expression of leucyl-tRNA synthetase (LRS) has positive correlation with mTORC1 signal in non-small cell lung cancer (NSCLC). (a) Immunoblotting of LRS and molecules constituting mTOR signaling in various NSCLC cells and WI-26 cells and (b) the correlation plot between LRS and p-S6K, (c) that between LRS and p-S6, (d) that between LRS and p-AKT(Ser473), and (e) that between LRS and p-Akt(Thr308). p-values were obtained from Pearson’s correlation analysis and r denotes Pearson’s correlation coefficient. (f) Representative photographs of immunohistochemistry (IHC) staining for LRS and p-S6 from serial sections of 117 NSCLC tissues and (g) pie chart indicating their IHC staining scores. (h) A correlation plot between the LRS and p-S6 expression. There was a significant positive correlation between two molecules in NSCLC tissues (r = 0.3246, p-value = 5.0 × 10⁻⁴). p-values were obtained from Pearson’s correlation analysis and r denotes Pearson’s correlation coefficient. (i) A 2 × 2 table, denoting the relationship between the LRS expression and p-S6 expression. There was a significant relationship between LRS and p-S6 expression (p-value = 0.03801, χ2-test ). For detailed information on the scoring system using intensity and frequency of staining, refer to the ‘Immunocytochemistry and IHC’ section. (j) Immunoblotting and GTP-agarose pull-down assay for LRS and mTORC1 markers using paired lysate of adjacent normal appearing tissue and NSCLC tissue. (k) Heatmap indicating the protein expression ratio from paired tumor–normal tissue lysates. Representative results from 7 paired samples among 15 paired samples were shown. Red represents the protein intensity ratio of tumor/normal tissues is over 1.2 and gray represents the ratio between 0.8 and 1.2. Blue represents the ratio of tumor/normal tissues is below 0.8. (l) A histogram obtained by normalizing each protein band intensity obtained from tumor tissue to that from adjacent normal appearing lung tissue in 15 normal–tumor paired samples. N, adjacent normal-appearing lung tissue; T, lung cancer tissue. p-values were obtained from t-test. *p < 0.001.
Figure 1. Expression of leucyl-tRNA synthetase (LRS) has positive correlation with mTORC1 signal in non-small cell lung cancer (NSCLC). (a) Immunoblotting of LRS and molecules constituting mTOR signaling in various NSCLC cells and WI-26 cells and (b) the correlation plot between LRS and p-S6K, (c) that between LRS and p-S6, (d) that between LRS and p-AKT(Ser473), and (e) that between LRS and p-Akt(Thr308). p-values were obtained from Pearson’s correlation analysis and r denotes Pearson’s correlation coefficient. (f) Representative photographs of immunohistochemistry (IHC) staining for LRS and p-S6 from serial sections of 117 NSCLC tissues and (g) pie chart indicating their IHC staining scores. (h) A correlation plot between the LRS and p-S6 expression. There was a significant positive correlation between two molecules in NSCLC tissues (r = 0.3246, p-value = 5.0 × 10⁻⁴). p-values were obtained from Pearson’s correlation analysis and r denotes Pearson’s correlation coefficient. (i) A 2 × 2 table, denoting the relationship between the LRS expression and p-S6 expression. There was a significant relationship between LRS and p-S6 expression (p-value = 0.03801, χ2-test ). For detailed information on the scoring system using intensity and frequency of staining, refer to the ‘Immunocytochemistry and IHC’ section. (j) Immunoblotting and GTP-agarose pull-down assay for LRS and mTORC1 markers using paired lysate of adjacent normal appearing tissue and NSCLC tissue. (k) Heatmap indicating the protein expression ratio from paired tumor–normal tissue lysates. Representative results from 7 paired samples among 15 paired samples were shown. Red represents the protein intensity ratio of tumor/normal tissues is over 1.2 and gray represents the ratio between 0.8 and 1.2. Blue represents the ratio of tumor/normal tissues is below 0.8. (l) A histogram obtained by normalizing each protein band intensity obtained from tumor tissue to that from adjacent normal appearing lung tissue in 15 normal–tumor paired samples. N, adjacent normal-appearing lung tissue; T, lung cancer tissue. p-values were obtained from t-test. *p < 0.001.CC BY-NC · PubMed Central
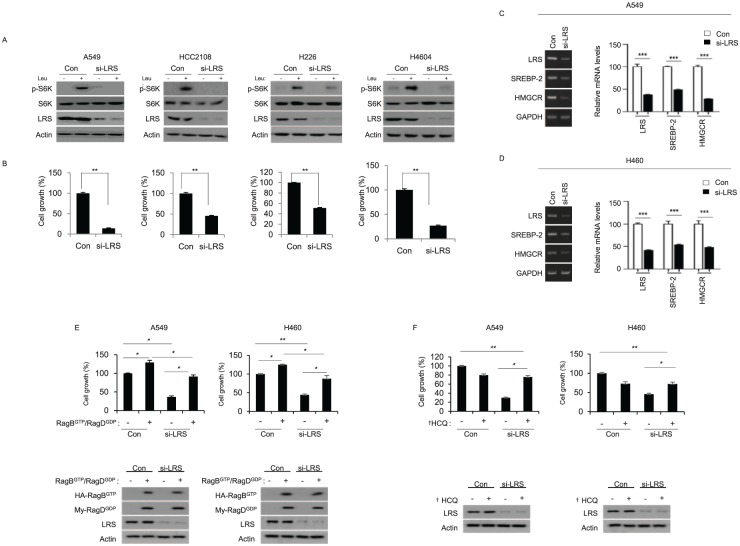
Figure 2. Leucyl-tRNA synthetase (LRS) plays an important role for mTORC1 activation and cell growth in response to leucine. (a) Lung cancer cells, which have relatively high LRS expression, were transfected with either control siRNA (Con) or siRNA against LRS (si-LRS). For 48 h, cells were starved for leucine for 90 min, and then re-stimulated with leucine for 20 min and subjected to immunoblotting. (b) At the same time, cell growth was evaluated by live cell imaging. p-values were obtained from t-test. (c) A549 cells and (d) H460 cells were transfected with Con or si-LRS for 48 h, and the mRNA level of SREBP-2 and HMGCR was analyzed by reverse transcription polymerase chain reaction (RT-PCR) (left). Relative mRNA level was quantified (right). (e) A549 and H460 cells were co-transfected with GTP mutant of RagB (Q99L) and GDP mutant of RagD (S77L) either in the presence or absence of si-LRS. 48 h later, cell growth was measured by live-cell imaging device. Active RagB/D overexpression overcomes the inhibitory effect of LRS knockdown on cell growth. In the bottom, the immunoblotting on the expression of RagB/RagD and LRS knockdown. (f) A549 and H460 NSCLC cells were transfected with si-LRS in the presence of DMSO (-) or hydroxychloroquine (+), which is an autophagy inhibitor. After 48 h, cell growth was monitored by live-cell imaging device. The immunoblotting on the expression of LRS knockdown by si-LRS was shown in the bottom of histogram. si-LRS denotes siRNA against LRS and Con denotes control siRNA. *p < 0.05; **p < 0.01; ***p < 0.001; †HCQ, hydroxychloroquine.
Figure 2. Leucyl-tRNA synthetase (LRS) plays an important role for mTORC1 activation and cell growth in response to leucine. (a) Lung cancer cells, which have relatively high LRS expression, were transfected with either control siRNA (Con) or siRNA against LRS (si-LRS). For 48 h, cells were starved for leucine for 90 min, and then re-stimulated with leucine for 20 min and subjected to immunoblotting. (b) At the same time, cell growth was evaluated by live cell imaging. p-values were obtained from t-test. (c) A549 cells and (d) H460 cells were transfected with Con or si-LRS for 48 h, and the mRNA level of SREBP-2 and HMGCR was analyzed by reverse transcription polymerase chain reaction (RT-PCR) (left). Relative mRNA level was quantified (right). (e) A549 and H460 cells were co-transfected with GTP mutant of RagB (Q99L) and GDP mutant of RagD (S77L) either in the presence or absence of si-LRS. 48 h later, cell growth was measured by live-cell imaging device. Active RagB/D overexpression overcomes the inhibitory effect of LRS knockdown on cell growth. In the bottom, the immunoblotting on the expression of RagB/RagD and LRS knockdown. (f) A549 and H460 NSCLC cells were transfected with si-LRS in the presence of DMSO (-) or hydroxychloroquine (+), which is an autophagy inhibitor. After 48 h, cell growth was monitored by live-cell imaging device. The immunoblotting on the expression of LRS knockdown by si-LRS was shown in the bottom of histogram. si-LRS denotes siRNA against LRS and Con denotes control siRNA. *p < 0.05; **p < 0.01; ***p < 0.001; †HCQ, hydroxychloroquine.CC BY-NC · PubMed Central
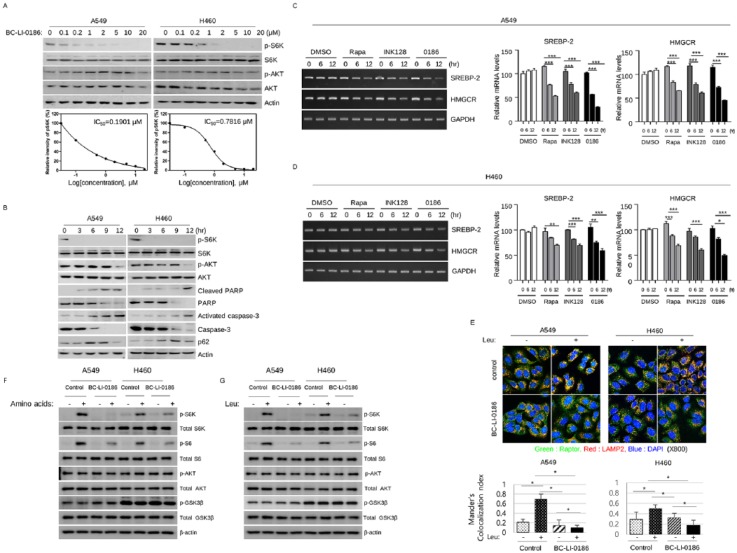
Figure 3. BC-LI-0186 suppresses leucine-mediated mTORC1 activation. (a) Dose- and (b) time-dependent effects of BC-LI-0186 on mTOR signaling were evaluated by immunoblot. To evaluate the dose-dependent effect of BC-LI-0186, cells were starved for 90 min in the leucine-free medium and then treated with the indicated dose of BC-LI-0186 in the serum-free media for 15 min. To identify the time-dependent effect, 20 μM of BC-LI-0186 was treated by the same method and harvested at the indicated time. (c) A549 cells and (d) H460 cells were treated with 50 nM rapamycin (Rapa), 1 mM INK128, or 10 mM BC-LI-0186 (0186) and mRNA level of SREBP-2 and HMGCR was evaluated by reverse transcription polymerase chain reaction (RT-PCR) (left). Relative mRNA levels were quantified (right) (*p < 0.05; **p < 0.01; ***p < 0.001). (e) BC-LI-0186 inhibits leucine-mediated colocalization of Raptor and LAMP2 in lysosomes. A549 and H460 cells were starved for leucine for 90 min and then incubated in the media with either DMSO or 10 μM of BC-LI-0186 for 2 h, and then challenged with 0.8 mM of leucine for 10 min. After fixation cells were incubated with anti-Raptor and anti-LAMP2 primary antibodies and then visualized with Alexa 488- and Alexa 558-conjugated secondary antibodies. Colocalization results are shown in yellow. In the bottom, quantification of the colocalization between Raptor and LAMP2 was performed by Coloc 2 function of ImageJ. Histogram was obtained by the mean ± standard deviation (SD) of Mander’s colocalization index obtained from more than 10 cells for each staining. BC-LI-0186 inhibits (f) amino-acid- and (g) leucine-mediated mTORC1 signaling. Cells were plated in fetal bovine serum (FBS) supplemented growth media. The next day, cells were incubated in amino-acid-free or leucine-free media containing 10 μM of BC-LI-0186 for 16 h and then stimulated with either amino acid containing media or that with 0.8 mM of leucine for 10 min.
Figure 3. BC-LI-0186 suppresses leucine-mediated mTORC1 activation. (a) Dose- and (b) time-dependent effects of BC-LI-0186 on mTOR signaling were evaluated by immunoblot. To evaluate the dose-dependent effect of BC-LI-0186, cells were starved for 90 min in the leucine-free medium and then treated with the indicated dose of BC-LI-0186 in the serum-free media for 15 min. To identify the time-dependent effect, 20 μM of BC-LI-0186 was treated by the same method and harvested at the indicated time. (c) A549 cells and (d) H460 cells were treated with 50 nM rapamycin (Rapa), 1 mM INK128, or 10 mM BC-LI-0186 (0186) and mRNA level of SREBP-2 and HMGCR was evaluated by reverse transcription polymerase chain reaction (RT-PCR) (left). Relative mRNA levels were quantified (right) (*p < 0.05; **p < 0.01; ***p < 0.001). (e) BC-LI-0186 inhibits leucine-mediated colocalization of Raptor and LAMP2 in lysosomes. A549 and H460 cells were starved for leucine for 90 min and then incubated in the media with either DMSO or 10 μM of BC-LI-0186 for 2 h, and then challenged with 0.8 mM of leucine for 10 min. After fixation cells were incubated with anti-Raptor and anti-LAMP2 primary antibodies and then visualized with Alexa 488- and Alexa 558-conjugated secondary antibodies. Colocalization results are shown in yellow. In the bottom, quantification of the colocalization between Raptor and LAMP2 was performed by Coloc 2 function of ImageJ. Histogram was obtained by the mean ± standard deviation (SD) of Mander’s colocalization index obtained from more than 10 cells for each staining. BC-LI-0186 inhibits (f) amino-acid- and (g) leucine-mediated mTORC1 signaling. Cells were plated in fetal bovine serum (FBS) supplemented growth media. The next day, cells were incubated in amino-acid-free or leucine-free media containing 10 μM of BC-LI-0186 for 16 h and then stimulated with either amino acid containing media or that with 0.8 mM of leucine for 10 min.CC BY-NC · PubMed Central
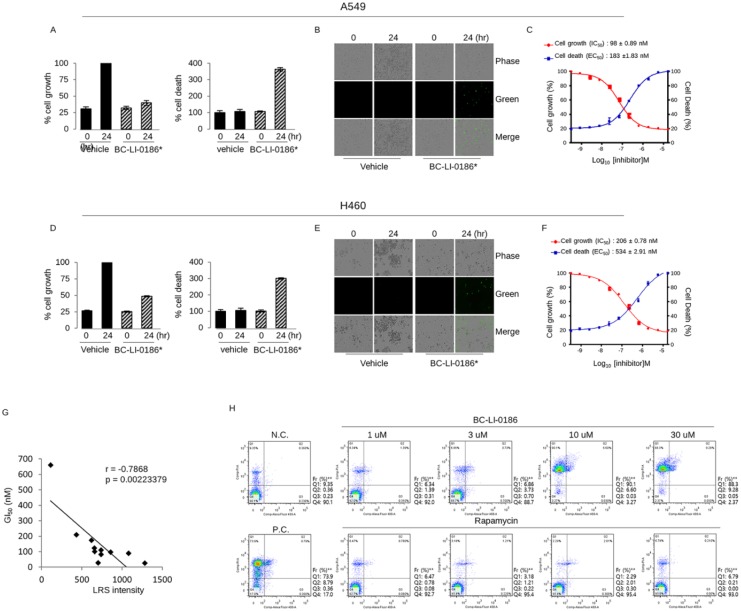
Figure 4. Cytotoxic effect of BC-LI-0186 on non-small cell lung cancer (NSCLC) cells. (a) A histogram and (b) representative phase contrast images on the cell growth and cell death obtained by incubating A549 cells for the indicated times with vehicle or 16.67 uM of BC-LI-0186. Black bar indicates vehicle whereas hatch bar indicates BC-LI-0186-treated cell. (c) Curved graph indicating the A549 cell growth and cell death at various BC-LI-0186 concentrations. IC50 and EC50 was estimated using a 12-drug concentration by serial dilution based on the maximum concentration of 50 uM. (d) A histogram and (e) representative phase contrast images on the cell growth and cell death obtained by incubating H460 cells for the indicated times with vehicle or 16.67 uM of BC-LI-0186. Black bar indicates vehicle whereas hatch bar indicates BC-LI-0186-treated cell. (f) Curved graph indicating the H460 cell growth and cell death at various BC-LI-0186 concentration. IC50 and EC50 was estimated using a 12-drug concentration by serial dilution based on the maximum concentration of 50 uM. For the measurement of cell growth and death, cells were incubated in the media containing CellToxTM GreenDye and cell confluence and green fluorescence were measured by IncuCyteTM Zoom assay. Note that a green spot indicates cell death. (g) Correlation plot between GI50 obtained from live cell imaging and leucyl-tRNA synthetase (LRS) expression from immunoblotting in 11 NSCLC cells. p-values were obtained from Pearson’s correlation analysis and r denotes Pearson’s correlation coefficient. (h) H460 cells were treated with indicated dose of BC-LI-0186 or rapamycin for 48 h, and cell death was measured by flow cytometry using annexin V and PI staining.
Figure 4. Cytotoxic effect of BC-LI-0186 on non-small cell lung cancer (NSCLC) cells. (a) A histogram and (b) representative phase contrast images on the cell growth and cell death obtained by incubating A549 cells for the indicated times with vehicle or 16.67 uM of BC-LI-0186. Black bar indicates vehicle whereas hatch bar indicates BC-LI-0186-treated cell. (c) Curved graph indicating the A549 cell growth and cell death at various BC-LI-0186 concentrations. IC50 and EC50 was estimated using a 12-drug concentration by serial dilution based on the maximum concentration of 50 uM. (d) A histogram and (e) representative phase contrast images on the cell growth and cell death obtained by incubating H460 cells for the indicated times with vehicle or 16.67 uM of BC-LI-0186. Black bar indicates vehicle whereas hatch bar indicates BC-LI-0186-treated cell. (f) Curved graph indicating the H460 cell growth and cell death at various BC-LI-0186 concentration. IC50 and EC50 was estimated using a 12-drug concentration by serial dilution based on the maximum concentration of 50 uM. For the measurement of cell growth and death, cells were incubated in the media containing CellToxTM GreenDye and cell confluence and green fluorescence were measured by IncuCyteTM Zoom assay. Note that a green spot indicates cell death. (g) Correlation plot between GI50 obtained from live cell imaging and leucyl-tRNA synthetase (LRS) expression from immunoblotting in 11 NSCLC cells. p-values were obtained from Pearson’s correlation analysis and r denotes Pearson’s correlation coefficient. (h) H460 cells were treated with indicated dose of BC-LI-0186 or rapamycin for 48 h, and cell death was measured by flow cytometry using annexin V and PI staining.CC BY-NC · PubMed Central
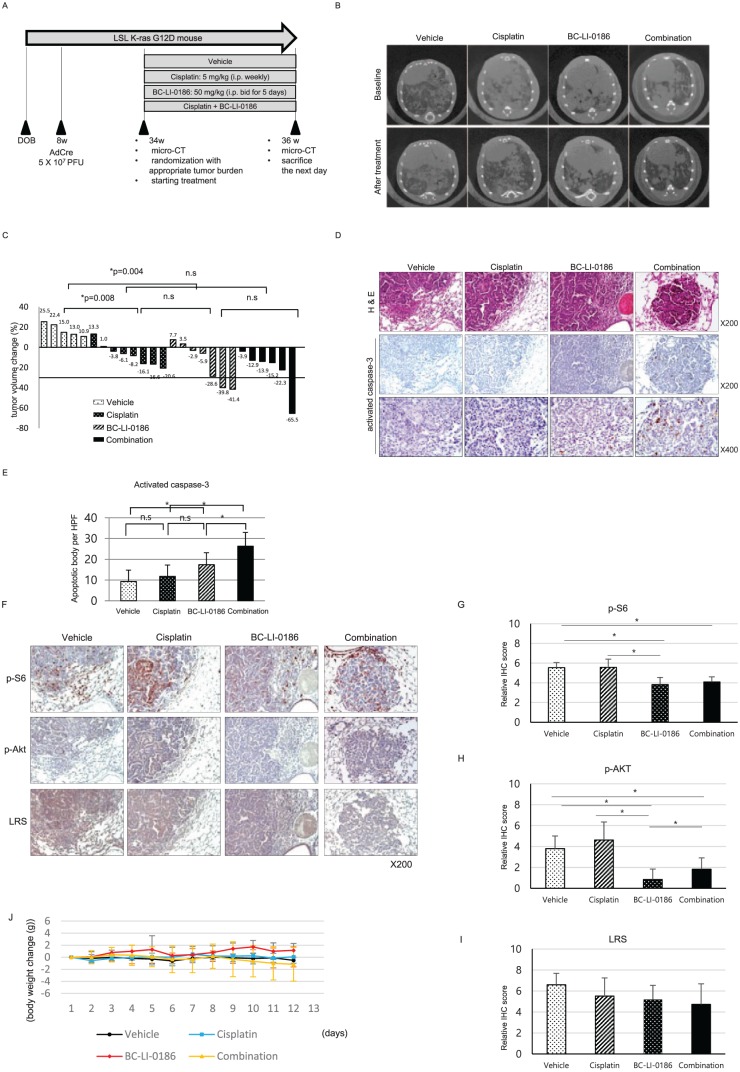
Figure 5. Antitumor effect of BC-LI-0186 in a K-ras lung cancer mouse model. (a) Diagram of the treatment schedule in a Lox-Stop-Lox (LSL) K-ras G12D mouse lung cancer model. (b) Representative microcomputed tomography (µCT) images performed before and after 2-week treatment schedule and (c) waterfall plot for tumor size change comparing before and after treatment. p-values were obtained using the Mann–Whitney U test. (d) Representative photos of H&E and activated caspase-3 immunohistochemistry (IHC) staining on the lungs harvested after 2 weeks of treatment and (e) a histogram quantifying the activated caspase-3 spots in the tumor of each treatment group. A total of 10 tumor areas per mouse were selected and then photographed at a magnification of 400×. The histogram was obtained by counting the number of activated caspase-3 spots observed in each field and using the mean and standard error (SE) values. *p < 0.05. p-values were obtained by one-way analysis of variance (ANOVA) followed by Tukey’s post hoc multiple comparison tests. (f) Representative photograph of IHC staining of pS6, pAKT, and leucyl-tRNA synthetase (LRS) on the lung sections obtained after 2 weeks treatment and quantification of (g) p-S6, (h) p-AKT, and (i) LRS expression in the tumor of each treatment group. At least 10 tumor was photographed per mouse and scored as described in the ‘Materials and methods’ section. *p < 0.05. p-values were obtained by one-way ANOVA followed by Tukey’s post hoc multiple comparison tests. (j) Body weight change among treatment groups during treatment. There was no significant body weight change among the treatment groups.
Figure 5. Antitumor effect of BC-LI-0186 in a K-ras lung cancer mouse model. (a) Diagram of the treatment schedule in a Lox-Stop-Lox (LSL) K-ras G12D mouse lung cancer model. (b) Representative microcomputed tomography (µCT) images performed before and after 2-week treatment schedule and (c) waterfall plot for tumor size change comparing before and after treatment. p-values were obtained using the Mann–Whitney U test. (d) Representative photos of H&E and activated caspase-3 immunohistochemistry (IHC) staining on the lungs harvested after 2 weeks of treatment and (e) a histogram quantifying the activated caspase-3 spots in the tumor of each treatment group. A total of 10 tumor areas per mouse were selected and then photographed at a magnification of 400×. The histogram was obtained by counting the number of activated caspase-3 spots observed in each field and using the mean and standard error (SE) values. *p < 0.05. p-values were obtained by one-way analysis of variance (ANOVA) followed by Tukey’s post hoc multiple comparison tests. (f) Representative photograph of IHC staining of pS6, pAKT, and leucyl-tRNA synthetase (LRS) on the lung sections obtained after 2 weeks treatment and quantification of (g) p-S6, (h) p-AKT, and (i) LRS expression in the tumor of each treatment group. At least 10 tumor was photographed per mouse and scored as described in the ‘Materials and methods’ section. *p < 0.05. p-values were obtained by one-way ANOVA followed by Tukey’s post hoc multiple comparison tests. (j) Body weight change among treatment groups during treatment. There was no significant body weight change among the treatment groups.CC BY-NC · PubMed Central

Verification

Claims the paper makes

The claims and statistics of this paper haven’t been checked yet.

Run the check — free, no account needed. It reads the open-access text and checks the sources it cites.

A few free checks a day · papers already verified open instantly · results are public

Claims other papers make about this one

Each is checked against this paper’s own text: does it say what the citing paper says it does?

Self-check

Percentages, sums and reported differences re-computed from the paper’s own numbers.

The self-check needs the paper’s full text.

Citations

Cites

Show all 2 references

Research works printed but not linked: 37

  1. 10.3322/caac.21387 · DOI · Paper page
  2. 10.4046/trd.2016.79.4.248 · DOI
  3. Park SG, 2010, IUBMB Life, 62, 296, 10.1002/iub.324 · DOI
  4. 10.1242/jcs.01342 · DOI
  5. 10.1038/nrc3124 · DOI
  6. 10.1016/S0968-0004(97)01052-9 · DOI
  7. 10.1093/nar/19.13.3489 · DOI
  8. 10.1158/1055-9965.EPI-09-0456 · DOI
  9. 10.1074/jbc.C200126200 · DOI
  10. 10.1096/fj.07-9973com · DOI
  11. 10.4161/trns.2.1.13650 · DOI
  12. 10.1038/nature07598 · DOI
  13. 10.1093/emboj/19.10.2351 · DOI
  14. 10.1016/j.molcel.2012.02.009 · DOI
  15. 10.1016/j.cell.2012.02.044 · DOI · Paper page
  16. 10.1152/ajpendo.90645.2008 · DOI
  17. 10.1038/s41467-017-00785-0 · DOI · Paper page
  18. 10.1016/j.lungcan.2014.04.012 · DOI
  19. 10.1016/j.cllc.2012.09.007 · DOI
  20. 10.1038/nrclinonc.2018.28 · DOI · Paper page
  21. 10.1126/science.1157535 · DOI · Paper page
  22. 10.1016/j.lungcan.2015.04.003 · DOI
  23. 10.1101/gad.943001 · DOI
  24. 10.1016/j.canlet.2014.12.041 · DOI
  25. 10.1073/pnas.1103746108 · DOI
  26. 10.1083/jcb.201306041 · DOI
  27. 10.1002/humu.21028 · DOI
  28. 10.1038/sj.bjc.6604886 · DOI
  29. Gao G, 2015, Onco Targets Ther, 8, 2933
  30. 10.1016/j.amjcard.2015.08.040 · DOI
  31. 10.1111/bcp.12893 · DOI
  32. 10.1007/s00467-016-3474-6 · DOI
  33. 10.1016/S0140-6736(15)00817-X · DOI
  34. 10.1056/NEJMoa1109653 · DOI · Paper page
  35. 10.1016/S0140-6736(08)61039-9 · DOI · Paper page
  36. 10.1016/j.cmet.2014.01.001 · DOI · Paper page
  37. 10.1038/nm0796-811 · DOI

Cited by

Sorted by citations

See all 21

Metadata

Authors
Kim, E. Y., Lee, J. G., Lee, J. M., Kim, A., Yoo, H. C., Kim, K., Lee, M., Lee, C., Han, G., Han, J. M., & Chang, Y. S.
Affiliations
  • Department of Internal Medicine, Yonsei University College of Medicine, Yonsei University, Seoul, South Korea
  • Department of Thoracic and Cardiovascular Surgery, Yonsei University College of Medicine, Yonsei University, Seoul, South Korea
  • College of Pharmacy, Yonsei Institute of Pharmaceutical Sciences, Yonsei University, Seoul, South Korea
  • Translational Research Center for Protein Function Control, Department of Biotechnology, Yonsei University, Seoul, South Korea
  • College of Pharmacy, Yonsei Institute of Pharmaceutical Sciences, Yonsei University, 85 Songdogwahak-ro, Yeonsu-gu, Incheon, 21983, South Korea
  • Department of Internal Medicine, Yonsei University College of Medicine, Yonsei University, 4th Floor, Research Center for Future Medicine, 20, Eonju-ro 63-gil, Gangnam-gu, Seoul, 06229, South Korea
Venue
Therapeutic Advances in Medical Oncology
Published
2019-01
Volume
11
ISSN
1758-8359
Cited by
21
References
2
Language
en
Funders
national research foundation of korea (2018R1A6A1A03023718, NRF-2013M3A6A4072536, NRF-2014M3A6A4074817)

About these checks

Registry, retraction, Cites and statistics results are computed, not judged, with one exception: a printed reference that no index lists is read once by a model before it counts as a citation error. Claims are extracted by a model and kept only when their quote appears verbatim in the text; each cited source is then checked, with a model’s help, for whether it says what the claim relies on. Those verdicts can be wrong — read the claim’s quote and the cited source before relying on one.

Statistics and arithmetic are recomputed, not judged.

Confidence bands are shown only for fields calibrated on our annotated test set. None is calibrated yet, so no band is shown.

What counts as a claim ›How we measure confidence ›How we check this ›

Are you an author, or do you see a problem with this page? Request a review

How to cite

Cite CoChat for the checks on this page, and the paper for its own findings.

This page
CoChat. (2026). Citation check: Therapeutic effects of the novel Leucyl-tRNA synthetase inhibitor BC-LI-0186 in non-small cell lung cancer. https://app.cochat.ai/papers/10.1177/1758835919846798
The paper
Kim, E. Y., Lee, J. G., Lee, J. M., Kim, A., Yoo, H. C., Kim, K., Lee, M., Lee, C., Han, G., Han, J. M., & Chang, Y. S. (2019). Therapeutic effects of the novel Leucyl-tRNA synthetase inhibitor BC-LI-0186 in non-small cell lung cancer. Therapeutic Advances in Medical Oncology. https://doi.org/10.1177/1758835919846798