

The DOI matches its Crossref record; 3 of the 3 references it cites were found in a registry or an index.
HMGA2 promotes long-term engraftment and myeloerythroid differentiation of human hematopoietic stem and progenitor cells
Abstract
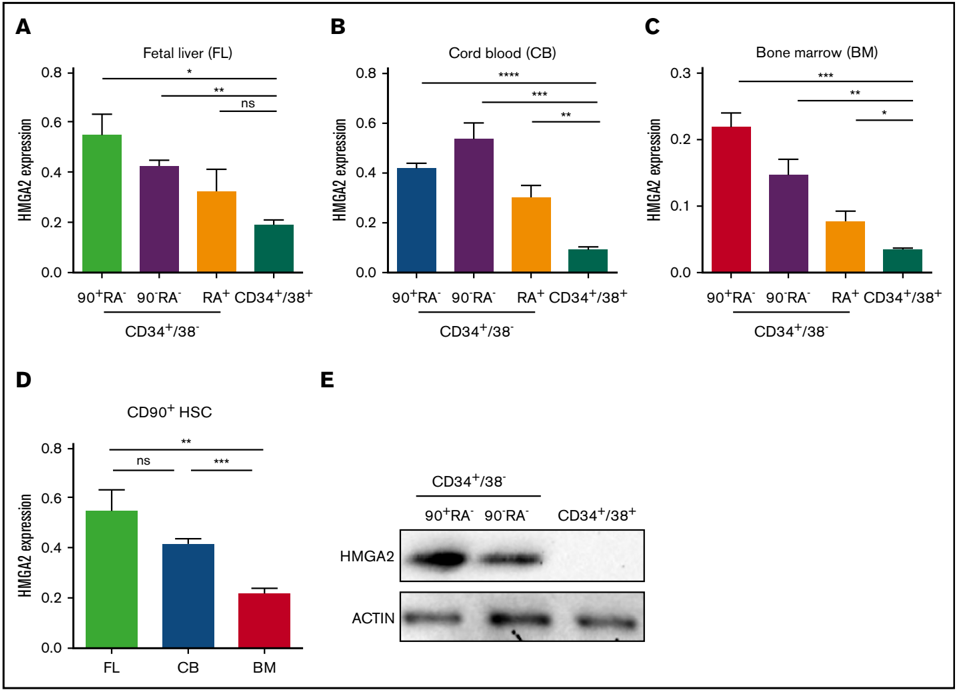
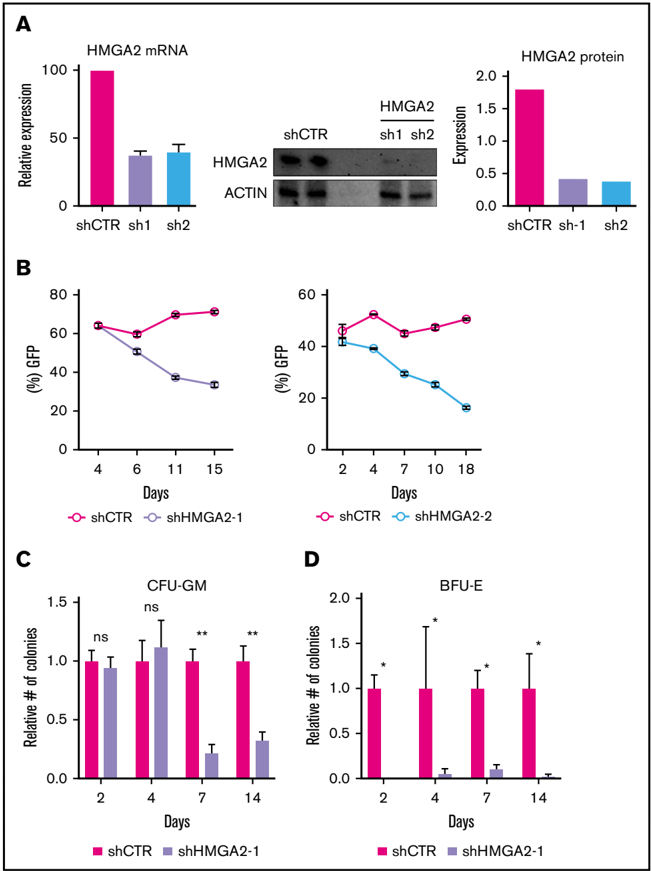
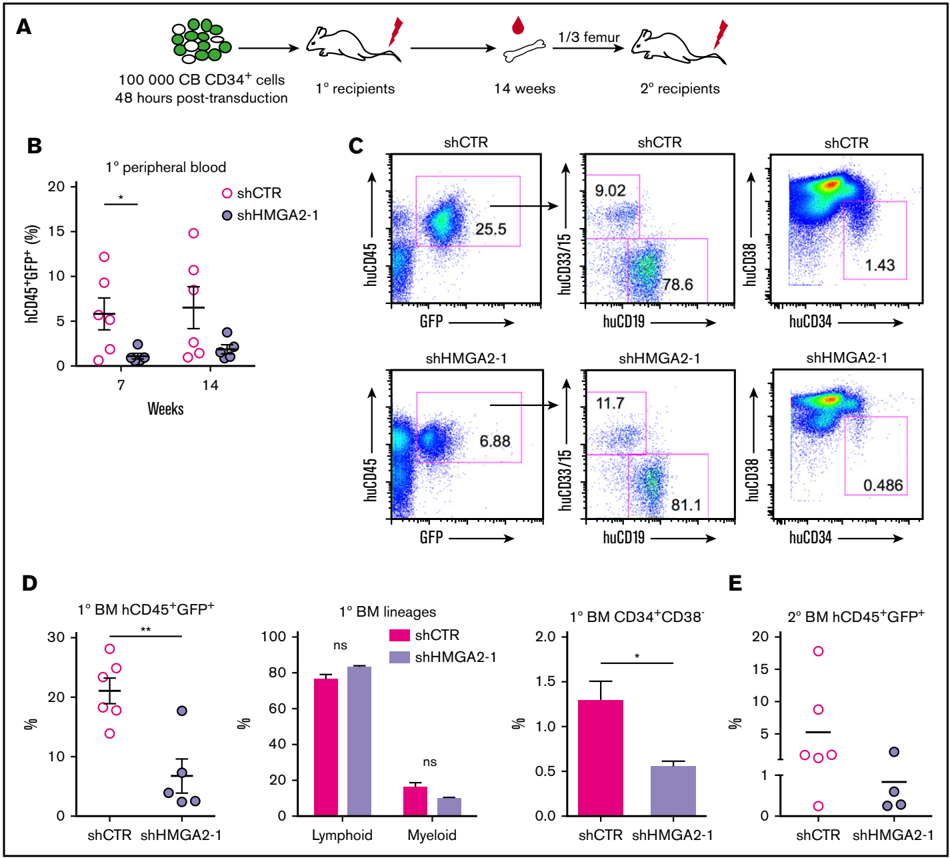
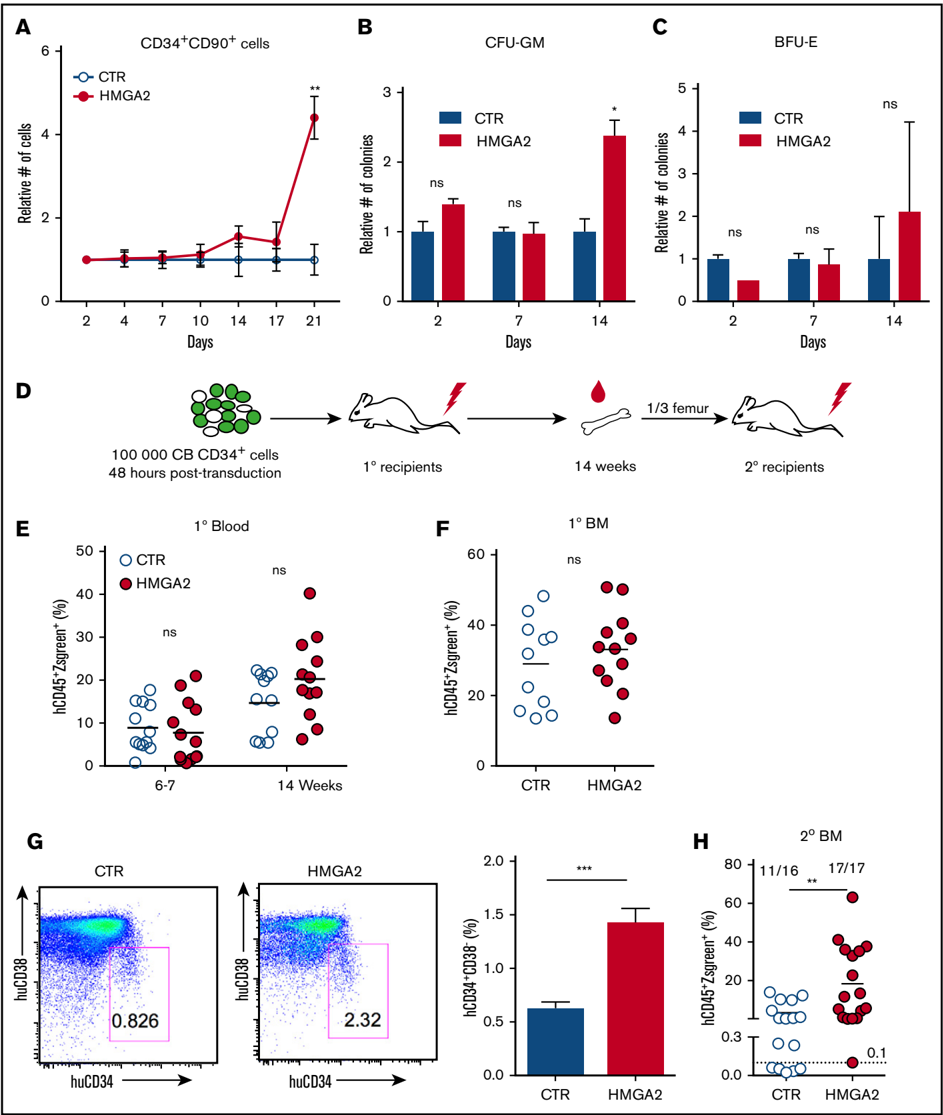
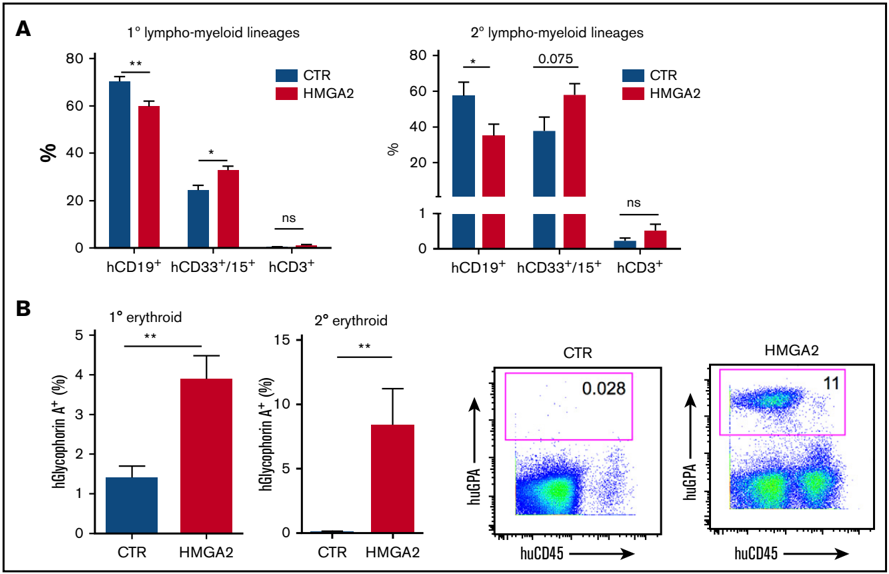
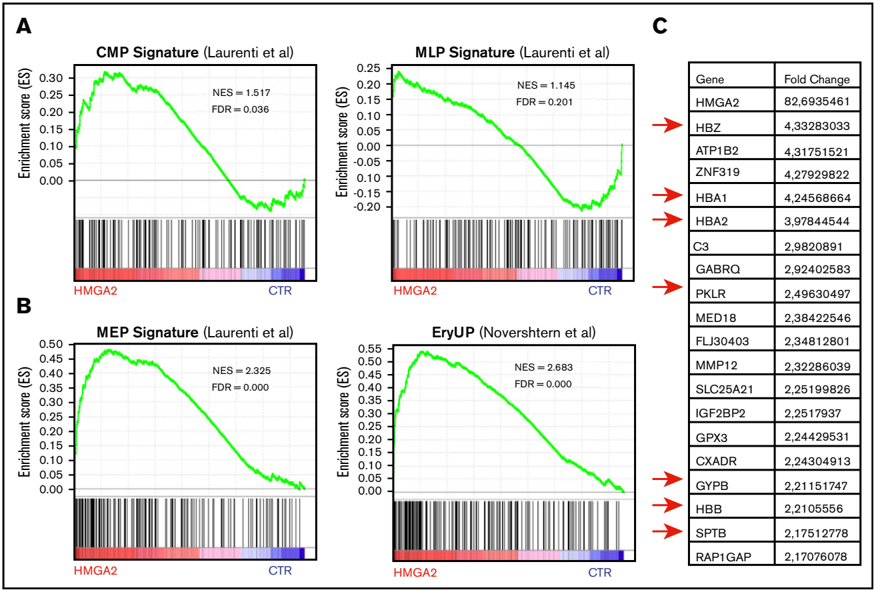
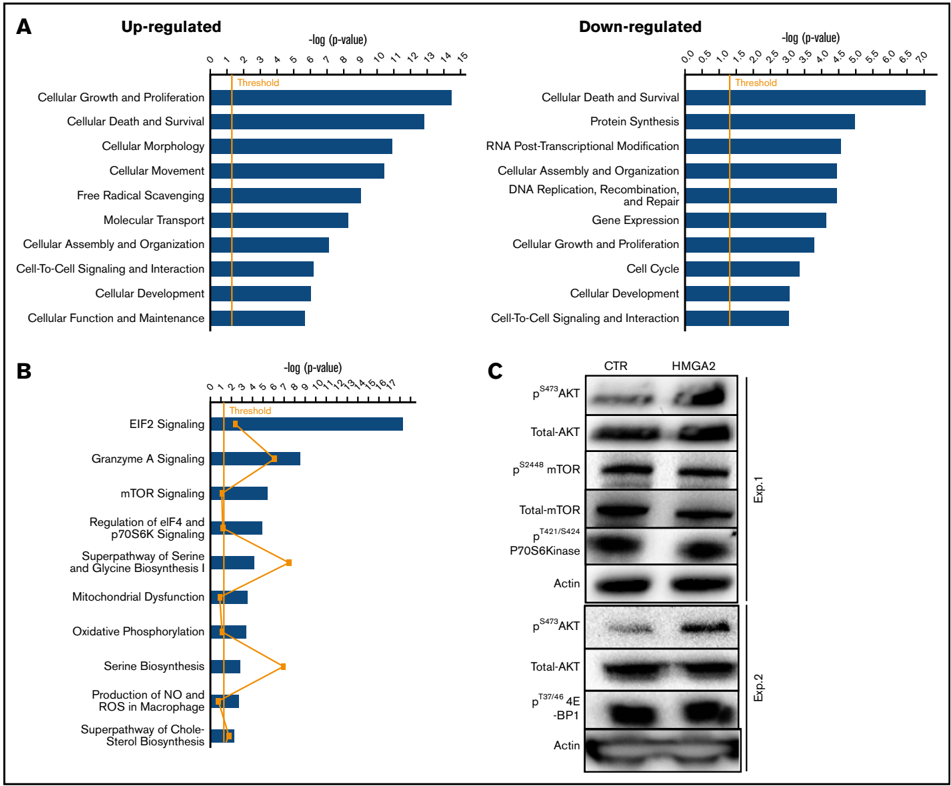
Identification of determinants of fate choices in hematopoietic stem cells (HSCs) is essential to improve the clinical use of HSCs and to enhance our understanding of the biology of normal and malignant hematopoiesis. Here, we show that high-mobility group AT hook 2 (HMGA2), a nonhistone chromosomal-binding protein, is highly and preferentially expressed in HSCs and in the most immature progenitor cell subset of fetal, neonatal, and adult human hematopoiesis. Knockdown of HMGA2 by short hairpin RNA impaired the long-term hematopoietic reconstitution of cord blood (CB)–derived CB CD34+ cells. Conversely, overexpression of HMGA2 in CB CD34+ cells led to overall enhanced reconstitution in serial transplantation assays accompanied by a skewing toward the myeloerythroid lineages. RNA-sequencing analysis showed that enforced HMGA2 expression in CD34+ cells induced gene-expression signatures associated with differentiation toward megakaryocyte-erythroid and myeloid lineages, as well as signatures associated with growth and survival, which at the protein level were coupled with strong activation of AKT. Taken together, our findings demonstrate a key role of HMGA2 in regulation of both proliferation and differentiation of human HSPCs.
Overview
The claims and statistics of this paper haven’t been checked yet.
Run the check — free, no account needed. It reads the open-access text and checks the sources it cites.
Integrity signals
Registry
Cites
Statistics
Figures
Verification
Claims the paper makes
The claims and statistics of this paper haven’t been checked yet.
Run the check — free, no account needed. It reads the open-access text and checks the sources it cites.
Claims other papers make about this one
Each is checked against this paper’s own text: does it say what the citing paper says it does?
In the citing paper
“Accordingly, genes with roles in myeloid biasing, such as Hmga2 were upregulated with and without IL1β stimulation while Hlf was upregulated upon IL1β stimulation alone in Tet2-KO HSCs relative to WT (Supplementary Fig. 8e)30,31.”
From Clonal hematopoiesis related TET2 loss-of-function impedes IL1β-mediated epigenetic reprogramming in hematopoietic stem and progenitor cells (2023) · cites this paper as [31]
Self-check
Percentages, sums and reported differences re-computed from the paper’s own numbers.
The self-check needs the paper’s full text.
Citations
Cites
Hematopoiesis: An Evolving Paradigm for Stem Cell Biology
Orkin, S. H., & Zon, L. I. (2008) · Cell · doi:10.1016/j.cell.2008.01.025 · Cited by 2,570
Transfusion independence and HMGA2 activation after gene therapy of human β-thalassaemia
Cavazzana-Calvo, M., Payen, E., Negre, O., Wang, G., Hehir, K., Fusil, F., Down, J., Denaro, M., Brady, T., Westerman, K., et al. (2010) · Nature · doi:10.1038/nature09328 · Cited by 1,276
Densely Interconnected Transcriptional Circuits Control Cell States in Human Hematopoiesis
Novershtern, N., Subramanian, A., Lawton, L. N., Mak, R. H., Haining, W. N., McConkey, M. E., Habib, N., Yosef, N., Chang, C. Y., Shay, T., et al. (2011) · Cell · doi:10.1016/j.cell.2011.01.004 · Cited by 942
Research works printed but not linked: 20
- Pfannkuche, 2009, The high mobility group protein HMGA2: a co-regulator of chromatin structure and pluripotency in stem cells?, Stem Cell Rev, 5, 224, 10.1007/s12015-009-9078-9 · DOI
- Li, 2012, An HMGA2-IGF2BP2 axis regulates myoblast proliferation and myogenesis, Dev Cell, 23, 1176, 10.1016/j.devcel.2012.10.019 · DOI
- Nishino, 2008, Hmga2 promotes neural stem cell self-renewal in young but not old mice by reducing p16Ink4a and p19Arf Expression, Cell, 135, 227, 10.1016/j.cell.2008.09.017 · DOI
- Ikeda, 2011, 3'UTR-truncated Hmga2 cDNA causes MPN-like hematopoiesis by conferring a clonal growth advantage at the level of HSC in mice, Blood, 117, 5860, 10.1182/blood-2011-02-334425 · DOI
- Copley, 2013, The Lin28b-let-7-Hmga2 axis determines the higher self-renewal potential of fetal haematopoietic stem cells, Nat Cell Biol, 15, 916, 10.1038/ncb2783 · DOI
- Lam, 2014, Hmga2 is a direct target gene of RUNX1 and regulates expansion of myeloid progenitors in mice, Blood, 124, 2203, 10.1182/blood-2014-02-554543 · DOI
- Rowe, 2016, Developmental regulation of myeloerythroid progenitor function by the Lin28b-let-7-Hmga2 axis, J Exp Med, 213, 1497, 10.1084/jem.20151912 · DOI
- Kim, 2013, TopHat2: accurate alignment of transcriptomes in the presence of insertions, deletions and gene fusions, Genome Biol, 14, R36, 10.1186/gb-2013-14-4-r36 · DOI · Paper page
- Anders, 2010, Differential expression analysis for sequence count data, Genome Biol, 11, R106, 10.1186/gb-2010-11-10-r106 · DOI · Paper page
- Laurenti, 2013, The transcriptional architecture of early human hematopoiesis identifies multilevel control of lymphoid commitment, Nat Immunol, 14, 756, 10.1038/ni.2615 · DOI
- Kumar, 2007, Impaired microRNA processing enhances cellular transformation and tumorigenesis, Nat Genet, 39, 673, 10.1038/ng2003 · DOI
- Kumar, 2008, Suppression of non-small cell lung tumor development by the let-7 microRNA family, Proc Natl Acad Sci USA, 105, 3903, 10.1073/pnas.0712321105 · DOI
- Viswanathan, 2009, Lin28 promotes transformation and is associated with advanced human malignancies, Nat Genet, 41, 843, 10.1038/ng.392 · DOI
- Wang, 2010, Dynamics of gene-modified progenitor cells analyzed by tracking retroviral integration sites in a human SCID-X1 gene therapy trial, Blood, 115, 4356, 10.1182/blood-2009-12-257352 · DOI
- Yu, 2013, HMGA2 regulates the in vitro aging and proliferation of human umbilical cord blood-derived stromal cells through the mTOR/p70S6K signaling pathway, Stem Cell Res, 10, 156, 10.1016/j.scr.2012.11.002 · DOI
- Tan, 2016, Amplified HMGA2 promotes cell growth by regulating Akt pathway in AML, J Cancer Res Clin Oncol, 142, 389, 10.1007/s00432-015-2036-9 · DOI
- Buitenhuis, 2009, The role of the PI3K-PKB signaling module in regulation of hematopoiesis, Cell Cycle, 8, 560, 10.4161/cc.8.4.7654 · DOI
- Juntilla, 2010, AKT1 and AKT2 maintain hematopoietic stem cell function by regulating reactive oxygen species, Blood, 115, 4030, 10.1182/blood-2009-09-241000 · DOI · Paper page
- Li, 2011, Quiescence regulators for hematopoietic stem cell, Exp Hematol, 39, 511, 10.1016/j.exphem.2011.01.008 · DOI
- Lechman, 2012, Attenuation of miR-126 activity expands HSC in vivo without exhaustion, Cell Stem Cell, 11, 799, 10.1016/j.stem.2012.09.001 · DOI · Paper page
Cited by
McClatchy, J., Strogantsev, R., Wolfe, E., Lin, H. Y., Mohammadhosseini, M., Davis, B. A., Eden, C., Goldman, D., Fleming, W. H., Conley, P., et al. (2023) · Nature Communications · doi:10.1038/s41467-023-43697-y · Cited by 95
Metadata
- Authors
- Kumar, P., Beck, D., Galeev, R., Thoms, J. A. I., Talkhoncheh, M. S., de Jong, I., Unnikrishnan, A., Baudet, A., Subramaniam, A., Pimanda, J. E., & Larsson, J.
- Venue
- Blood Advances
- Publisher
- American Society of Hematology
- Published
- 2019-02-26
- Volume
- 3
- Issue
- 4
- Pages
- 681-691
- ISSN
- 2473-9529
- 2473-9537
- Cited by
- 30
- References
- 3
- Language
- en
About these checks
Registry, retraction, Cites and statistics results are computed, not judged, with one exception: a printed reference that no index lists is read once by a model before it counts as a citation error. Claims are extracted by a model and kept only when their quote appears verbatim in the text; each cited source is then checked, with a model’s help, for whether it says what the claim relies on. Those verdicts can be wrong — read the claim’s quote and the cited source before relying on one.
Statistics and arithmetic are recomputed, not judged.
Confidence bands are shown only for fields calibrated on our annotated test set. None is calibrated yet, so no band is shown.
What counts as a claim ›How we measure confidence ›How we check this ›
Are you an author, or do you see a problem with this page? Request a review
