

The DOI matches its Crossref record; 14 of the 14 references it cites were found in a registry or an index.
Rapid removal of phagosomal ferroportin in macrophages contributes to nutritional immunity
Abstract
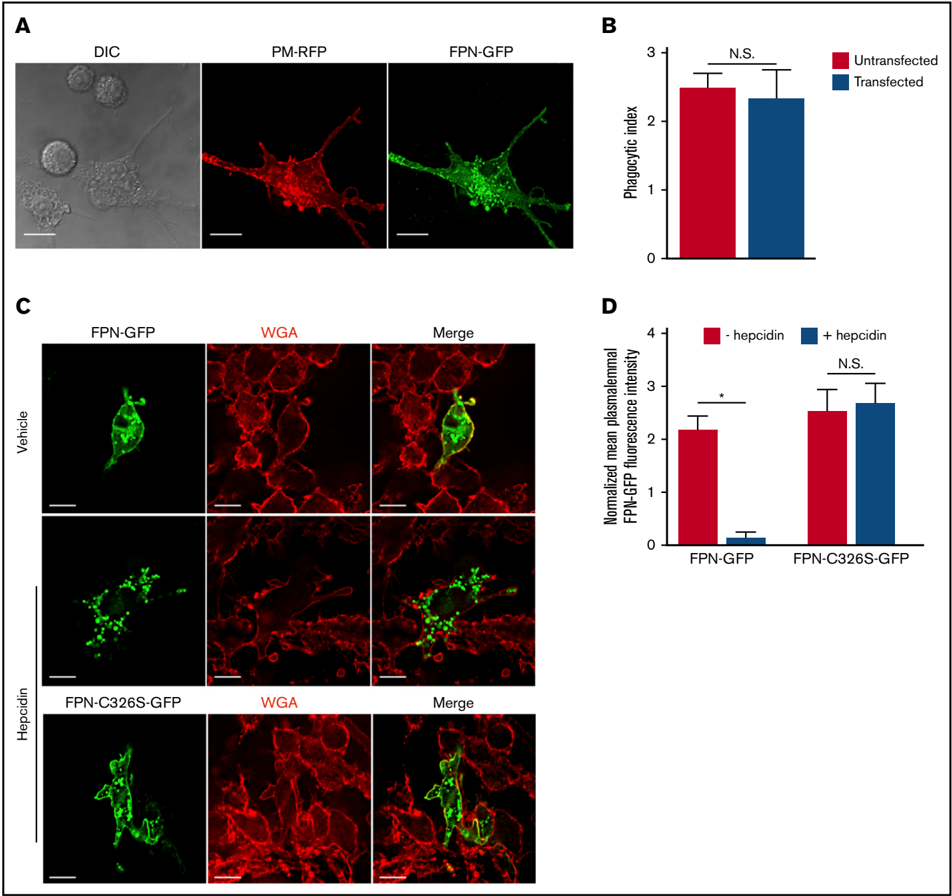
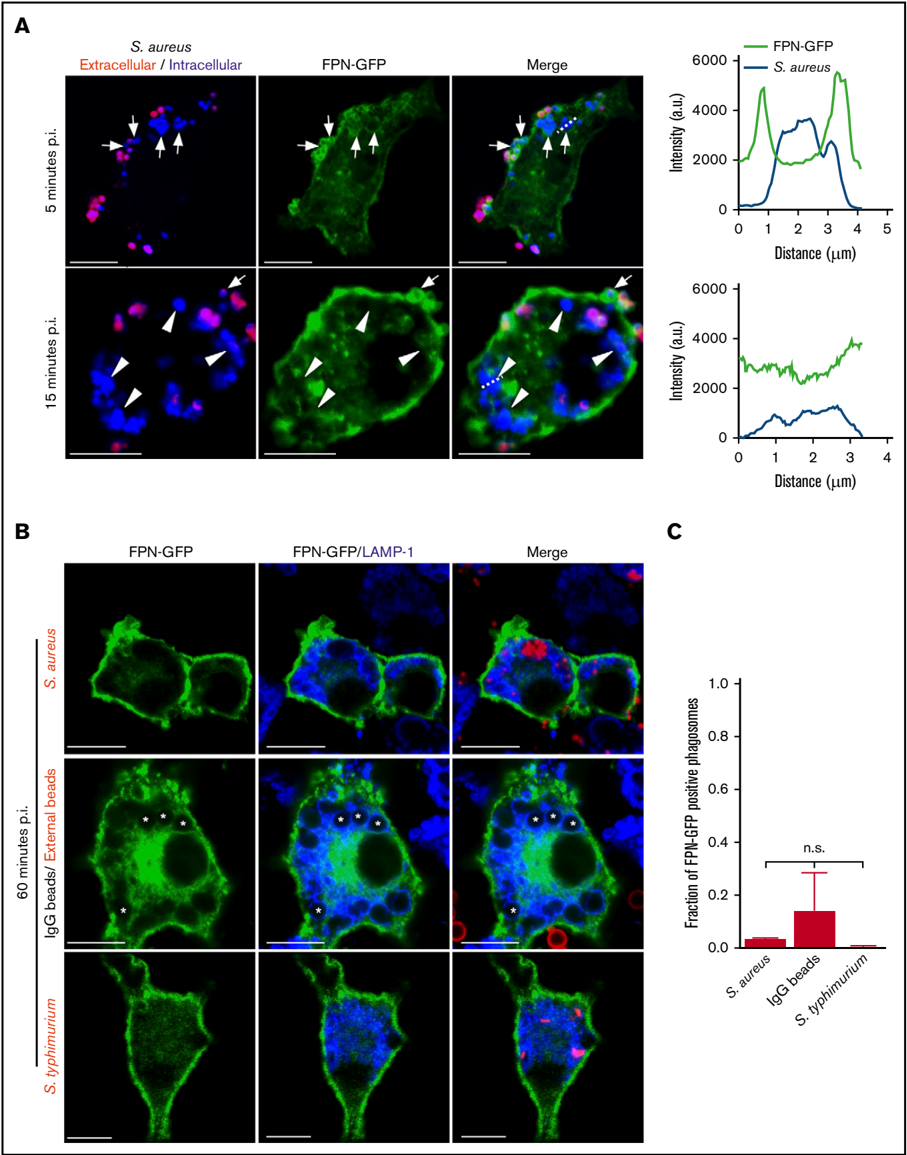
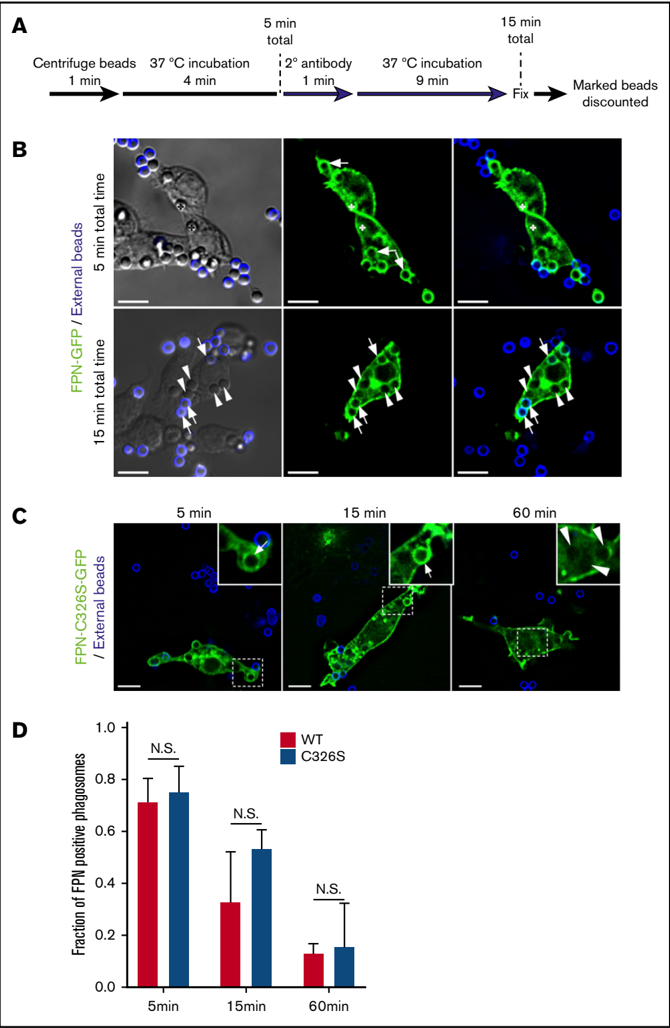
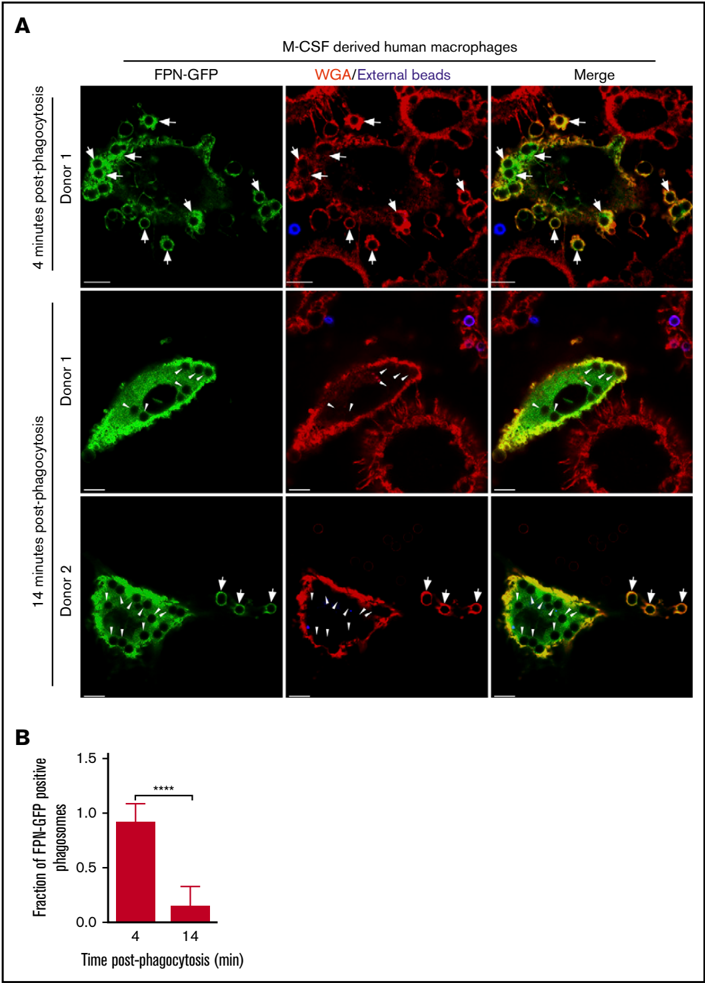
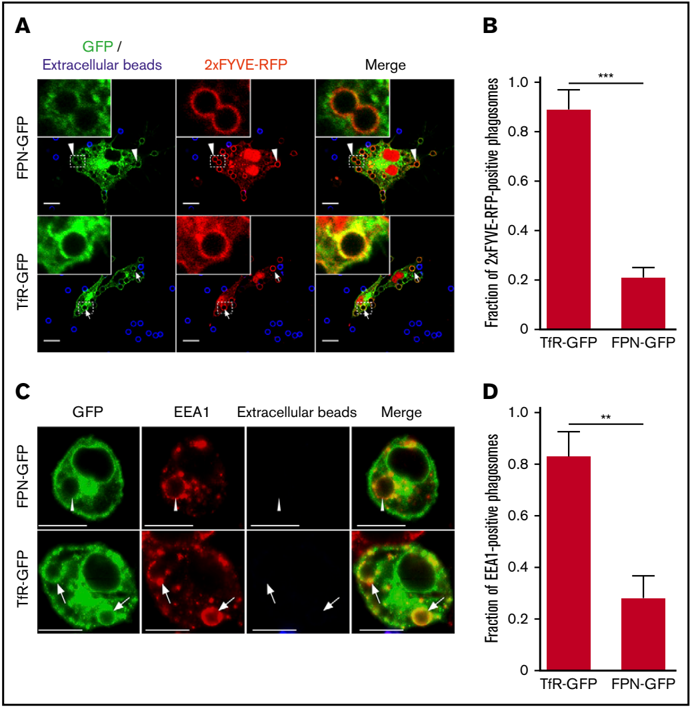
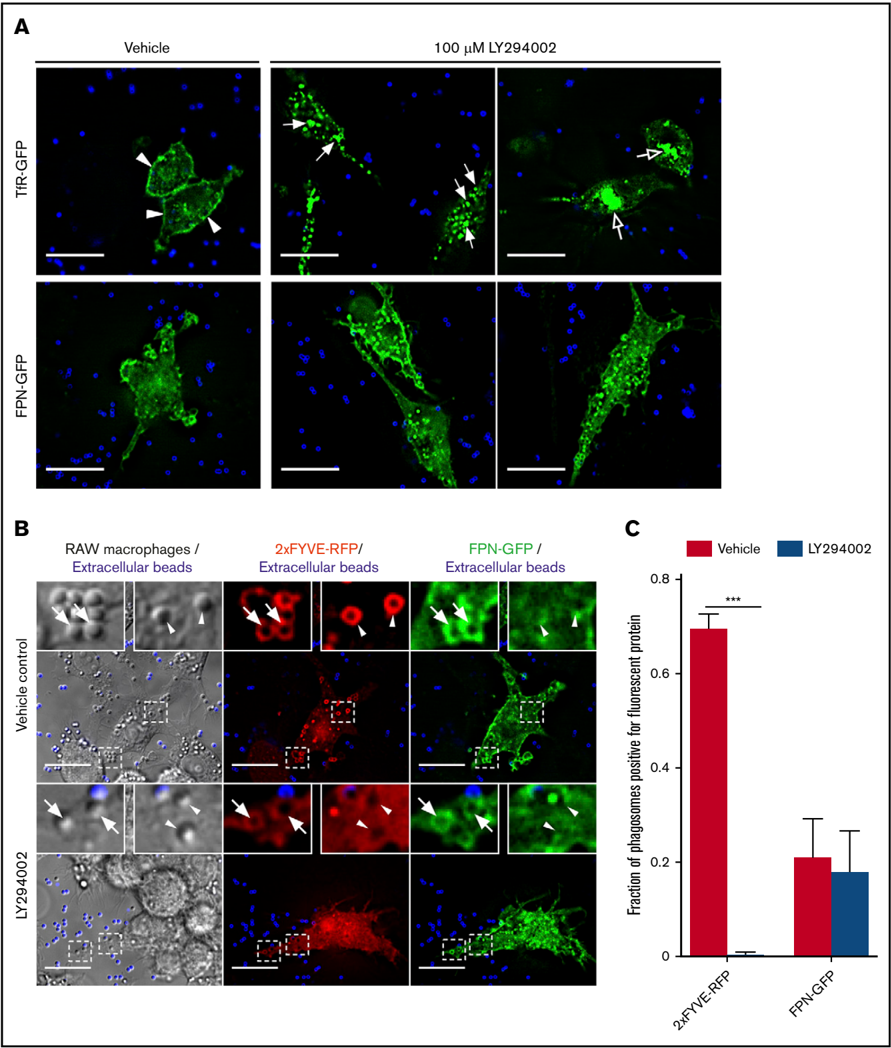
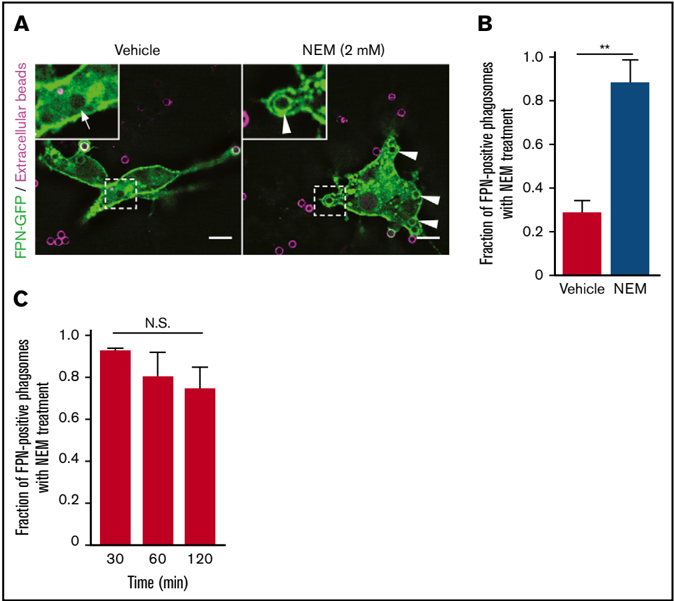
Nutrient sequestration is an essential facet of host innate immunity. Macrophages play a critical role in controlling iron availability through expression of the iron transport protein ferroportin (FPN), which extrudes iron from the cytoplasm to the extracellular milieu. During phagocytosis, the limiting phagosomal membrane, which derives from the plasmalemma, can be decorated with FPN and, if functional, will move iron from the cytosol into the phagosome lumen. This serves to feed iron to phagocytosed microbes and would be counterproductive to the many other known host mechanisms working to starve microbes of this essential metal. To understand how FPN is regulated during phagocytosis, we expressed FPN as a green fluorescent protein–fusion protein in macrophages and monitored its localization during uptake of various phagocytic targets, including Staphylococcus aureus, Salmonella enterica serovar Typhimurium, human erythrocytes, and immunoglobulin G opsonized latex beads. We find that FPN is rapidly removed, independently of Vps34 and PI(3)P, from early phagosomes and does not follow recycling pathways that regulate transferrin receptor recycling. Live-cell video microscopy showed that FPN movement on the phagosome is dynamic, with punctate and tubular structures forming before FPN is trafficked back to the plasmalemma. N-ethylmaleimide–sensitive factor, which disrupts soluble NSF attachment protein receptor (SNARE)–mediated membrane fusion and trafficking, prevented FPN removal from the phagosome. Our data support the hypothesis that removal of FPN from the limiting phagosomal membrane will, at the cellular level, ensure that iron cannot be pumped into phagosomes. We propose this as yet another mechanism of host nutritional immunity to subvert microbial growth.
Overview
The claims and statistics of this paper haven’t been checked yet.
Run the check — free, no account needed. It reads the open-access text and checks the sources it cites.
Integrity signals
Registry
Cites
Statistics
Figures
Verification
Claims the paper makes
The claims and statistics of this paper haven’t been checked yet.
Run the check — free, no account needed. It reads the open-access text and checks the sources it cites.
Claims other papers make about this one
Each is checked against this paper’s own text: does it say what the citing paper says it does?
In the citing paper
“According to a study, FPN is quickly removed from the phagosomal barrier by macrophages, which stops Fe from extruding into the phagosome lumen. This might contribute to the expanding list of host mechanisms of nutritional immunity by further limiting the uptake of iron by bacteria (Flannagan et al. 2021).”
From Nutritional Immunity in Wound Infection: Unveiling the Role of Dietary Elements in Host–Pathogen Interaction (2025) · cites this paper as Flannagan et al. 2021
Self-check
Percentages, sums and reported differences re-computed from the paper’s own numbers.
The self-check needs the paper’s full text.
Citations
Cites
Nemeth, E., Rivera, S., Gabayan, V., Keller, C., Taudorf, S., Pedersen, B. K., & Ganz, T. (2004) · Journal of Clinical Investigation · doi:10.1172/jci200420945 · Cited by 2,650 · cited 1×
“During infection, hepcidin, an acute phase protein, is upregulated in response to infection and inflammation, and the subsequent internalization of FPN contributes to the host Fe withholding response.(10) Given macrophages are important phagocytic cells that comprise part of the immediate antibacterial immune response…”
BackgroundHepcidin, a key regulator of iron metabolism and mediator of anemia of inflammation
Ganz, T. (2003) · Blood · doi:10.1182/blood-2003-03-0672 · Cited by 1,544
Nutritional immunity: transition metals at the pathogen–host interface
Hood, M. I., & Skaar, E. P. (2012) · Nature Reviews Microbiology · doi:10.1038/nrmicro2836 · Cited by 1,535
The iron exporter ferroportin/Slc40a1 is essential for iron homeostasis
Donovan, A., Lima, C. A., Pinkus, J. L., Pinkus, G. S., Zon, L. I., Robine, S., & Andrews, N. C. (2005) · Cell Metabolism · doi:10.1016/j.cmet.2005.01.003 · Cited by 1,275
The Molecular Mechanism of Hepcidin-mediated Ferroportin Down-Regulation
De Domenico, I., Ward, D. M., Langelier, C., Vaughn, M. B., Nemeth, E., Sundquist, W. I., Ganz, T., Musci, G., & Kaplan, J. (2007) · Molecular Biology of the Cell · doi:10.1091/mbc.e07-01-0060 · Cited by 434
Heme Synthesis and Acquisition in Bacterial Pathogens
Choby, J. E., & Skaar, E. P. (2016) · Journal of Molecular Biology · doi:10.1016/j.jmb.2016.03.018 · Cited by 343
Hepcidin-Induced Endocytosis of Ferroportin Is Dependent on Ferroportin Ubiquitination
Qiao, B., Sugianto, P., Fung, E., del-Castillo-Rueda, A., Moran-Jimenez, M.-J., Ganz, T., & Nemeth, E. (2012) · Cell Metabolism · doi:10.1016/j.cmet.2012.03.018 · Cited by 334
The molecular basis of ferroportin-linked hemochromatosis
De Domenico, I., Ward, D. M., Nemeth, E., Vaughn, M. B., Musci, G., Ganz, T., & Kaplan, J. (2005) · Proceedings of the National Academy of Sciences · doi:10.1073/pnas.0503804102 · Cited by 230
Iron acquisition strategies of bacterial pathogens
Sheldon, J. R., Laakso, H. A., & Heinrichs, D. E. (2016) · Microbiology Spectrum · doi:10.1128/microbiolspec.vmbf-0010-2015 · Cited by 219
Nairz, M., Schleicher, U., Schroll, A., Sonnweber, T., Theurl, I., Ludwiczek, S., Talasz, H., Brandacher, G., Moser, P. L., Muckenthaler, M. U., et al. (2013) · Journal of Experimental Medicine · doi:10.1084/jem.20121946 · Cited by 204
Research works printed but not linked: 45
- Weinberg, 1974, Iron and susceptibility to infectious disease, Science, 184, 952, 10.1126/science.184.4140.952 · DOI · Paper page
- Flannagan, 2015, Antimicrobial mechanisms of macrophages and the immune evasion strategies of Staphylococcus aureus, Pathogens, 4, 826, 10.3390/pathogens4040826 · DOI
- Jabado, 2000, Natural resistance to intracellular infections: natural resistance-associated macrophage protein 1 (Nramp1) functions as a pH-dependent manganese transporter at the phagosomal membrane, J Exp Med, 192, 1237, 10.1084/jem.192.9.1237 · DOI · Paper page
- Gruenheid, 1997, Natural resistance to infection with intracellular pathogens: the Nramp1 protein is recruited to the membrane of the phagosome, J Exp Med, 185, 717, 10.1084/jem.185.4.717 · DOI · Paper page
- Delaby, 2005, Presence of the iron exporter ferroportin at the plasma membrane of macrophages is enhanced by iron loading and down-regulated by hepcidin, Blood, 106, 3979, 10.1182/blood-2005-06-2398 · DOI · Paper page
- Nemeth, 2004, Hepcidin regulates cellular iron efflux by binding to ferroportin and inducing its internalization, Science, 306, 2090, 10.1126/science.1104742 · DOI · Paper page
- Bridle, 2003, Disrupted hepcidin regulation in HFE-associated haemochromatosis and the liver as a regulator of body iron homoeostasis, Lancet, 361, 669, 10.1016/S0140-6736(03)12602-5 · DOI · Paper page
- Khan, 2007, Association of hemochromatosis with infectious diseases: expanding spectrum, Int J Infect Dis, 11, 482, 10.1016/j.ijid.2007.04.007 · DOI · Paper page
- Knutson, 2005, Iron release from macrophages after erythrophagocytosis is up-regulated by ferroportin 1 overexpression and down-regulated by hepcidin, Proc Natl Acad Sci USA, 102, 1324, 10.1073/pnas.0409409102 · DOI · Paper page
- Chlosta, 2006, The iron efflux protein ferroportin regulates the intracellular growth of Salmonella enterica, Infect Immun, 74, 3065, 10.1128/IAI.74.5.3065-3067.2006 · DOI · Paper page
- Boles, 2008, Agr-mediated dispersal of Staphylococcus aureus biofilms, PLoS Pathog, 4, e1000052, 10.1371/journal.ppat.1000052 · DOI
- Birmingham, 2006, Autophagy controls Salmonella infection in response to damage to the Salmonella-containing vacuole, J Biol Chem, 281, 11374, 10.1074/jbc.M509157200 · DOI · Paper page
- Flannagan, 2016, Intracellular replication of Staphylococcus aureus in mature phagolysosomes in macrophages precedes host cell death, and bacterial escape and dissemination, Cell Microbiol, 18, 514, 10.1111/cmi.12527 · DOI
- Flannagan, 2018, A fluorescence based-proliferation assay for the identification of replicating bacteria within host cells, Front Microbiol, 9, 3084, 10.3389/fmicb.2018.03084 · DOI
- Flannagan, 2018, Staphylococcus aureus uses the GraXRS regulatory system to sense and adapt to the acidified phagolysosome in macrophages, MBio, 9, e01143, 10.1128/mBio.01143-18 · DOI
- Surewaard, 2016, Identification and treatment of the Staphylococcus aureus reservoir in vivo [published correction appears in J Exp Med. 2016;213(13):3087], J Exp Med, 213, 1141, 10.1084/jem.20160334 · DOI
- Fernandes, 2009, The molecular basis of hepcidin-resistant hereditary hemochromatosis, Blood, 114, 437, 10.1182/blood-2008-03-146134 · DOI
- Sham, 2009, Hereditary hemochromatosis due to resistance to hepcidin: high hepcidin concentrations in a family with C326S ferroportin mutation, Blood, 114, 493, 10.1182/blood-2009-04-216226 · DOI
- Lim, 2018, The hepcidin-ferroportin axis controls the iron content of Salmonella-containing vacuoles in macrophages, Nat Commun, 9, 2091, 10.1038/s41467-018-04446-8 · DOI · Paper page
- Flannagan, 2020, Macrophage-driven nutrient delivery to phagosomal Staphylococcus aureus supports bacterial growth, EMBO Rep, 21, e50348, 10.15252/embr.202050348 · DOI
- Goncheva, 2020, De novo purine biosynthesis is required for intracellular growth of Staphylococcus aureus and for the hypervirulence phenotype of a purR mutant, Infect. Immun, 88, e00104, 10.1128/IAI.00104-20 · DOI
- Morita, 2012, Attenuated protein expression vectors for use in siRNA rescue experiments, Biotechniques, 0, 1
- Abreu, 2018, Role of the hepcidin-ferroportin axis in pathogen-mediated intracellular iron sequestration in human phagocytic cells, Blood Adv, 2, 1089, 10.1182/bloodadvances.2017015255 · DOI
- Vieira, 2001, Distinct roles of class I and class III phosphatidylinositol 3-kinases in phagosome formation and maturation, J Cell Biol, 155, 19, 10.1083/jcb.200107069 · DOI
- Ketel, 2016, A phosphoinositide conversion mechanism for exit from endosomes, Nature, 529, 408, 10.1038/nature16516 · DOI · Paper page
- Naughtin, 2010, The myotubularin phosphatase MTMR4 regulates sorting from early endosomes, J Cell Sci, 123, 3071, 10.1242/jcs.060103 · DOI
- Cao, 2008, Sequential actions of myotubularin lipid phosphatases regulate endosomal PI(3)P and growth factor receptor trafficking, Mol Biol Cell, 19, 3334, 10.1091/mbc.e08-04-0367 · DOI
- van Dam, 2002, Endocytosed transferrin receptors recycle via distinct dynamin and phosphatidylinositol 3-kinase-dependent pathways, J Biol Chem, 277, 48876, 10.1074/jbc.M206271200 · DOI
- Schlam, 2015, Phosphoinositide 3-kinase enables phagocytosis of large particles by terminating actin assembly through Rac/Cdc42 GTPase-activating proteins, Nat Commun, 6, 8623, 10.1038/ncomms9623 · DOI
- Morgan, 2004, Membrane traffic: controlling membrane fusion by modifying NSF, Curr Biol, 14, R968, 10.1016/j.cub.2004.10.045 · DOI
- Coppolino, 2001, Requirement for N-ethylmaleimide-sensitive factor activity at different stages of bacterial invasion and phagocytosis, J Biol Chem, 276, 4772, 10.1074/jbc.M007792200 · DOI
- Sarantis, 2012, Yersinia entry into host cells requires Rab5-dependent dephosphorylation of PI(4,5)P2 and membrane scission, Cell Host Microbe, 11, 117, 10.1016/j.chom.2012.01.010 · DOI
- Weinberg, 1975, Nutritional immunity. Host’s attempt to withold iron from microbial invaders, JAMA, 231, 39, 10.1001/jama.1975.03240130021018 · DOI · Paper page
- Paradkar, 2008, Iron depletion limits intracellular bacterial growth in macrophages, Blood, 112, 866, 10.1182/blood-2007-12-126854 · DOI · Paper page
- Kim, 2014, Inverse agonist of estrogen-related receptor γ controls Salmonella typhimurium infection by modulating host iron homeostasis, Nat Med, 20, 419, 10.1038/nm.3483 · DOI · Paper page
- Nairz, 2008, Interferon-gamma limits the availability of iron for intramacrophage Salmonella typhimurium, Eur J Immunol, 38, 1923, 10.1002/eji.200738056 · DOI · Paper page
- Sheldon, 2015, Recent developments in understanding the iron acquisition strategies of gram positive pathogens, FEMS Microbiol Rev, 39, 592, 10.1093/femsre/fuv009 · DOI · Paper page
- Gallois, 2001, Salmonella pathogenicity island 2-encoded type III secretion system mediates exclusion of NADPH oxidase assembly from the phagosomal membrane, J Immunol, 166, 5741, 10.4049/jimmunol.166.9.5741 · DOI
- Vazquez-Torres, 2000, Salmonella pathogenicity island 2-dependent evasion of the phagocyte NADPH oxidase, Science, 287, 1655, 10.1126/science.287.5458.1655 · DOI
- Waterman, 2003, Functions and effectors of the Salmonella pathogenicity island 2 type III secretion system, Cell Microbiol, 5, 501, 10.1046/j.1462-5822.2003.00294.x · DOI
- Liss, 2015, Take the tube: remodelling of the endosomal system by intracellular Salmonella enterica, Cell Microbiol, 17, 639, 10.1111/cmi.12441 · DOI
- Grinstein, 1985, Chemical modification of the Na+/H+exchanger of thymic lymphocytes. Inhibition by N-ethylmaleimide, Biochim BiophysActa, 812, 213, 10.1016/0005-2736(85)90541-3 · DOI
- Bowes, 2005, Induction of mitochondrial fusion by cysteine-alkylators ethacrynic acid and N-ethylmaleimide, J Cell Physiol, 202, 796, 10.1002/jcp.20178 · DOI
- Band, 2001, Inhibition of the membrane fusion machinery prevents exit from the TGN and proteolytic processing by furin, FEBS Lett, 505, 118, 10.1016/S0014-5793(01)02798-3 · DOI
- Gibon, 2010, The thiol-modifying agent N-ethylmaleimide elevates the cytosolic concentration of free Zn(2+) but not of Ca(2+) in murine cortical neurons, Cell Calcium, 48, 37, 10.1016/j.ceca.2010.06.004 · DOI
Cited by
Sorted by citations
Chen, C., Hu, X., He, D., He, X., & Shen, L. (2025) · Food Science & Nutrition · doi:10.1002/fsn3.70854 · Cited by 6
Metadata
- Authors
- Flannagan, R. S., Farrell, T. J., Trothen, S. M., Dikeakos, J. D., & Heinrichs, D. E.
- Venue
- Blood Advances
- Publisher
- American Society of Hematology
- Published
- 2021-01-21
- Volume
- 5
- Issue
- 2
- Pages
- 459-474
- ISSN
- 2473-9529
- 2473-9537
- Cited by
- 31
- References
- 14
- Language
- en
About these checks
Registry, retraction, Cites and statistics results are computed, not judged, with one exception: a printed reference that no index lists is read once by a model before it counts as a citation error. Claims are extracted by a model and kept only when their quote appears verbatim in the text; each cited source is then checked, with a model’s help, for whether it says what the claim relies on. Those verdicts can be wrong — read the claim’s quote and the cited source before relying on one.
Statistics and arithmetic are recomputed, not judged.
Confidence bands are shown only for fields calibrated on our annotated test set. None is calibrated yet, so no band is shown.
What counts as a claim ›How we measure confidence ›How we check this ›
Are you an author, or do you see a problem with this page? Request a review
How to cite
Cite CoChat for the checks on this page, and the paper for its own findings.
- This page
- CoChat. (2026). Citation check: Rapid removal of phagosomal ferroportin in macrophages contributes to nutritional immunity. https://app.cochat.ai/papers/10.1182/bloodadvances.2020002833
- The paper
- Flannagan, R. S., Farrell, T. J., Trothen, S. M., Dikeakos, J. D., & Heinrichs, D. E. (2021). Rapid removal of phagosomal ferroportin in macrophages contributes to nutritional immunity. Blood Advances. https://doi.org/10.1182/bloodadvances.2020002833
