

The DOI matches its Crossref record; 45 of the 45 references it cites were found in a registry or an index.
Early life exposure to air pollution and incidence of childhood asthma, allergic rhinitis and eczema
Open accessAbstract
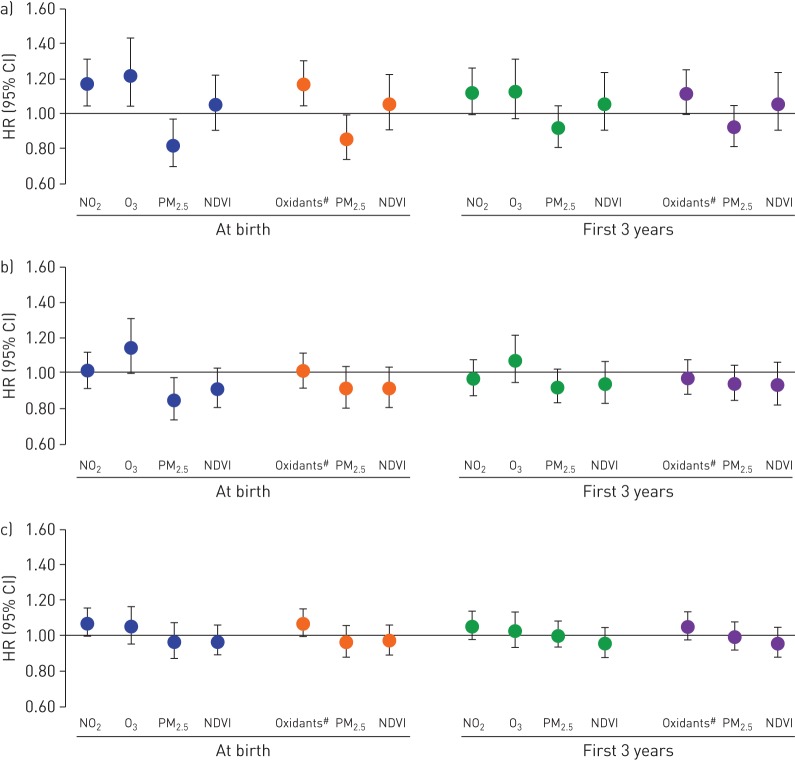
Rationale: There is growing evidence that air pollution may contribute to the development of childhood asthma and other allergic diseases. In this follow-up of the Toronto Child Health Evaluation Questionnaire (T-CHEQ) study, we examined associations between early life exposures to air pollution and incidence of asthma, allergic rhinitis and eczema from birth through adolescence. Methods: 1286 T-CHEQ participants were followed from birth until outcome (March 31, 2016) or loss to follow-up, with a mean of 17 years of follow-up. Concentrations of nitrogen dioxide (NO 2), ozone (O 3) and particulate matter with a 50% cut-off aerodynamic diameter of 2.5 µm (PM 2.5) from January 1, 1999 to December 31, 2012 were assigned to participants based on their postal codes at birth using ground observations, chemical/meteorological models, remote sensing and land-use regression models. Study outcomes included incidence of physician-diagnosed asthma, allergic rhinitis and eczema. Cox proportional hazard regression models were used to estimate hazard ratios per interquartile range of exposures and outcomes, adjusting for potential confounders. Results: Hazard ratios of 1.17 (95% CI 1.05–1.31) for asthma and 1.07 (95% CI 0.99–1.15) for eczema were observed for total oxidants (O 3 and NO 2) at birth. No significant increase in risk was found for PM 2.5. Conclusions: Exposures to oxidant air pollutants (O 3 and NO 2) but not PM 2.5 were associated with an increased risk of incident asthma and eczema in children. This suggests that improving air quality may contribute to the prevention of asthma and other allergic disease in childhood and adolescence.
Overview
The claims and statistics of this paper haven’t been checked yet.
Run the check — free, no account needed. It reads the open-access text and checks the sources it cites.
Integrity signals
Registry
Cites
Statistics
Figures
Verification
Claims the paper makes
The claims and statistics of this paper haven’t been checked yet.
Run the check — free, no account needed. It reads the open-access text and checks the sources it cites.
Claims other papers make about this one
Each is checked against this paper’s own text: does it say what the citing paper says it does?
The source backs part of the claim, not all of it — or backs it for a different population, condition or comparison.
In the citing paper
“Likewise, studies in Europe and North America have demonstrated that chronic exposure to nitrogen dioxide and ozone contributes to inflammatory dermatoses [6,7].”
From The Environmental Determinants of Skin Health: Linking Climate Change, Air Pollution, and the Dermatologic Disease Burden (2025) · cites this paper as [6]
Experimental — accuracy not yet measured
Self-check
Percentages, sums and reported differences re-computed from the paper’s own numbers.
The self-check needs the paper’s full text.
Citations
Cites
Ambient air pollution: a global assessment of exposure and burden of disease
World Health Organization (2016) · Clean Air Journal · doi:10.17159/2410-972x/2016/v26n2a4 · Cited by 2,041
Standard Electrode Potentials and Temperature Coefficients in Water at 298.15 K
Bratsch, S. G. (1989) · Journal of Physical and Chemical Reference Data · doi:10.1063/1.555839 · Cited by 1,589
Checking the Cox model with cumulative sums of martingale-based residuals
LIN, D. Y., WEI, L. J., & YING, Z. (1993) · Biometrika · doi:10.1093/biomet/80.3.557 · Cited by 1,432
Khreis, H., Kelly, C., Tate, J., Parslow, R. C., Lucas, K., & Nieuwenhuijsen, M. J. (2016) · Environment International · doi:10.1016/j.envint.2016.11.012 · Cited by 812
Oxidative stress and air pollution exposure
Lodovici, M., & Bigagli, E. (2011) · Journal of Toxicology · doi:10.1155/2011/487074 · Cited by 720
Improving local air quality in cities: To tree or not to tree?
Vos, P., Maiheu, B., Vankerkom, J., & Janssen, S. (2012) · Environmental Pollution · doi:10.1016/j.envpol.2012.10.021 · Cited by 595
Particulate Matter–Induced Health Effects: Who Is Susceptible?
Sacks, J. D., Stanek, L. W., Luben, T. J., Johns, D. O., Buckley, B. J., Brown, J. S., & Ross, M. (2010) · Environmental Health Perspectives · doi:10.1289/ehp.1002255 · Cited by 578
Thurston, G. D., Kipen, H. M., Annesi‐Maesano, I., Balmes, J. R., Brook, R. D., Cromar, K. R., Matteis, S. D., Forastiere, F., Forsberg, B., Frampton, M. W., et al. (2016) · European Respiratory Journal · doi:10.1183/13993003.00419-2016 · Cited by 569
Bowatte, G., Lodge, C., Lowe, A. J., Erbas, B., Perret, J. L., Abramson, M. J., Matheson, M. C., & Dharmage, S. C. (2014) · Allergy · doi:10.1111/all.12561 · Cited by 479
International consensus on (ICON) pediatric asthma
Papadopoulos, N. G., Arakawa, H., Carlsen, K. ‐., Čustović, A., Gern, J. E., Lemanske, R. F., Souëf, P. N. L., Mäkelä, M. J., Roberts, G. C., Wong, G., et al. (2012) · Allergy · doi:10.1111/j.1398-9995.2012.02865.x · Cited by 473
Cited by
Sorted by citations
International consensus statement on allergy and rhinology: Allergic rhinitis – 2023
Wise, S. K., Damask, C. C., Roland, L. T., Ebert, C. S., Levy, J. M., Lin, S. Y., Luong, A., Rodriguez, K., Sedaghat, A. R., Toskala, E. M., et al. (2023) · International Forum of Allergy & Rhinology · doi:10.1002/alr.23090 · Cited by 584
Impact of Air Pollution on Asthma Outcomes
Tiotiu, A. I., Novakova, P. I., Nedeva, D., Chong‐Neto, H. J., Novakova, S. M., Steiropoulos, P., & Kowal, K. (2020) · International Journal of Environmental Research and Public Health · doi:10.3390/ijerph17176212 · Cited by 560
The role of air pollution (PM and NO2) in COVID-19 spread and lethality: A systematic review
Copat, C., Cristaldi, A., Fiore, M., Grasso, A., Zuccarello, P., Signorelli, S. S., Conti, G. O., & Ferrante, M. (2020) · Environmental Research · doi:10.1016/j.envres.2020.110129 · Cited by 519
Sözener, Z. Ç., Öztürk, B. Ö., Çerçi, P., Türk, M., Akın, B. G., Akdiş, M., Altıner, S., Yücel, Ü. Ö., Öğülür, İ., Mitamura, Y., et al. (2022) · Allergy · doi:10.1111/all.15240 · Cited by 455
Effects of air pollution on health: A mapping review of systematic reviews and meta-analyses
Dominski, F. H., Branco, J. H. L., Buonanno, G., Stabile, L., da Silva, M. G., & Andrade, A. (2021) · Environmental Research · doi:10.1016/j.envres.2021.111487 · Cited by 417
Metadata
- Authors
- To, T., Zhu, J., Stieb, D., Gray, N., Fong, I., Pinault, L., Jerrett, M., Robichaud, A., Ménard, R., van Donkelaar, A., Martin, R. V., Hystad, P., Brook, J. R., & Dell, S.
- Affiliations
- University of Toronto (CA)
- Hospital for Sick Children (CA)
- Statistics Canada (CA)
- University of California, Los Angeles (US)
- Environment and Climate Change Canada (CA)
- Dalhousie University (CA)
- Oregon State University (US)
- Corresponding author
- To, Teresa
- ORCID
- Venue
- European Respiratory Journal
- Publisher
- European Respiratory Society (ERS)
- Published
- 2019-12-05
- Volume
- 55
- Issue
- 2
- Pages
- 1900913
- ISSN
- 0903-1936 (ISSN-L)
- 1399-3003
- PMC
- PMC7031706
- OpenAlex
- W2992180822
- Cited by
- 156
- References
- 45
- Citations by year
- 2026: 12 · 2025: 18 · 2024: 29 · 2023: 31 · 2022: 24 · 2021: 28 · 2020: 14
- FWCI
- 7.13
- Type
- journal article
- Language
- en
- Open access
- hybrid
- doi.org
- Licence
- Locations
- European Respiratory Journal (publishedVersion, cc-by-nc)
- PubMed Central (publishedVersion, cc-by-nc)
- PubMed (publishedVersion)
- Funders
- Health Canada (HT421-163216/001/SS)
- Topics
- Physical Sciences › Environmental Science › Health, Toxicology and Mutagenesis › Air Quality and Health Impacts
- Health Sciences › Medicine › Pulmonary and Respiratory Medicine › Asthma and respiratory diseases
- Physical Sciences › Environmental Science › Health, Toxicology and Mutagenesis › Indoor Air Quality and Microbial Exposure
- Keywords
- air pollution, childhood asthma, allergic rhinitis, atopic dermatitis, early life exposure, nitrogen dioxide, ozone, PM2.5, allergic diseases, air quality, land use regression
- MeSH terms
- Adolescent, Air Pollutants, Air Pollution, Asthma, Child, Eczema, Environmental Exposure, Humans, Infant, Newborn, Nitrogen Dioxide, Incidence, Particulate Matter, Rhinitis, Allergic
About these checks
Registry, retraction, Cites and statistics results are computed, not judged, with one exception: a printed reference that no index lists is read once by a model before it counts as a citation error. Claims are extracted by a model and kept only when their quote appears verbatim in the text; each cited source is then checked, with a model’s help, for whether it says what the claim relies on. Those verdicts can be wrong — read the claim’s quote and the cited source before relying on one.
Statistics and arithmetic are recomputed, not judged.
Confidence bands are shown only for fields calibrated on our annotated test set. None is calibrated yet, so no band is shown.
What counts as a claim ›How we measure confidence ›How we check this ›
Are you an author, or do you see a problem with this page? Request a review
