

The DOI matches its Crossref record; 9 of the 9 references it cites were found in a registry or an index.
SolexaQA: At-a-glance quality assessment of Illumina second-generation sequencing data
Open accessAbstract
BACKGROUND: Illumina's second-generation sequencing platform is playing an increasingly prominent role in modern DNA and RNA sequencing efforts. However, rapid, simple, standardized and independent measures of run quality are currently lacking, as are tools to process sequences for use in downstream applications based on read-level quality data. RESULTS: We present SolexaQA, a user-friendly software package designed to generate detailed statistics and at-a-glance graphics of sequence data quality both quickly and in an automated fashion. This package contains associated software to trim sequences dynamically using the quality scores of bases within individual reads. CONCLUSION: The SolexaQA package produces standardized outputs within minutes, thus facilitating ready comparison between flow cell lanes and machine runs, as well as providing immediate diagnostic information to guide the manipulation of sequence data for downstream analyses.
Overview
The claims and statistics of this paper haven’t been checked yet.
Run the check — free, no account needed. It reads the open-access text and checks the sources it cites.
Integrity signals
Registry
Cites
Statistics
Figures
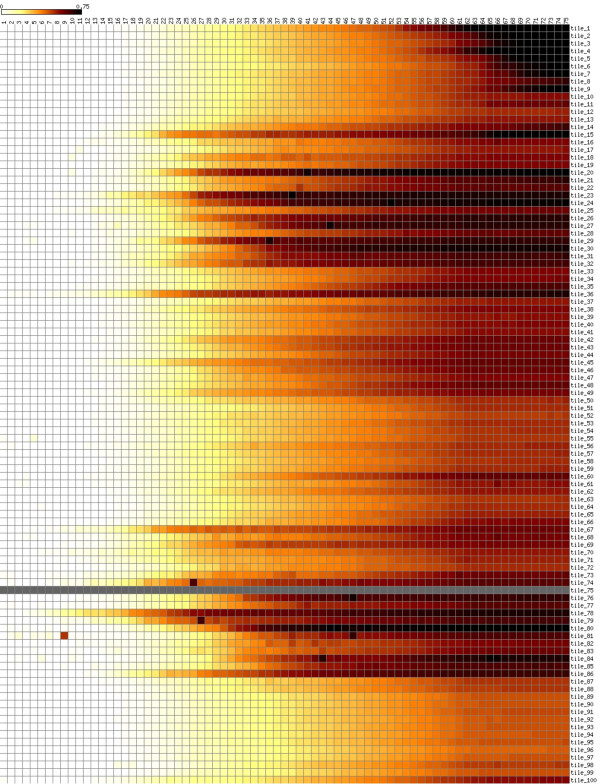
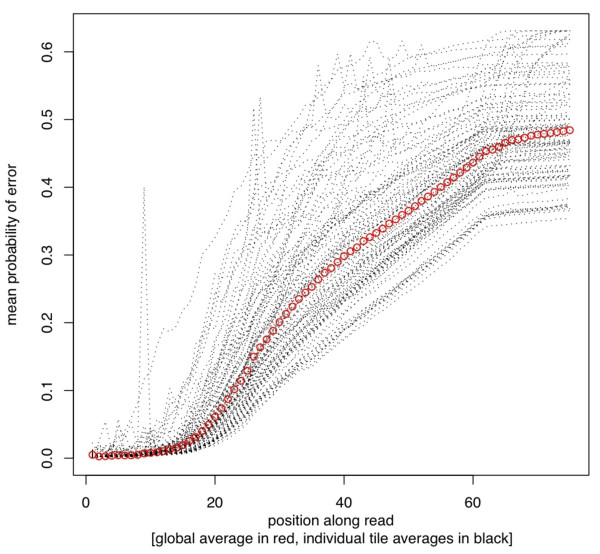
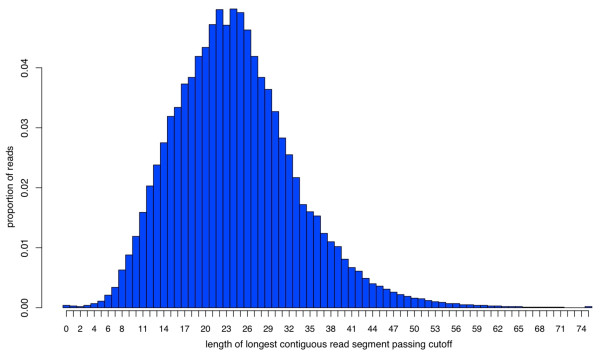
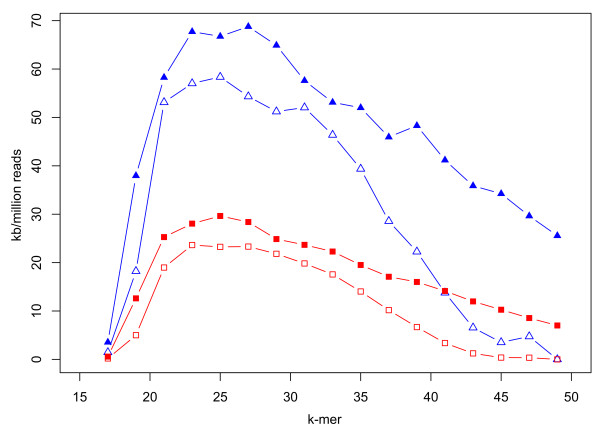
Verification
Claims the paper makes
The claims and statistics of this paper haven’t been checked yet.
Run the check — free, no account needed. It reads the open-access text and checks the sources it cites.
Claims other papers make about this one
Each is checked against this paper’s own text: does it say what the citing paper says it does?
In the citing paper
“Furthermore, there is an exponential increase in error rates (ERs) along the reads (Cox et al., 2010).”
From PEAR: a fast and accurate Illumina Paired-End reAd mergeR (2014) · cites this paper as Cox et al., 2010
Self-check
Percentages, sums and reported differences re-computed from the paper’s own numbers.
The self-check needs the paper’s full text.
Citations
Cites
R: A Language and Environment for Statistical Computing
R Core Team (2000) · doi:10.32614/r.manuals · Cited by 355,893
Velvet: Algorithms for de novo short read assembly using de Bruijn graphsPreprint
Zerbino, D. R., & Birney, E. (2008) · Genome Research · doi:10.1101/gr.074492.107 · Cited by 9,575
Sequencing technologies – the next generation
Metzker, M. L. (2010) · Nature Reviews Genetics · doi:10.1038/nrg2626 · Cited by 7,066
Cock, P., Fields, C. J., Goto, N., Heuer, M., & Rice, P. M. (2009) · Nucleic Acids Research · doi:10.1093/nar/gkp1137 · Cited by 1,896
Substantial biases in ultra-short read data sets from high-throughput DNA sequencing
Dohm, J. C., Lottaz, C., Borodina, T., & Himmelbauer, H. (2008) · Nucleic Acids Research · doi:10.1093/nar/gkn425 · Cited by 1,088
Matrix2png: a utility for visualizing matrix data
Pavlidis, P., & Noble, W. S. (2003) · Bioinformatics · doi:10.1093/bioinformatics/19.2.295 · Cited by 345
Probabilistic base calling of Solexa sequencing data
Rougemont, J., Amzallag, A., Iseli, C., Farinelli, L., Xénarios, I., & Naef, F. (2008) · BMC Bioinformatics · doi:10.1186/1471-2105-9-431 · Cited by 104
PIQA: pipeline for Illumina G1 genome analyzer data quality assessment
Martinez-Alcántara, A., Ballesteros, E., Feng, C., Rojas, M., Koshinsky, H. A., Fofanov, V. Y., Havlak, P., & Fofanov, Y. (2009) · Bioinformatics · doi:10.1093/bioinformatics/btp429 · Cited by 50
TileQC: A system for tile-based quality control of Solexa data
Dolan, P. C., & Denver, D. R. (2008) · BMC Bioinformatics · doi:10.1186/1471-2105-9-250 · Cited by 38
Cited by
Sorted by citations
Quality control and preprocessing of metagenomic datasets
Schmieder, R., & Edwards, R. A. (2011) · Bioinformatics · doi:10.1093/bioinformatics/btr026 · Cited by 5,119
PEAR: a fast and accurate Illumina Paired-End reAd mergeR
Zhang, J., Kobert, K., Flouri, T., & Stamatakis, A. (2014) · Bioinformatics · doi:10.1093/bioinformatics/btt593 · Cited by 4,497
NGS QC Toolkit: A Toolkit for Quality Control of Next Generation Sequencing Data
Patel, R. K., & Jain, M. (2012) · PLoS ONE · doi:10.1371/journal.pone.0030619 · Cited by 2,921
Chen, Y., Chen, Y., Shi, C., Huang, Z., Zhang, Y., Li, S., Li, Y., Ye, J., Yu, C. H., Li, Z., et al. (2017) · GigaScience · doi:10.1093/gigascience/gix120 · Cited by 2,462
Miya, M. U., Sato, Y., Fukunaga, T., Sado, T., Poulsen, J. Y., Sato, K., Minamoto, T., Yamamoto, S., Yamanaka, H., Araki, H., et al. (2015) · Royal Society Open Science · doi:10.1098/rsos.150088 · Cited by 1,573
Metadata
- Authors
- Cox, M. P., Peterson, D. A., & Biggs, P. J.
- Affiliations
- Massey University (NZ)
- Corresponding author
- Cox, Murray P
- Venue
- BMC Bioinformatics
- Published
- 2010-09-27
- Volume
- 11
- Issue
- 1
- Pages
- 485-485
- ISSN
- 1471-2105 (ISSN-L)
- PMC
- PMC2956736
- OpenAlex
- W2097205777
- Cited by
- 1,357
- References
- 9
- Citations by year
- 2026: 29 · 2025: 50 · 2024: 57 · 2023: 86 · 2022: 86 · 2021: 131 · 2020: 118 · 2019: 118 · 2018: 135 · 2017: 105 · 2016: 148 · 2015: 95 · 2014: 97 · 2013: 56 · 2012: 37
- FWCI
- 13.30
- Type
- journal article
- Language
- en
- Open access
- gold
- doi.org
- Licence
- Locations
- BMC Bioinformatics (publishedVersion, cc-by)
- PubMed Central (publishedVersion, cc-by)
- PubMed (publishedVersion)
- DOAJ (DOAJ: Directory of Open Access Journals) (submittedVersion, cc-by-sa)
- Funders
- Royal Society
- Royal Society Te Apārangi (MAU0802)
- Massey University
- Marsden Fund (MAU0802)
- Topics
- Life Sciences › Biochemistry, Genetics and Molecular Biology › Molecular Biology › Genomics and Phylogenetic Studies
- Life Sciences › Biochemistry, Genetics and Molecular Biology › Molecular Biology › Fractal and DNA sequence analysis
- Life Sciences › Biochemistry, Genetics and Molecular Biology › Molecular Biology › Genetics, Bioinformatics, and Biomedical Research
- Keywords
- sequence trimming, quality control software
- MeSH terms
- Base Sequence, Software, Sequence Analysis, DNA, Sequence Analysis, RNA, Internet
About these checks
Registry, retraction, Cites and statistics results are computed, not judged, with one exception: a printed reference that no index lists is read once by a model before it counts as a citation error. Claims are extracted by a model and kept only when their quote appears verbatim in the text; each cited source is then checked, with a model’s help, for whether it says what the claim relies on. Those verdicts can be wrong — read the claim’s quote and the cited source before relying on one.
Statistics and arithmetic are recomputed, not judged.
Confidence bands are shown only for fields calibrated on our annotated test set. None is calibrated yet, so no band is shown.
What counts as a claim ›How we measure confidence ›How we check this ›
Are you an author, or do you see a problem with this page? Request a review
