

The DOI matches its Crossref record; 29 of the 29 references it cites were found in a registry or an index.
Normalization and missing value imputation for label-free LC-MS analysis
Open accessAbstract
Shotgun proteomic data are affected by a variety of known and unknown systematic biases as well as high proportions of missing values. Typically, normalization is performed in an attempt to remove systematic biases from the data before statistical inference, sometimes followed by missing value imputation to obtain a complete matrix of intensities. Here we discuss several approaches to normalization and dealing with missing values, some initially developed for microarray data and some developed specifically for mass spectrometry-based data.
Overview
The claims and statistics of this paper haven’t been checked yet.
Free: it reads the open-access text and checks the first 5 claims that cite a source we can check. Create a free account to check every claim.
Integrity signals
Registry
Cites
Statistics
Figures
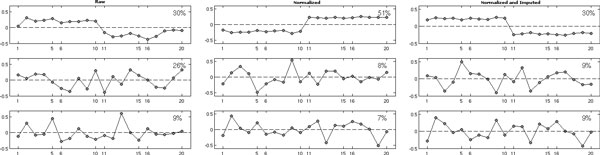
Verification
Claims the paper makes
The claims and statistics of this paper haven’t been checked yet.
Free: it reads the open-access text and checks the first 5 claims that cite a source we can check. Create a free account to check every claim.
Claims other papers make about this one
Each is checked against this paper’s own text: does it say what the citing paper says it does?
The source backs part of the claim, not all of it — or backs it for a different population, condition or comparison.
In the citing paper
“Here, we highlight an advantage of SWATH-MS data; i.e., as with MS1/DDA-based quantification and, unlike more classical targeted methods such as SRM, there are large numbers of peptides available for global normalization that can be used in sample types where the assumptions underlying this type of normalization are valid65, 66.”
From Multi-laboratory assessment of reproducibility, qualitative and quantitative performance of SWATH-mass spectrometry (2017) · cites this paper as [66]
Experimental — accuracy not yet measured
Self-check
Percentages, sums and reported differences re-computed from the paper’s own numbers.
The self-check needs the paper’s full text.
Citations
Cites
Statistical Analysis With Missing Data
Lahiff, M., Little, R. J. A., & Rubin, D. B. (1989) · Journal of the American Statistical Association · doi:10.2307/2289883 · Cited by 17,265
Statistical significance for genomewide studies
Storey, J. D., & Tibshirani, R. (2003) · Proceedings of the National Academy of Sciences · doi:10.1073/pnas.1530509100 · Cited by 9,692 · cited 2×
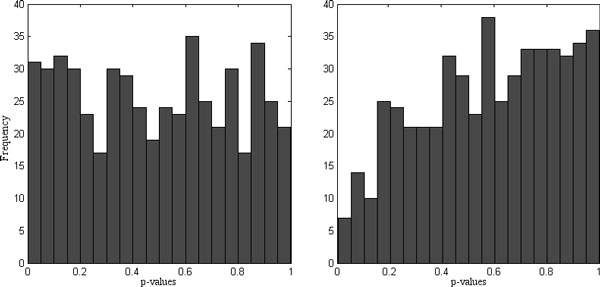
“As expected the p-values are approximately uniformly distributed on the [0 1] interval [20,21].”
BackgroundMethodMixed-Effects Models in S and S-PLUS
(2001) · Technometrics · doi:10.1198/tech.2001.s574 · Cited by 9,278
Statistical Analysis with Missing Data
Little, R. J. A., & Rubin, D. B. (2002) · Wiley Series in Probability and Statistics · doi:10.1002/9781119013563 · Cited by 8,473
Bolstad, B. M., Irizarry, R. A., Åstrand, M., & Speed, T. P. (2003) · Bioinformatics · doi:10.1093/bioinformatics/19.2.185 · Cited by 8,266
Perkins, D. N., Pappin, D. J. C., Creasy, D. M., & Cottrell, J. S. (1999) · Electrophoresis · doi:10.1002/(sici)1522-2683(19991201)20:18<3551::aid-elps3551>3.0.co;2-2 · Cited by 8,203
Mass spectrometry-based proteomics
Aebersold, R., & Mann, M. (2003) · Nature · doi:10.1038/nature01511 · Cited by 6,955
Eng, J. K., McCormack, A. L., & Yates, J. R. (1994) · Journal of the American Society for Mass Spectrometry · doi:10.1016/1044-0305(94)80016-2 · Cited by 6,484
Yang, Y. H. (2002) · Nucleic Acids Research · doi:10.1093/nar/30.4.e15 · Cited by 3,464
TANDEM: matching proteins with tandem mass spectra
Craig, R., & Beavis, R. C. (2004) · Bioinformatics · doi:10.1093/bioinformatics/bth092 · Cited by 2,536
Cited by
Bruderer, R., Bernhardt, O. M., Gandhi, T., Miladinović, S. M., Cheng, L.-Y., Messner, S., Ehrenberger, T., Zanotelli, V., Butscheid, Y., Escher, C., et al. (2015) · Molecular & Cellular Proteomics · doi:10.1074/mcp.m114.044305 · Cited by 1,238
Data‐independent acquisition‐based SWATH ‐ MS for quantitative proteomics: a tutorial
Ludwig, C., Gillet, L., Rosenberger, G., Amon, S., Collins, B. C., & Aebersold, R. (2018) · Molecular Systems Biology · doi:10.15252/msb.20178126 · Cited by 1,002
Missing Value Imputation Approach for Mass Spectrometry-based Metabolomics Data
Wei, R., Wang, J., Su, M., Jia, E., Chen, S., Chen, T., & Ni, Y. (2018) · Scientific Reports · doi:10.1038/s41598-017-19120-0 · Cited by 707
Collins, B. C., Hunter, C. L., Liu, Y., Schilling, B., Rosenberger, G., Bader, S. L., Chan, D. W., Gibson, B. W., Gingras, A.-C., Held, J. M., et al. (2017) · Nature Communications · doi:10.1038/s41467-017-00249-5 · Cited by 576
Seyfried, N. T., Dammer, E. B., Swarup, V., Nandakumar, D., Duong, D. M., Yin, L., Deng, Q., Nguyen, T., Hales, C. M., Wingo, T., et al. (2017) · Cell Systems · doi:10.1016/j.cels.2016.11.006 · Cited by 477
Metadata
- Authors
- Karpievitch, Y. V., Dabney, A. R., & Smith, R. D.
- Affiliations
- University of Tasmania (AU)
- Texas A&M University (US)
- Pacific Northwest National Laboratory (US)
- Corresponding author
- Karpievitch, Yuliya V
- Venue
- BMC Bioinformatics
- Published
- 2012-11
- Volume
- 13
- Issue
- S16
- Pages
- S5-S5
- ISSN
- 1471-2105 (ISSN-L)
- PMC
- PMC3489534
- OpenAlex
- W2103165230
- Cited by
- 345
- References
- 29
- Citations by year
- 2026: 25 · 2025: 22 · 2024: 29 · 2023: 25 · 2022: 24 · 2021: 44 · 2020: 35 · 2019: 32 · 2018: 28 · 2017: 24 · 2016: 21 · 2015: 14 · 2014: 19 · 2013: 3
- FWCI
- 5.09
- Type
- journal article
- Language
- en
- Open access
- gold
- doi.org
- Licence
- cc-by
- creativecommons.org/licenses/by/2.0 (tdm)
- Locations
- BMC Bioinformatics (publishedVersion, cc-by)
- PubMed Central (publishedVersion, cc-by)
- PubMed (publishedVersion)
- eCite Digital Repository (University of Tasmania) (submittedVersion, cc-by)
- DOAJ (DOAJ: Directory of Open Access Journals) (submittedVersion, cc-by-sa)
- Figshare (submittedVersion, cc-by)
- OakTrust (Texas A&M University Libraries) (submittedVersion)
- Topics
- Physical Sciences › Chemistry › Spectroscopy › Advanced Proteomics Techniques and Applications
- Life Sciences › Biochemistry, Genetics and Molecular Biology › Molecular Biology › Gene expression and cancer classification
- Life Sciences › Biochemistry, Genetics and Molecular Biology › Molecular Biology › Metabolomics and Mass Spectrometry Studies
- Keywords
- normalization, missing data imputation, shotgun proteomics, systematic bias, mass spectrometry data
- MeSH terms
- Chromatography, Liquid, Research Design, Mass Spectrometry, Bias, Proteomics
About these checks
Registry, retraction, Cites and statistics results are computed, not judged, with one exception: a printed reference that no index lists is read once by a model before it counts as a citation error. Claims are extracted by a model and kept only when their quote appears verbatim in the text; each cited source is then checked, with a model’s help, for whether it says what the claim relies on. Those verdicts can be wrong — read the claim’s quote and the cited source before relying on one.
Statistics and arithmetic are recomputed, not judged.
Confidence bands are shown only for fields calibrated on our annotated test set. None is calibrated yet, so no band is shown.
What counts as a claim ›How we measure confidence ›How we check this ›
Are you an author, or do you see a problem with this page? Request a review
How to cite
Cite CoChat for the checks on this page, and the paper for its own findings.
- This page
- CoChat. (2026). Citation check: Normalization and missing value imputation for label-free LC-MS analysis. https://app.cochat.ai/papers/10.1186/1471-2105-13-s16-s5
- The paper
- Karpievitch, Y. V., Dabney, A. R., & Smith, R. D. (2012). Normalization and missing value imputation for label-free LC-MS analysis. BMC Bioinformatics. https://doi.org/10.1186/1471-2105-13-s16-s5
Data sources
Bibliographic data: Semantic Scholar, OpenAlex, Crossref.
Contains information from the Semantic Scholar Academic Graph Datasets, made available under the ODC Attribution License (ODC-BY 1.0).
Semantic Scholar’s data is described in: Kinney, R., et al. (2023). The Semantic Scholar Open Data Platform. arXiv:2301.10140.
