

The DOI matches its Crossref record; 48 of the 49 references it cites were found in a registry or an index, and 1 are not checked yet.
Selecting optimal partitioning schemes for phylogenomic datasets
Open accessAbstract
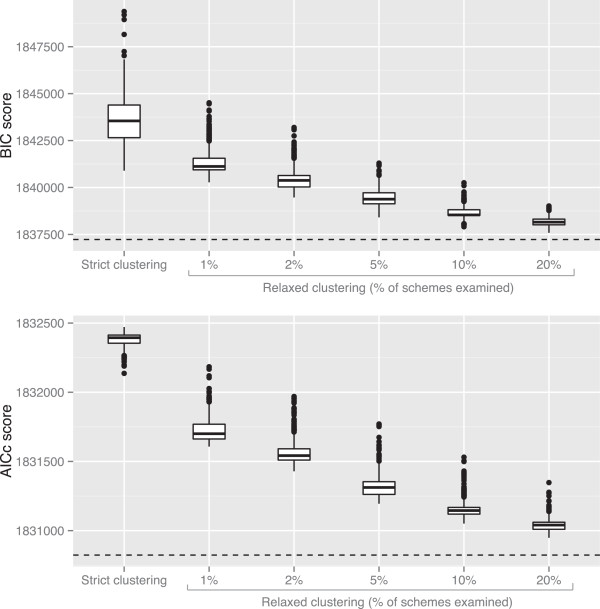
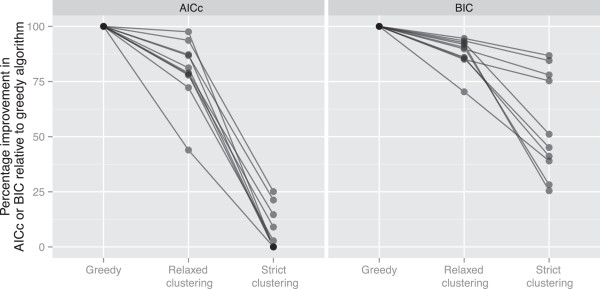
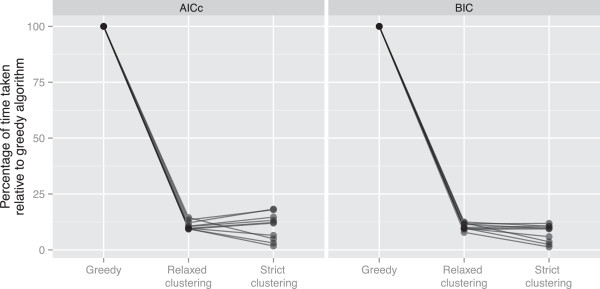
BACKGROUND: Partitioning involves estimating independent models of molecular evolution for different subsets of sites in a sequence alignment, and has been shown to improve phylogenetic inference. Current methods for estimating best-fit partitioning schemes, however, are only computationally feasible with datasets of fewer than 100 loci. This is a problem because datasets with thousands of loci are increasingly common in phylogenetics. METHODS: We develop two novel methods for estimating best-fit partitioning schemes on large phylogenomic datasets: strict and relaxed hierarchical clustering. These methods use information from the underlying data to cluster together similar subsets of sites in an alignment, and build on clustering approaches that have been proposed elsewhere. RESULTS: We compare the performance of our methods to each other, and to existing methods for selecting partitioning schemes. We demonstrate that while strict hierarchical clustering has the best computational efficiency on very large datasets, relaxed hierarchical clustering provides scalable efficiency and returns dramatically better partitioning schemes as assessed by common criteria such as AICc and BIC scores. CONCLUSIONS: These two methods provide the best current approaches to inferring partitioning schemes for very large datasets. We provide free open-source implementations of the methods in the PartitionFinder software. We hope that the use of these methods will help to improve the inferences made from large phylogenomic datasets.
Overview
The claims and statistics of this paper haven’t been checked yet.
Run the check — free, no account needed. It reads the open-access text and checks the sources it cites.
Integrity signals
Registry
Cites
Statistics
Figures
Verification
Claims the paper makes
The claims and statistics of this paper haven’t been checked yet.
Run the check — free, no account needed. It reads the open-access text and checks the sources it cites.
Claims other papers make about this one
Each is checked against this paper’s own text: does it say what the citing paper says it does?
The cited source says what the claim attributes to it.
In the citing paper
“For example, it has been pointed out11,12,34 that standard phylogenomic analyses do not typically apply a single site-homogeneous model to an entire supermatrix, but rather partition datasets by genes, or by sets of genes (as merged under an optimality criterion)36,37, with each partition having a separate model.”
From Evidence for sponges as sister to all other animals from partitioned phylogenomics with mixture models and recoding (2021) · cites this paper as [36]
Self-check
Percentages, sums and reported differences re-computed from the paper’s own numbers.
The self-check needs the paper’s full text.
Citations
Cites
R: A Language and Environment for Statistical Computing
R Core Team (2000) · doi:10.32614/r.manuals · Cited by 355,893
Guindon, S., Dufayard, J.-F., Lefort, V., Anisimova, M., Hordijk, W., & Gascuel, O. (2010) · Systematic Biology · doi:10.1093/sysbio/syq010 · Cited by 18,376
RAxML-VI-HPC: maximum likelihood-based phylogenetic analyses with thousands of taxa and mixed models
Stamatakis, A. (2006) · Bioinformatics · doi:10.1093/bioinformatics/btl446 · Cited by 15,582
Self-citationMultimodel Inference: Understanding AIC and BIC in Model Selection
Burnham, K. P., & Anderson, D. R. (2004) · Sociological Methods & Research · doi:10.1177/0049124104268644 · Cited by 11,648
Lanfear, R., Calcott, B., Ho, S. Y. W., & Guindon, S. (2012) · Molecular Biology and Evolution · doi:10.1093/molbev/mss020 · Cited by 5,732
Self-citationA phylogenomic study of birds reveals their evolutionary history
Hackett, S. J., Kimball, R. T., Reddy, S., Bowie, R. C. K., Braun, E. L., Braun, M. J., Chojnowski, J. L., Cox, W. A., Han, K.-L., Harshman, J., et al. (2008) · Science · doi:10.1126/science.1157704 · Cited by 2,125
A Bayesian Mixture Model for Across-Site Heterogeneities in the Amino-Acid Replacement Process
Lartillot, N., & Philippe, H. (2004) · Molecular Biology and Evolution · doi:10.1093/molbev/msh112 · Cited by 1,516
Pyron, R. A., & Wiens, J. J. (2011) · Molecular Phylogenetics and Evolution · doi:10.1016/j.ympev.2011.06.012 · Cited by 1,417
Bayesian Estimation of Ancestral Character States on Phylogenies
Pagel, M. D., Meade, A., & Barker, D. (2004) · Systematic Biology · doi:10.1080/10635150490522232 · Cited by 1,383
Faircloth, B. C., McCormack, J. E., Crawford, N. G., Harvey, M. G., Brumfield, R. T., & Glenn, T. C. (2012) · Systematic Biology · doi:10.1093/sysbio/sys004 · Cited by 1,303
Cited by
Sorted by citations
Lanfear, R., Frandsen, P. B., Wright, A. M., Senfeld, T., & Calcott, B. (2016) · Molecular Biology and Evolution · doi:10.1093/molbev/msw260 · Cited by 5,319
Self-citationEvolutionary History of the Hymenoptera
Peters, R. S., Krogmann, L., Mayer, C., Donath, A., Gunkel, S., Meusemann, K., Kozlov, A. M., Podsiadłowski, L., Petersen, M., Lanfear, R., et al. (2017) · Current Biology · doi:10.1016/j.cub.2017.01.027 · Cited by 916
Self-citationUsing PhyloSuite for molecular phylogeny and tree‐based analyses
Xiang, C., Gao, F., Jakovlić, I., Lei, H., Hu, Y., Zhang, H., Zou, H., Wang, G., & Zhang, D. (2023) · iMeta · doi:10.1002/imt2.87 · Cited by 591
Orchid phylogenomics and multiple drivers of their extraordinary diversification
Givnish, T. J., Spalink, D., Ames, M., Lyon, S. P., Hunter, S. J., Zuluaga, A., Iles, W. J. D., Clements, M. A., Arroyo, M. T. K., Leebens‐Mack, J., et al. (2015) · Proceedings of the Royal Society B Biological Sciences · doi:10.1098/rspb.2015.1553 · Cited by 528
Phylogenomics and the evolution of hemipteroid insects
Johnson, K. P., Dietrich, C. H., Friedrich, F., BEUTEL, R. G., Wipfler, B., Peters, R. S., Allen, J. M., Petersen, M., Donath, A., Walden, K. K. O., et al. (2018) · Proceedings of the National Academy of Sciences · doi:10.1073/pnas.1815820115 · Cited by 401
Self-citation
Metadata
- Authors
- Lanfear, R., Calcott, B., Kainer, D., Mayer, C., & Stamatakis, A.
- Affiliations
- Australian National University (AU)
- Zoological Research Museum Alexander Koenig (DE)
- Karlsruhe Institute of Technology (DE)
- Corresponding author
- Lanfear, Robert
- Venue
- BMC Evolutionary Biology
- Published
- 2014
- Volume
- 14
- Issue
- 1
- Pages
- 82
- ISSN
- 1471-2148 (ISSN-L)
- PMC
- PMC4012149
- OpenAlex
- W2029226703
- Cited by
- 762
- References
- 48
- Citations by year
- 2026: 40 · 2025: 50 · 2024: 63 · 2023: 52 · 2022: 57 · 2021: 98 · 2020: 79 · 2019: 71 · 2018: 71 · 2017: 76 · 2016: 58 · 2015: 41 · 2014: 6
- FWCI
- 24.75
- Type
- journal article
- Language
- en
- Open access
- gold
- doi.org
- Licence
- cc-by
- Locations
- BMC Evolutionary Biology (publishedVersion, cc-by)
- Europe PMC (PubMed Central) (publishedVersion, cc-by)
- PubMed Central (publishedVersion, cc-by)
- PubMed (publishedVersion)
- Informationszentrum Lebenswissenschaften (ZB MED) (submittedVersion, cc-by)
- ANU Open Research (Australian National University) (submittedVersion)
- Funders
- National Evolutionary Synthesis Center
- Topics
- Life Sciences › Biochemistry, Genetics and Molecular Biology › Molecular Biology › Genomics and Phylogenetic Studies
- Life Sciences › Biochemistry, Genetics and Molecular Biology › Molecular Biology › RNA and protein synthesis mechanisms
- Physical Sciences › Earth and Planetary Sciences › Paleontology › Evolution and Paleontology Studies
- Keywords
- partitioning schemes, phylogenomics, hierarchical clustering, PartitionFinder, AICc, BIC
- MeSH terms
- Algorithms, Phylogeny, Software, Cluster Analysis, Evolution, Molecular, Genomics
About these checks
Registry, retraction, Cites and statistics results are computed, not judged, with one exception: a printed reference that no index lists is read once by a model before it counts as a citation error. Claims are extracted by a model and kept only when their quote appears verbatim in the text; each cited source is then checked, with a model’s help, for whether it says what the claim relies on. Those verdicts can be wrong — read the claim’s quote and the cited source before relying on one.
Statistics and arithmetic are recomputed, not judged.
Confidence bands are shown only for fields calibrated on our annotated test set. None is calibrated yet, so no band is shown.
What counts as a claim ›How we measure confidence ›How we check this ›
Are you an author, or do you see a problem with this page? Request a review
