

The DOI matches its Crossref record; 29 of the 29 references it cites were found in a registry or an index; 25 of the 29 sources its claims cite were checked for support.
Sources of bias in measures of allele-specific expression derived from RNA-seq data aligned to a single reference genome
Open accessAbstract
Background: RNA-seq can be used to measure allele-specific expression (ASE) by assigning sequence reads to individual alleles; however, relative ASE is systematically biased when sequence reads are aligned to a single reference genome. Aligning sequence reads to both parental genomes can eliminate this bias, but this approach is not always practical, especially for non-model organisms. To improve accuracy of ASE measured using a single reference genome, we identified properties of differentiating sites responsible for biased measures of relative ASE. Results: We found that clusters of differentiating sites prevented sequence reads from an alternate allele from aligning to the reference genome, causing a bias in relative ASE favoring the reference allele. This bias increased with greater sequence divergence between alleles. Increasing the number of mismatches allowed when aligning sequence reads to the reference genome and restricting analysis to genomic regions with fewer differentiating sites than the number of mismatches allowed almost completely eliminated this systematic bias. Accuracy of allelic abundance was increased further by excluding differentiating sites within sequence reads that could not be aligned uniquely within the genome (imperfect mappability) and reads that overlapped one or more insertions or deletions (indels) between alleles. Conclusions: After aligning sequence reads to a single reference genome, excluding differentiating sites with at least as many neighboring differentiating sites as the number of mismatches allowed, imperfect mappability, and/or an indel(s) nearby resulted in measures of allelic abundance comparable to those derived from aligning sequence reads to both parental genomes.
Overview
AI snapshot
Written from the paper’s full text.
TL;DR
When RNA-seq reads are aligned to a single reference genome, clusters of differentiating sites and nearby indels cause reads from the alternate allele to misalign, biasing relative allele-specific expression toward the reference allele. Excluding differentiating sites with as many or more neighboring differentiating sites than mismatches allowed, imperfect mappability, and/or nearby indels yields allelic abundance measures comparable to aligning reads to both parental genomes.
Key findings
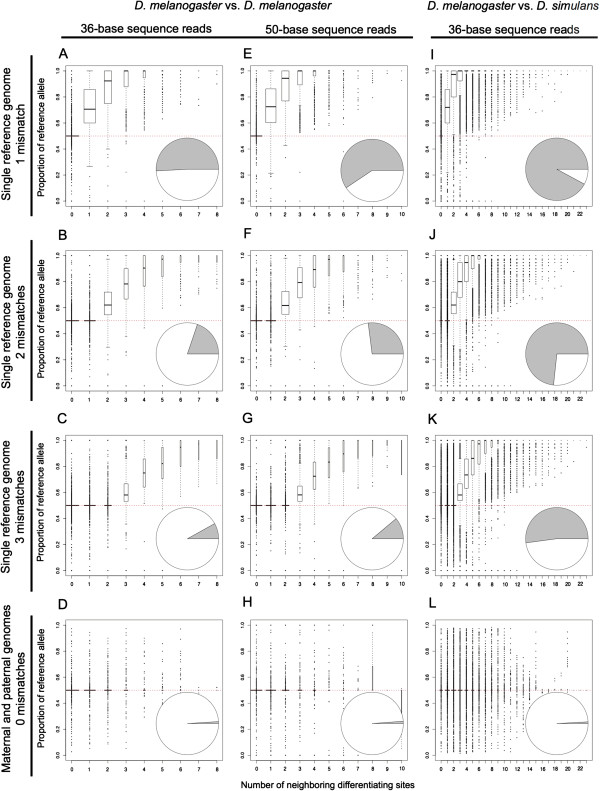
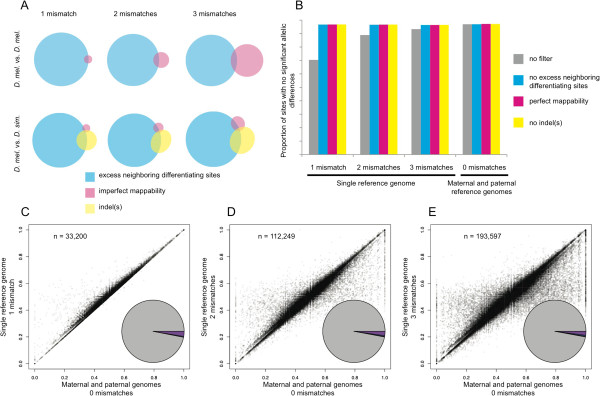
- In simulated 36-base reads from two *D. melanogaster* genotypes aligned with one mismatch, 50.9% of differentiating sites had unequal allelic abundance, 99.3% of which were biased toward the reference allele; among sites with at least one neighboring differentiating site, 99.8% favored the reference allele. Allowing two or three mismatches increased equal abundance to 80.2% and 91.9%, while aligning to both parental genomes with zero mismatches gave 99.0% equal abundance.
- Bias increased with sequence divergence: the interspecific *D. melanogaster*/*D. simulans* simulation (1,130,435 differentiating sites) showed stronger reference bias than the intraspecific comparison, but parental-genome alignment made divergence impact negligible. Longer 50-base reads were more biased at the same mismatch allowance (40.6%, 73.0%, and 88.9% equal at one, two, or three mismatches), but matching the mismatch ratio (three for 36-base, four for 50-base) gave 91.9% and 92.1% equal abundance.
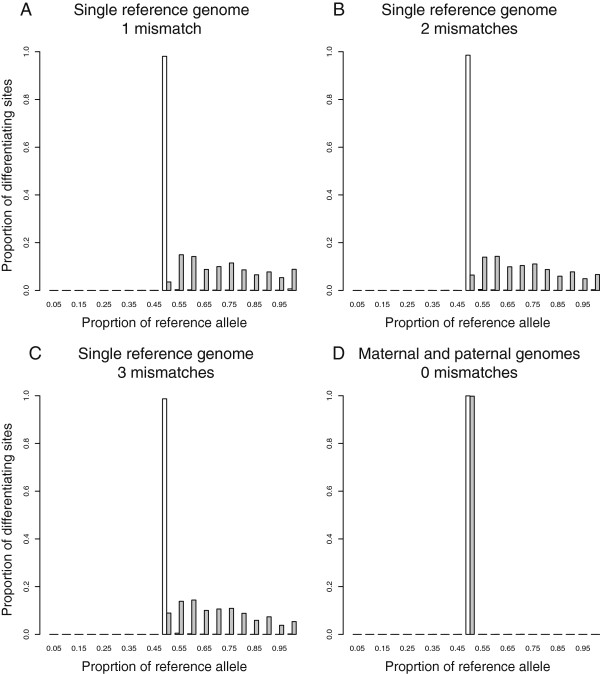
- Imperfect mappability and nearby indels also caused inaccurate measures: for interspecific sites with perfect mappability, ~94% showed equal abundance when aligned to a single reference genome versus 99.9% when aligned to both parental genomes. In real F1 hybrid genomic DNA reads, equal allelic abundance was 70.4%, 88.9%, and 93.3% with one, two, or three mismatches to a single genome and 96.9% with parental genomes; excluding problematic sites raised single-reference measures to 96.3–96.6%, comparable to parental alignment.
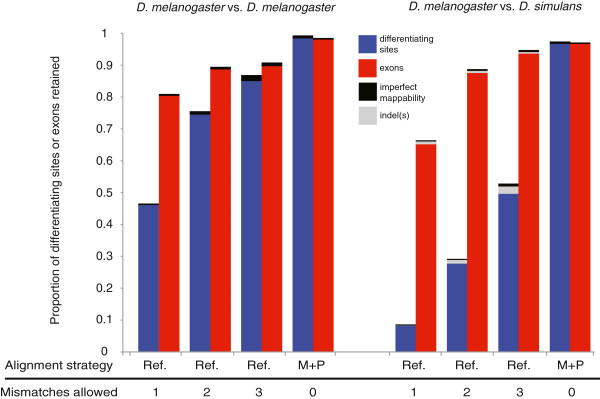
- Filtering retained 46.6–86.9% of differentiating sites in the intraspecific simulation and 8.3–50.5% in the interspecific simulation, but 81.8–91.8% and 66.3–95.2% of exons, respectively, still contained at least one reliable differentiating site.
Methods
- Simulated equal numbers of 36- and 50-base reads from constitutive *D. melanogaster* exons for the dm3 reference allele versus a DGRP line_40 alternative allele (93,781 altered coding sites; 93,395,272 36-base reads, ~3.4 Gb). Reads were aligned with Bowtie v0.12.7 uniquely allowing 0–3 mismatches to a single reference genome and to both allele-specific genomes, then quantified with SAMtools and custom Perl/R scripts.
- Interspecific simulation and real-data validation used 60,040 orthologous *D. melanogaster*/*D. simulans* exons (1,130,435 differentiating sites) and published 36-base Illumina genomic DNA reads from female F1 hybrids. Reads were aligned to the single *D. melanogaster* exome or both parental exomes; binomial exact tests with a 0.05 false discovery rate were applied to sites with ≥20 overlapping reads.
- Neighboring differentiating sites were counted as the maximum number of differences in any overlapping read; mappability was calculated with the GEM library; indels were identified from FSA pairwise alignments.
Limitations
- The paper states that true relative ASE is rarely known, so real-data validation used genomic DNA from F1 hybrids, where maternal and paternal alleles are expected in equal amounts, rather than RNA. It also states that filtering is expected to preferentially eliminate the most rapidly evolving exons.
- The paper notes that aligning reads to both parental genomes is not always practical, especially for non-model organisms, and the single-reference correction depends on knowing differentiating sites and the mismatch allowance used.
- Evident from the text: analyses are limited to *Drosophila* simulations and one *D. melanogaster*/*D. simulans* F1 hybrid dataset; performance in other taxa, at other polymorphism levels, and with newer aligners or read lengths is not tested.
Model-written summary. Check it against the paper before relying on it.
Integrity signals
Registry
Cites
Statistics
Figures
Verification
Claims the paper makes
43 Own result · 9 Own interpretation · 6 Partly supported · 5 Supported · 5 Own method · 5 No basis given · 1 Supported so far · 1 Not supported · 1 No full text of the sources · accuracy not yet measured
The cited sources support only part of this claim — read each source’s verdict below.
In the paper
“two alternative strategies for aligning reads have been shown to eliminate the systematic bias in measures of relative ASE favoring the reference allele”
- Also stated in: § The systematic bias in measures of ASE correlates with the density of differentiating sites · boosted
“aligning reads to the maternal and paternal genomes, which is a strategy that has previously been shown to produce unbiased measures of relative ASE [15,18-20,25]”
§ Sources of bias in measures of allele-specific expression derived from RNA-seq data aligned to a single reference genome > Background
What the sources say
- Partly supportedcites [15] McManus CJ, Coolon JD, Duff MO, Eipper-Mains J, Graveley BR, Wittkopp PJ: Regulatory divergence in Drosophila revealed by mRNA-seq. Genome Res. 2010, 20: 816-825. 10.1101/gr.102491.109. sourceExperimental — accuracy not yet measured
The Results and Discussion section says that reads from mixed parental and hybrid samples were independently aligned to both parental genomes, supporting the alignment strategy. The paper reports checks on allele-assignment accuracy, but our copy does not show that this strategy eliminated systematic bias favoring a reference allele. (LLM, conf=0.84)
- Supportedcites [18] Rozowsky J, Abyzov A, Wang J, Alves P, Raha D, Harmanci A, Leng J, Bjornson R, Kong Y, Kitabayashi N, Bhardwaj N, Rubin M, Snyder M, Gerstein M: AlleleSeq: analysis of allele-specific expression and binding in a network framework. Mol Syst Biol. 2011, 7: 522- source
The Results section explains that aligning to the reference genome biases read mapping against non-reference alleles. In its analysis of GM12878 RNA-Seq data, the paper reports that the AlleleSeq pipeline, which uses maternal and paternal genome sequences, showed no residual bias toward the reference allele. (LLM, conf=0.93)
- Not checked — no full text of the sourcecites [19] Rivas-Astroza M, Xie D, Cao X, Zhong S: Mapping personal functional data to personal genomes. Bioinformatics. 2011, 27: 3427-3429. 10.1093/bioinformatics/btr578. source
- Partly supportedcites [20] Satya RV, Zavaljevski N, Reifman J: A new strategy to reduce allelic bias in RNA-Seq readmapping. Nucleic Acids Res. 2012, 40: e127-10.1093/nar/gks425. sourceExperimental — accuracy not yet measured
The Results on simulated reads report that mapping to the paper’s enhanced reference almost completely eliminated the average bias favoring the reference allele. But the Methods describe an enhanced reference containing alternate alleles at known SNPs, not alignment to both parental genomes; the paper does not establish that specific strategy’s effect. (LLM, conf=0.88)
- Could not verifycites [25] Graze RM, McIntyre LM, Main BJ, Wayne ML, Nuzhdin SV: Regulatory divergence in Drosophila melanogaster and D. simulans, a genomewide analysis of allele-specific expression. Genetics. 2009, 183: 547-561. 10.1534/genetics.109.105957. 61– 1SI–21SI sourceExperimental — accuracy not yet measured
The Materials and Methods and File S1 passages describe tiling-array probes, hybridization bias, and DNA controls—not alignment of sequence reads to both parental genomes. Searches for read alignment and reference-allele bias found no passage testing whether that strategy eliminates systematic bias. No page numbers were available in our copy. (LLM, conf=0.75)
boosteddirect- Asserted: passes — The authors put it forward as true.
- Checkable: passes — It can be checked against evidence.
- Load-bearing: passes — The paper’s conclusions depend on it.
- Based: passes — The paper gives a reason why it holds.
- Also stated in: § The systematic bias in measures of ASE correlates with the density of differentiating sites · boosted
Every source the paper cites for this claim was checked and supports it.
In the paper
“relative ASE is systematically biased when sequence reads are aligned to a single reference genome”
- Also stated in: § Background · plain
“Despite simulating an equal number of reads from each allele, a bias was observed causing reads to be assigned more often to the reference allele than the alternative allele.”
§ Sources of bias in measures of allele-specific expression derived from RNA-seq data aligned to a single reference genome > Abstract > Background
What the sources say
- Supportedcites Degner et al. [14] Degner JF, Marioni JC, Pai AA, Pickrell JK, Nkadori E, Gilad Y, Pritchard JK: Effect of read-mapping biases on detecting allele-specific expression from RNA-sequencing data. Bioinformatics. 2009, 25: 3207-3212. 10.1093/bioinformatics/btp579. source
The Results (passages 1 and 4; page numbers not provided) report systematic overrepresentation of reference alleles among mapped reads. Simulations with equal numbers of reads from each allele also showed mapping bias, supporting the claim that alignment to a reference genome can bias relative ASE estimates. (LLM, conf=0.92)
plaindirect- Asserted: passes — The authors put it forward as true.
- Checkable: passes — It can be checked against evidence.
- Load-bearing: passes — The paper’s conclusions depend on it.
- Based: passes — The paper gives a reason why it holds.
- Also stated in: § Background · plain
Every source the paper cites for this claim was checked and supports it.
In the paper
“The alignment parameters they used allowed two or fewer bases within each read to differ from the reference genome.”
§ Sources of bias in measures of allele-specific expression derived from RNA-seq data aligned to a single reference genome > Results and discussion > The systematic bias in measures of ASE correlates with the density of differentiating sites
What the sources say
- Supportedcites Degner et al. [14] Degner JF, Marioni JC, Pai AA, Pickrell JK, Nkadori E, Gilad Y, Pritchard JK: Effect of read-mapping biases on detecting allele-specific expression from RNA-sequencing data. Bioinformatics. 2009, 25: 3207-3212. 10.1093/bioinformatics/btp579. source
Methods §2.2 states that a read was assigned to its best-matching genomic location only if the number of mismatching bases was less than three. That is equivalent to allowing at most two bases in a mapped read to differ from the reference genome; the paper also imposed a quality-score threshold. (LLM, conf=0.94)
plain- Asserted: passes — The authors put it forward as true.
- Checkable: passes — It can be checked against evidence.
- Load-bearing: passes — The paper’s conclusions depend on it.
- Based: passes — The paper gives a reason why it holds.
- Supported
Every source the paper cites for this claim was checked and supports it.
In the paper
“a systematic bias occurs when reads from a heterozygous individual are aligned to a single reference genome [14].”
§ Sources of bias in measures of allele-specific expression derived from RNA-seq data aligned to a single reference genome > Conclusions
What the sources say
- Supportedcites [14] Degner JF, Marioni JC, Pai AA, Pickrell JK, Nkadori E, Gilad Y, Pritchard JK: Effect of read-mapping biases on detecting allele-specific expression from RNA-sequencing data. Bioinformatics. 2009, 25: 3207-3212. 10.1093/bioinformatics/btp579. source
The Results report that, when reads spanning SNPs were mapped to the genome, the reference allele was mapped more often than the non-reference allele. The Methods describe the reference genome used for mapping, supporting the claim that alignment to a single reference can produce a systematic bias. (LLM, conf=0.93)
plaindirect- Asserted: passes — The authors put it forward as true.
- Checkable: passes — It can be checked against evidence.
- Load-bearing: passes — The paper’s conclusions depend on it.
- Based: passes — The paper gives a reason why it holds.
- Supported
The cited sources support only part of this claim — read each source’s verdict below.
In the paper
“Simulated datasets contained either ~10-fold or ~100-fold more differentiating sites than the human genotypes used to validate other methods for measuring relative ASE [14,18,20].”
§ Sources of bias in measures of allele-specific expression derived from RNA-seq data aligned to a single reference genome > Background
What the sources say
- Partly supportedcites [14] Degner JF, Marioni JC, Pai AA, Pickrell JK, Nkadori E, Gilad Y, Pritchard JK: Effect of read-mapping biases on detecting allele-specific expression from RNA-sequencing data. Bioinformatics. 2009, 25: 3207-3212. 10.1093/bioinformatics/btp579. sourceExperimental — accuracy not yet measured
Methods §2.2 describes using human HapMap genotypes to measure allele-specific expression, and Results §3 reports 1,981 heterozygous SNPs meeting the read threshold. The paper does not establish that the citing document’s simulated datasets had approximately 10 or 100 times as many differentiating sites, so the numerical comparison is not supported by this source. (LLM, conf=0.78)
- Partly supportedcites [18] Rozowsky J, Abyzov A, Wang J, Alves P, Raha D, Harmanci A, Leng J, Bjornson R, Kong Y, Kitabayashi N, Bhardwaj N, Rubin M, Snyder M, Gerstein M: AlleleSeq: analysis of allele-specific expression and binding in a network framework. Mol Syst Biol. 2011, 7: 522- sourceExperimental — accuracy not yet measured
The Introduction (page not provided) says HapMap III SNP calls used in earlier studies were approximately 10-fold fewer than those available from the 1000 Genomes pilot II genotypes. It does not compare simulated datasets with those genotypes. Its approximately 100-fold figure concerns the number of possible comparisons between allele-specific binding and expression SNPs, not the number of differentiating sites. (LLM, conf=0.88)
- Partly supportedcites [20] Satya RV, Zavaljevski N, Reifman J: A new strategy to reduce allelic bias in RNA-Seq readmapping. Nucleic Acids Res. 2012, 40: e127-10.1093/nar/gks425. sourceExperimental — accuracy not yet measured
The Materials and Methods (Simulated data; page unavailable) describe reads simulated at human SNP loci, and the Results (Results on RNA-Seq data; page unavailable) describe evaluating mapping methods with data from two Yoruba HapMap individuals. The paper does not state that simulated datasets had approximately 10- or 100-fold more differentiating sites than those human genotypes. (LLM, conf=0.82)
plain- Asserted: passes — The authors put it forward as true.
- Checkable: passes — It can be checked against evidence.
- Load-bearing: passes — The paper’s conclusions depend on it.
- Based: passes — The paper gives a reason why it holds.
- Partly supported
Every source the paper cites for this claim was checked and supports it.
In the paper
“Differences between alleles in sequences that appear more than once in the genome can also cause reads to be excluded for one allele but not the other [14].”
§ Sources of bias in measures of allele-specific expression derived from RNA-seq data aligned to a single reference genome > Results and discussion > Allele-specific differences in mappability and insertions/deletions affect measurements of ASE
What the sources say
- Supportedcites [14] Degner JF, Marioni JC, Pai AA, Pickrell JK, Nkadori E, Gilad Y, Pritchard JK: Effect of read-mapping biases on detecting allele-specific expression from RNA-sequencing data. Bioinformatics. 2009, 25: 3207-3212. 10.1093/bioinformatics/btp579. source
The Results section explains that when a SNP’s flanking sequence matches another genomic location, one allele can map to that location as well as or better than the correct one. Figure 3’s caption states that reads tied between locations are left unmapped, and Methods §2.2 says such reads were discarded. Together, these passages support allele-dependent exclusion of reads in repeated or homologous sequences. (LLM, conf=0.94)
plaindirect- Asserted: passes — The authors put it forward as true.
- Checkable: passes — It can be checked against evidence.
- Load-bearing: passes — The paper’s conclusions depend on it.
- Based: passes — The paper gives a reason why it holds.
- Supported
Every source the paper cites for this claim was checked and supports it.
In the paper
“Despite simulating an equal number of reads from each allele, a bias was observed causing reads to be assigned more often to the reference allele than the alternative allele.”
§ Sources of bias in measures of allele-specific expression derived from RNA-seq data aligned to a single reference genome > Background
What the sources say
- Supportedcites Degner et al. [14] Degner JF, Marioni JC, Pai AA, Pickrell JK, Nkadori E, Gilad Y, Pritchard JK: Effect of read-mapping biases on detecting allele-specific expression from RNA-sequencing data. Bioinformatics. 2009, 25: 3207-3212. 10.1093/bioinformatics/btp579. source
Methods §2.3 says the simulated reads included equal numbers carrying the reference and non-reference alleles at each SNP. Results §3 reports that 50.7% of mapped simulated reads carried the reference allele, showing a bias after mapping to the unmasked reference genome described in Methods §2.2. (LLM, conf=0.94)
plaindirect- Asserted: passes — The authors put it forward as true.
- Checkable: passes — It can be checked against evidence.
- Load-bearing: passes — The paper’s conclusions depend on it.
- Based: passes — The paper gives a reason why it holds.
- Supported
A result the paper reports from its own data — it cites no other source for it, so there is none to check. The quote shows it is in the paper.
In the paper
“Differences between alleles in mappability (i.e. the ability to align a read uniquely within the genome) also contribute to inaccuracy of ASE”
§ Sources of bias in measures of allele-specific expression derived from RNA-seq data aligned to a single reference genome > Conclusions
plaindirect- Asserted: passes — The authors put it forward as true.
- Checkable: passes — It can be checked against evidence.
- Load-bearing: passes — The paper’s conclusions depend on it.
- Based: passes — The paper gives a reason why it holds.
A result the paper reports from its own data — it cites no other source for it, so there is none to check. The quote shows it is in the paper.
In the paper
“and reads that overlapped one or more insertions or deletions (indels) between alleles.”
- Also stated in: § Allele-specific differences in mappability and insertions/deletions affect measurements of ASE · plain
“sites with perfect mappability that had an indel nearby showed more reads assigned to D. melanogaster than D. simulans allele when reads were aligned to only the D. melanogaster genome”
§ Sources of bias in measures of allele-specific expression derived from RNA-seq data aligned to a single reference genome > Abstract > Results
plaindirect- Asserted: passes — The authors put it forward as true.
- Checkable: passes — It can be checked against evidence.
- Load-bearing: passes — The paper’s conclusions depend on it.
- Based: passes — The paper gives a reason why it holds.
- Also stated in: § Allele-specific differences in mappability and insertions/deletions affect measurements of ASE · plain
A result the paper reports from its own data — it cites no other source for it, so there is none to check. The quote shows it is in the paper.
In the paper
“After filtering out these problematic sites, measures of relative allelic abundance derived from aligning reads to a single reference genome were similar to those produced by aligning sequence reads separately to the maternal and paternal genomes (Figure 5C-E).”
- Also stated in: § Conclusions · plain
“After excluding these biased sites, as well as those affected by imperfect mappability and/or an indel(s) nearby, we found that RNA-seq data aligned to a single reference genome produced measures of relative ASE that were comparable to those resulting from separately aligning the same reads to allele-specific maternal and paternal genomes.”
§ Sources of bias in measures of allele-specific expression derived from RNA-seq data aligned to a single reference genome > Results and discussion > Aligning real sequencing data to a single genome can produce reliable measures of relative ASE
plain- Asserted: passes — The authors put it forward as true.
- Checkable: passes — It can be checked against evidence.
- Load-bearing: passes — The paper’s conclusions depend on it.
- Based: passes — The paper gives a reason why it holds.
- Also stated in: § Conclusions · plain
- Probably not a substantial claim. 13
- It may state two separate claims as one. 12
- The quote only partly states this claim. 2
At least one cited source doesn’t support this claim or points to a different paper, and none confirmed it — see the verdicts below.
In the paper
“Reads perfectly matching the reference genome were assigned to the reference allele, while reads with at least one difference from the reference genome were assigned to an alternative allele.”
§ Sources of bias in measures of allele-specific expression derived from RNA-seq data aligned to a single reference genome > Results and discussion > The systematic bias in measures of ASE correlates with the density of differentiating sites
What the sources say
- Disputedcites Degner et al. [14] Degner JF, Marioni JC, Pai AA, Pickrell JK, Nkadori E, Gilad Y, Pritchard JK: Effect of read-mapping biases on detecting allele-specific expression from RNA-sequencing data. Bioinformatics. 2009, 25: 3207-3212. 10.1093/bioinformatics/btp579. sourceExperimental — accuracy not yet measured
Methods §2.2 says reads could be mapped with fewer than three mismatching bases, so a read did not need to match the reference genome perfectly to be counted. Allele counts were determined by the base observed at a heterozygous SNP, not by whether the read had any difference anywhere from the reference genome. (LLM, conf=0.88)
Checked by a reasoning model — may be wrong.
plain- Asserted: passes — The authors put it forward as true.
- Checkable: passes — It can be checked against evidence.
- Load-bearing: passes — The paper’s conclusions depend on it.
- Based: passes — The paper gives a reason why it holds.
Probably not a substantial claim.
- Disputed
The cited sources support only part of this claim — read each source’s verdict below.
In the paper
“Therefore, after aligning reads, we excluded differentiating sites with fewer than 20 overlapping reads and used binomial exact tests with a false discovery rate threshold of 0.05 to test each differentiating site for a statistically significant difference in relative allelic abundance [15,27].”
§ Sources of bias in measures of allele-specific expression derived from RNA-seq data aligned to a single reference genome > Results and discussion > Aligning real sequencing data to a single genome can produce reliable measures of relative ASE
What the sources say
- Partly supportedcites [15] McManus CJ, Coolon JD, Duff MO, Eipper-Mains J, Graveley BR, Wittkopp PJ: Regulatory divergence in Drosophila revealed by mRNA-seq. Genome Res. 2010, 20: 816-825. 10.1101/gr.102491.109. sourceExperimental — accuracy not yet measured
Split into 2 atoms — 0 confirmed, 2 partially supported, 0 disputed, 0 misattributed, 0 unverifiable. Expand the claim to see per-atom verdicts.
- Partly supportedcites [27] Fontanillas P, Landry CR, Wittkopp PJ, Russ C, Gruber JD, Nusbaum C, Hartl DL: Key considerations for measuring allelic expression on a genomic scale using high-throughput sequencing. Mol Ecol. 2010, 19 (1): 212-227. sourceExperimental — accuracy not yet measured
Split into 2 atoms — 0 confirmed, 1 partially supported, 0 disputed, 0 misattributed, 1 unverifiable. Expand the claim to see per-atom verdicts.
plain- Asserted: passes — The authors put it forward as true.
- Checkable: passes — It can be checked against evidence.
- Load-bearing: passes — The paper’s conclusions depend on it.
- Based: passes — The paper gives a reason why it holds.
Probably not a substantial claim. It may state two separate claims as one.
- Rests on an assumption: In F1 hybrids, all maternal and paternal alleles are present in equal amounts.
- Partly supported
The cited sources support only part of this claim — read each source’s verdict below.
In the paper
“Mapping reads to specific genes is relatively straightforward with the bioinformatics tools available today [10-13], but using these tools to distinguish between reads derived from alternative alleles of the same gene remains challenging [9].”
§ Sources of bias in measures of allele-specific expression derived from RNA-seq data aligned to a single reference genome > Background
What the sources say
- Supportedcites [10] Langmead B, Trapnell C, Pop M, Salzberg SL: Ultrafast and memory-efficient alignment of short DNA sequences to the human genome. Genome Biol. 2009, 10: R25-10.1186/gb-2009-10-3-r25. source
This source is a short-read mapping tool, and its Rationale describes tools for aligning reads to the human genome. The cited paper supports the first clause, to which [10–13] is attached. The claim about distinguishing alternative alleles is attached to [9], not this source. (LLM, conf=0.88)
- Supportedcites [11] Li H, Durbin R: Fast and accurate long-read alignment with Burrows-Wheeler transform. Bioinformatics. 2010, 26: 589-595. 10.1093/bioinformatics/btp698. source
The citation to this paper is among [10–13], which support the first clause about available tools for mapping reads; the alternative-allele challenge is cited separately to [9]. The Introduction describes multiple fast methods for matching sequencing reads to a reference genome, and the Results evaluate read alignments to genomic coordinates. The paper does not specifically discuss assigning reads to genes, but it supports the broad point about available read-mapping tools. (LLM, conf=0.86)
- Partly supportedcites [12] Li H, Ruan J, Durbin R: Mapping short DNA sequencing reads and calling variants using mapping quality scores. Genome Res. 2008, 18: 1851-1858. 10.1101/gr.078212.108. sourceExperimental — accuracy not yet measured
In “Single end read mapping” (page unavailable), the paper says sequence variants can cause reads to align incorrectly to a reference, supporting a difficulty relevant to allele-derived reads. Its “Consensus genotype calling” section (page unavailable) addresses inferring genotypes from multiple reads, but the paper does not specifically say that available tools struggle to distinguish individual reads from alternative alleles of the same gene. (LLM, conf=0.80)
- Supportedcites [13] Li H, Handsaker B, Wysoker A, Fennell T, Ruan J, Homer N, Marth G, Abecasis G, Durbin R, 1000 Genome Project Data Processing Subgroup: The Sequence Alignment/Map format and SAMtools. Bioinformatics. 2009, 25: 2078-2079. 10.1093/bioinformatics/btp352. source
The citation to this paper is attached to the first clause, about available tools for mapping reads, not the later claim about distinguishing alleles. The Introduction describes tools designed for efficient read mapping against reference sequences, and Methods §2.2 describes SAMtools as a package for processing those alignments. The paper does not need to support the allele-distinction clause, which has a different citation. (LLM, conf=0.84)
- Supportedcites [9] DeVeale B, van der Kooy D, Babak T: Critical evaluation of imprinted gene expression by RNA-Seq: a new perspective. PLoS Genet. 2012, 8: e1002600-10.1371/journal.pgen.1002600. source
The citation [9] supports the sentence’s second clause, not its claim that mapping reads to genes is straightforward. The Introduction explains that allelic origin is distinguished using reads over heterozygous SNPs, while the Results describe allele-specific RNA-seq analysis as an unresolved challenge affected by alignment and other biases (page numbers unavailable). (LLM, conf=0.88)
plain- Asserted: passes — The authors put it forward as true.
- Checkable: passes — It can be checked against evidence.
- Load-bearing: passes — The paper’s conclusions depend on it.
- Based: passes — The paper gives a reason why it holds.
It may state two separate claims as one.
- Supported
The cited sources support only part of this claim — read each source’s verdict below.
In the paper
“This is a viable strategy for both model and non-model species, but will likely be most effective for intraspecific studies of species like humans with relatively low levels of polymorphism because the number of possible haplotypes increases exponentially with the number of polymorphic sites.”
§ Sources of bias in measures of allele-specific expression derived from RNA-seq data aligned to a single reference genome > Background
What the sources say
- Partly supportedcites [21] Wu TD, Nacu S: Fast and SNP-tolerant detection of complex variants and splicing in short reads. Bioinformatics. 2010, 26: 873-881. 10.1093/bioinformatics/btq057. sourceExperimental — accuracy not yet measured
Split into 2 atoms — 1 confirmed, 1 partially supported, 0 disputed, 0 misattributed, 0 unverifiable. Expand the claim to see per-atom verdicts.
- Could not verifycites [22] Skelly DA, Johansson M, Madeoy J, Wakefield J, Akey JM: A powerful and flexible statistical framework for testing hypotheses of allele-specific gene expression from RNA-seq data. Genome Res. 2011, 21: 1728-1737. 10.1101/gr.119784.110. sourceExperimental — accuracy not yet measured
Split into 2 atoms — 0 confirmed, 0 partially supported, 0 disputed, 0 misattributed, 2 unverifiable. Expand the claim to see per-atom verdicts.
hedgeddirect- Asserted: passes — The authors put it forward as true.
- Checkable: passes — It can be checked against evidence.
- Load-bearing: unclear — It is unclear whether the paper’s conclusions depend on it.
- Based: passes — The paper gives a reason why it holds.
It may state two separate claims as one.
- Partly supported
The cited sources support only part of this claim — read each source’s verdict below.
In the paper
“Controlling for sites known to be polymorphic in humans prior to aligning the simulated reads produced symmetrical measures of relative ASE, showing that the differentiating sites themselves caused this bias.”
§ Sources of bias in measures of allele-specific expression derived from RNA-seq data aligned to a single reference genome > Background
What the sources say
- Partly supportedcites Degner et al. [14] Degner JF, Marioni JC, Pai AA, Pickrell JK, Nkadori E, Gilad Y, Pritchard JK: Effect of read-mapping biases on detecting allele-specific expression from RNA-sequencing data. Bioinformatics. 2009, 25: 3207-3212. 10.1093/bioinformatics/btp579. sourceExperimental — accuracy not yet measured
The Results report that masking known SNP sites before mapping eliminated the overall reference-allele bias in simulated and real data. But strong biases remained at individual SNPs; the Results attribute these to similarities between flanking sequences and other genomic regions. Thus, the paper does not show that the differentiating sites themselves caused the bias. (LLM, conf=0.88)
plaindirect- Asserted: passes — The authors put it forward as true.
- Checkable: passes — It can be checked against evidence.
- Load-bearing: passes — The paper’s conclusions depend on it.
- Based: passes — The paper gives a reason why it holds.
It may state two separate claims as one.
- Partly supported
The sources with a verdict support this claim; the rest weren’t checked yet, have no full text we could read, or their verdicts aren’t rated yet.
In the paper
“Measures of allele-specific expression (ASE) are particularly important for studying the regulation of gene expression because they can be used to distinguish cis- and trans-regulatory changes [6,7] and to detect genomic imprinting [8,9].”
§ Sources of bias in measures of allele-specific expression derived from RNA-seq data aligned to a single reference genome > Background
What the sources say
- Not checked — no full text of the sourcecites [6] Wittkopp PJ, Haerum BK, Clark AG: Evolutionary changes in cis and trans gene regulation. Nature. 2004, 430: 85-88. 10.1038/nature02698. source
- Not checked — no full text of the sourcecites [7] Cowles CR, Hirschhorn JN, Altshuler D, Lander ES: Detection of regulatory variation in mouse genes. Nat Genet. 2002, 32: 432-437. 10.1038/ng992. source
- Supportedcites [8] Coolon JD, Stevenson KR, McManus CJ, Graveley BR, Wittkopp PJ: Genomic imprinting absent in Drosophila melanogaster adult females. Cell Rep. 2012, 2: 69-75. 10.1016/j.celrep.2012.06.013. source
The citation to this paper is attached to the claim that allele-specific expression can be used to detect genomic imprinting, not to the separate cis/trans-regulation claim. In Results and Discussion, the paper says allele-specific RNA-seq measurements are necessary to test for imprinting and uses them to identify candidate imprinted genes; it cautions that candidates need independent validation. (LLM, conf=0.92)
- Supportedcites [9] DeVeale B, van der Kooy D, Babak T: Critical evaluation of imprinted gene expression by RNA-Seq: a new perspective. PLoS Genet. 2012, 8: e1002600-10.1371/journal.pgen.1002600. source
The citation to this source is attached to the claim that ASE can detect genomic imprinting, not to the separate claim about cis- and trans-regulatory changes. The Introduction describes detecting allelic expression with RNA-sequencing reads and using reciprocal crosses to distinguish parent-of-origin bias; the Discussion states that detecting imprinting requires demonstrating reciprocal bias. (LLM, conf=0.94)
plain- Asserted: passes — The authors put it forward as true.
- Checkable: passes — It can be checked against evidence.
- Load-bearing: passes — The paper’s conclusions depend on it.
- Based: passes — The paper gives a reason why it holds.
Probably not a substantial claim. It may state two separate claims as one.
A result the paper reports from its own data — it cites no other source for it, so there is none to check. The quote shows it is in the paper.
In the paper
“We found that 50.9% of differentiating sites had unequal measures of allelic abundance, 99.3% of which were biased toward the reference allele.”
§ Sources of bias in measures of allele-specific expression derived from RNA-seq data aligned to a single reference genome > Results and discussion > The systematic bias in measures of ASE correlates with the density of differentiating sites
plain- Asserted: passes — The authors put it forward as true.
- Checkable: passes — It can be checked against evidence.
- Load-bearing: passes — The paper’s conclusions depend on it.
- Based: passes — The paper gives a reason why it holds.
It may state two separate claims as one.
A result the paper reports from its own data — it cites no other source for it, so there is none to check. The quote shows it is in the paper.
In the paper
“subsequently excluding differentiating sites with indels nearby increased the percentage of genes with equal allelic abundance an additional ~0.1% (Figure 5B).”
§ Sources of bias in measures of allele-specific expression derived from RNA-seq data aligned to a single reference genome > Results and discussion > Aligning real sequencing data to a single genome can produce reliable measures of relative ASE
plaindirect- Asserted: passes — The authors put it forward as true.
- Checkable: passes — It can be checked against evidence.
- Load-bearing: fails — The paper’s conclusions may not depend on it.
- Based: passes — The paper gives a reason why it holds.
Probably not a substantial claim. The paper’s conclusions may not depend on it. The quote only partly states this claim.
A result the paper reports from its own data — it cites no other source for it, so there is none to check. The quote shows it is in the paper.
In the paper
“We found that 99.0% of differentiating sites showed equal representation of the two alleles, with the rest showing no systematic bias toward either allele (Figure 2D).”
§ Sources of bias in measures of allele-specific expression derived from RNA-seq data aligned to a single reference genome > Results and discussion > The systematic bias in measures of ASE correlates with the density of differentiating sites
plain- Asserted: passes — The authors put it forward as true.
- Checkable: passes — It can be checked against evidence.
- Load-bearing: passes — The paper’s conclusions depend on it.
- Based: passes — The paper gives a reason why it holds.
It may state two separate claims as one.
A result the paper reports from its own data — it cites no other source for it, so there is none to check. The quote shows it is in the paper.
In the paper
“We found that 40.6%, 73.0%, and 88.9% of differentiating sites showed equal representation of the two alleles when aligned to a single reference genome with one, two or three mismatches allowed (Figure 2E-G).”
§ Sources of bias in measures of allele-specific expression derived from RNA-seq data aligned to a single reference genome > Results and discussion > Read length and the amount of sequence divergence can also affect allelic bias
plaincorrelational- Asserted: passes — The authors put it forward as true.
- Checkable: passes — It can be checked against evidence.
- Load-bearing: passes — The paper’s conclusions depend on it.
- Based: passes — The paper gives a reason why it holds.
It may state two separate claims as one.
A result the paper reports from its own data — it cites no other source for it, so there is none to check. The quote shows it is in the paper.
In the paper
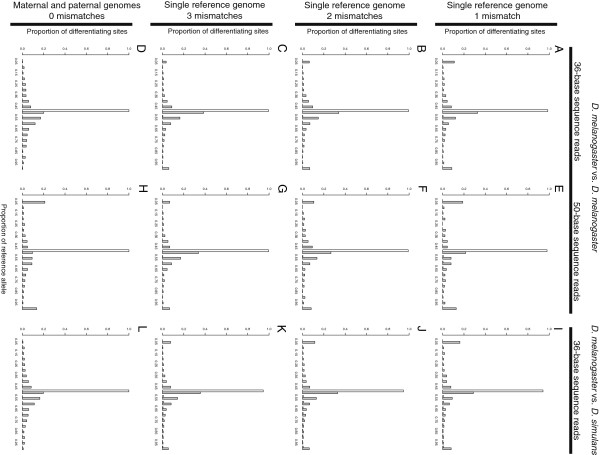
“For both the 36- and 50-base reads simulated from the two D. melanogaster genotypes, > 97.9% of sites with perfect mappability showed the expected equal abundance of the reference and alternative alleles under all mapping conditions (Figure 3A-H).”
§ Sources of bias in measures of allele-specific expression derived from RNA-seq data aligned to a single reference genome > Results and discussion > Allele-specific differences in mappability and insertions/deletions affect measurements of ASE
plaindirect- Asserted: passes — The authors put it forward as true.
- Checkable: passes — It can be checked against evidence.
- Load-bearing: passes — The paper’s conclusions depend on it.
- Based: passes — The paper gives a reason why it holds.
The quote only partly states this claim.
A result the paper reports from its own data — it cites no other source for it, so there is none to check. The quote shows it is in the paper.
In the paper
“Further restricting the set of differentiating sites to those with perfect mappability increased these percentages ~0.1%”
§ Sources of bias in measures of allele-specific expression derived from RNA-seq data aligned to a single reference genome > Results and discussion > Aligning real sequencing data to a single genome can produce reliable measures of relative ASE
plaindirect- Asserted: passes — The authors put it forward as true.
- Checkable: passes — It can be checked against evidence.
- Load-bearing: fails — The paper’s conclusions may not depend on it.
- Based: passes — The paper gives a reason why it holds.
Probably not a substantial claim. The paper’s conclusions may not depend on it.
A result the paper reports from its own data — it cites no other source for it, so there is none to check. The quote shows it is in the paper.
In the paper
“Only 1.9% of all reads were excluded because they failed to map uniquely to at least one genome.”
§ Sources of bias in measures of allele-specific expression derived from RNA-seq data aligned to a single reference genome > Results and discussion > The systematic bias in measures of ASE correlates with the density of differentiating sites
plain- Asserted: passes — The authors put it forward as true.
- Checkable: passes — It can be checked against evidence.
- Load-bearing: fails — The paper’s conclusions may not depend on it.
- Based: passes — The paper gives a reason why it holds.
Probably not a substantial claim. The paper’s conclusions may not depend on it.
A result the paper reports from its own data — it cites no other source for it, so there is none to check. The quote shows it is in the paper.
In the paper
“Consistent with this hypothesis, we found that sites with perfect mappability that had an indel nearby showed more reads assigned to D. melanogaster than D. simulans allele when reads were aligned to only the D. melanogaster genome, whereas sites with perfect mappability that lacked such an indel did not (Figure 4A-C).”
§ Sources of bias in measures of allele-specific expression derived from RNA-seq data aligned to a single reference genome > Results and discussion > Allele-specific differences in mappability and insertions/deletions affect measurements of ASE
plaincorrelational- Asserted: passes — The authors put it forward as true.
- Checkable: passes — It can be checked against evidence.
- Load-bearing: passes — The paper’s conclusions depend on it.
- Based: passes — The paper gives a reason why it holds.
It may state two separate claims as one.
A result the paper reports from its own data — it cites no other source for it, so there is none to check. The quote shows it is in the paper.
In the paper
“our simulated datasets showed that reads containing (1) as many or more neighboring differentiating sites as mismatches allowed during alignment, (2) imperfect mappability, and/or (3) an indel(s) between alleles can cause inaccurate measures of relative allelic abundance.”
§ Sources of bias in measures of allele-specific expression derived from RNA-seq data aligned to a single reference genome > Results and discussion > Aligning real sequencing data to a single genome can produce reliable measures of relative ASE
plaindirect- Asserted: passes — The authors put it forward as true.
- Checkable: passes — It can be checked against evidence.
- Load-bearing: passes — The paper’s conclusions depend on it.
- Based: passes — The paper gives a reason why it holds.
It may state two separate claims as one.
The paper states this without a source or data behind it here, so there is nothing to check it against. The quote shows it is in the paper.
In the paper
“The two D. melanogaster genotypes compared did not include any indels, as described in the main text.”
§ Sources of bias in measures of allele-specific expression derived from RNA-seq data aligned to a single reference genome > Results and discussion > Excluding selected differentiating sites maintains ability to measure relative ASE for most exons
plain- Asserted: passes — The authors put it forward as true.
- Checkable: passes — It can be checked against evidence.
- Load-bearing: fails — The paper’s conclusions may not depend on it.
- Based: passes — The paper gives a reason why it holds.
Probably not a substantial claim. The paper’s conclusions may not depend on it.
The paper states this without a source or data behind it here, so there is nothing to check it against. The quote shows it is in the paper.
In the paper
“Because real sequencing data involves stochastic sampling, the proportion of the reference allele observed was not always expected to be 0.5.”
§ Sources of bias in measures of allele-specific expression derived from RNA-seq data aligned to a single reference genome > Results and discussion > Aligning real sequencing data to a single genome can produce reliable measures of relative ASE
plaindirect- Asserted: passes — The authors put it forward as true.
- Checkable: passes — It can be checked against evidence.
- Load-bearing: passes — The paper’s conclusions depend on it.
- Based: passes — The paper gives a reason why it holds.
Probably not a substantial claim.
What the paper did — it cites no source for this, so there is none to check. The quote shows it is in the paper.
In the paper
“Indels were not a factor in our comparisons of the two D. melanogaster strains because the alternative allele was constructed by changing only single nucleotides in the reference allele.”
§ Sources of bias in measures of allele-specific expression derived from RNA-seq data aligned to a single reference genome > Results and discussion > Allele-specific differences in mappability and insertions/deletions affect measurements of ASE
plain- Asserted: passes — The authors put it forward as true.
- Checkable: passes — It can be checked against evidence.
- Load-bearing: passes — The paper’s conclusions depend on it.
- Based: passes — The paper gives a reason why it holds.
It may state two separate claims as one.
In the paper
“To quantify transcript abundance using RNA-seq, each short sequence read (hereafter simply called a “read”) is compared to an annotated reference genome. Assignment of a read to a specific gene is made by finding the region of the genome with the highest sequence similarity, and the number of reads aligning to a gene is used as a proxy for its relative expression level [4].”
§ Sources of bias in measures of allele-specific expression derived from RNA-seq data aligned to a single reference genome > Background
What the sources say
- Not checked — no full text of the sourcecites [4] Mortazavi A, Williams BA, McCue K, Schaeffer L, Wold B: Mapping and quantifying mammalian transcriptomes by RNA-Seq. Nat Methods. 2008, 5: 621-628. 10.1038/nmeth.1226. source
plaincorrelational- Asserted: passes — The authors put it forward as true.
- Checkable: passes — It can be checked against evidence.
- Load-bearing: passes — The paper’s conclusions depend on it.
- Based: passes — The paper gives a reason why it holds.
Probably not a substantial claim. It may state two separate claims as one.
What the paper did — it cites no source for this, so there is none to check. The quote shows it is in the paper.
In the paper
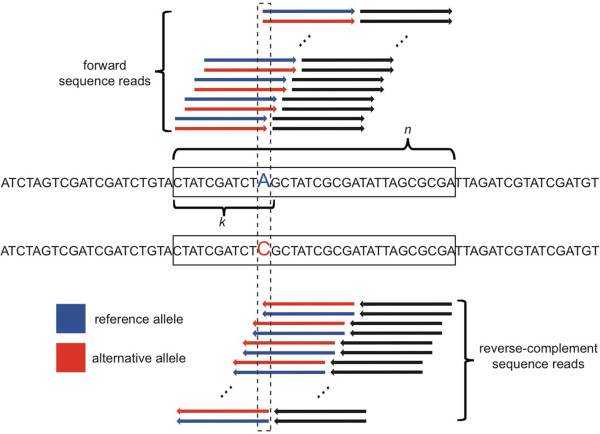
“Because the reference and alternative alleles differed only at these predefined differentiating sites, only reads overlapping these sites had the possibility to be informative for relative ASE.”
§ Sources of bias in measures of allele-specific expression derived from RNA-seq data aligned to a single reference genome > Methods > Generating allele-specific short reads comparing D. melanogaster genotypes in silico
plaindirect- Asserted: passes — The authors put it forward as true.
- Checkable: passes — It can be checked against evidence.
- Load-bearing: passes — The paper’s conclusions depend on it.
- Based: passes — The paper gives a reason why it holds.
Probably not a substantial claim.
What the paper did — it cites no source for this, so there is none to check. The quote shows it is in the paper.
In the paper
“This specific line was chosen because it had the fewest sites with evidence of residual heterozygosity.”
§ Sources of bias in measures of allele-specific expression derived from RNA-seq data aligned to a single reference genome > Methods > Generating allele-specific short reads comparing D. melanogaster genotypes in silico
plaindirectSingle case- Asserted: passes — The authors put it forward as true.
- Checkable: passes — It can be checked against evidence.
- Load-bearing: fails — The paper’s conclusions may not depend on it.
- Based: passes — The paper gives a reason why it holds.
Probably not a substantial claim. The paper’s conclusions may not depend on it.
What the paper did — it cites no source for this, so there is none to check. The quote shows it is in the paper.
In the paper
“Binomial exact tests and a false discovery rate of 0.05 were used to assess statistical significance in all cases.”
- Also stated in: § Quantifying relative ASE in an F1 hybrid between D. melanogaster and D. simulans · plain
“We performed binomial exact tests for differentiating sites with 20 or more overlapping reads, controlling the false discovery rate at 0.05 to correct for multiple comparisons.”
§ Sources of bias in measures of allele-specific expression derived from RNA-seq data aligned to a single reference genome > Results and discussion > Aligning real sequencing data to a single genome can produce reliable measures of relative ASE
plain- Asserted: passes — The authors put it forward as true.
- Checkable: passes — It can be checked against evidence.
- Load-bearing: passes — The paper’s conclusions depend on it.
- Based: passes — The paper gives a reason why it holds.
Probably not a substantial claim.
- Also stated in: § Quantifying relative ASE in an F1 hybrid between D. melanogaster and D. simulans · plain
A conclusion the paper draws from its own results — it cites no other source for it, so there is none to check. The quote shows it is in the paper.
In the paper
“although the most rapidly evolving exons are expected to be preferentially eliminated.”
§ Sources of bias in measures of allele-specific expression derived from RNA-seq data aligned to a single reference genome > Conclusions
hedgedconditional- Asserted: passes — The authors put it forward as true.
- Checkable: passes — It can be checked against evidence.
- Load-bearing: fails — The paper’s conclusions may not depend on it.
- Based: fails — The paper may give no reason why it holds.
Probably not a substantial claim. The paper’s conclusions may not depend on it. The paper may give no reason why it holds.
The authors state this as an assumption.
The number of differentiating sites with allele-specific mappability differences is similar between alleles.
“Assuming the number of such differentiating sites is similar between alleles, differences in allele-specific mappability should not systematically favor one allele or the other, but will still cause errors in relative ASE.”
The paper relies on this without support.
In F1 hybrids, all maternal and paternal alleles are present in equal amounts.
“we used sequence data that was collected in a comparable manner from genomic DNA extracted from F1 hybrids, in which all maternal and paternal alleles are expected to be present in equal amounts.”
The paper relies on this without support.
The true value of relative allele-specific expression is rarely known.
“Assessing the accuracy of relative ASE measurements derived from RNA-seq data is challenging because the true value of relative ASE is rarely known.”
The paper relies on this without support.
Independent empirical methods for measuring relative allele-specific expression are not suitable for quantifying relative allele-specific expression on a genomic scale.
“Independent empirical methods for measuring relative ASE such as Pyrosequencing and qPCR can be used to validate RNA-seq data for individual genes, but they are not suitable for quantifying relative ASE on a genomic scale.”
The authors state this as an assumption.
Reads aligning uniquely to one or the other allele-specific genome are evidence that the read is allele-specific, while reads aligning equally well to both genomes are not.
“We posited that reads aligning uniquely to one or the other allele-specific genome was evidence that that read was allele-specific, while reads aligning equally well to both genomes was not.”
The paper relies on this without support.
Sequence divergence is lower within D. melanogaster than between D. melanogaster and D. simulans.
“is consistent with the lower sequence divergence within than between species.”
Self-check
Percentages, sums and reported differences re-computed from the paper’s own numbers.
Each contradiction between two passages listed here was confirmed by an independent check.
Rated minor: it would not touch a result — a value no result rests on, a p-value that stays on the same side of the significance level, or a conflict that is clerical, resolved elsewhere in the paper, or outside its own findings.
In the paper
§ Sources of bias in measures of allele-specific expression derived from RNA-seq data aligned to a single reference genome > Results and discussion > Allele-specific differences in mappability and insertions/deletions affect measurements of ASE
“excluding sites with more neighboring differentiating sites than the number of mismatches allowed when aligning to a single reference genome.”
§ Sources of bias in measures of allele-specific expression derived from RNA-seq data aligned to a single reference genome > Results and discussion > Allele-specific differences in mappability and insertions/deletions affect measurements of ASE
“For unbiased differentiating sites (i.e., those with fewer neighboring differentiating sites than the number of mismatches allowed)”
Rated minor: it would not touch a result — a value no result rests on, a p-value that stays on the same side of the significance level, or a conflict that is clerical, resolved elsewhere in the paper, or outside its own findings.
In the paper
§ Sources of bias in measures of allele-specific expression derived from RNA-seq data aligned to a single reference genome > Results and discussion > The systematic bias in measures of ASE correlates with the density of differentiating sites
“For each exon, one read (arrow) was generated starting at each position for each allele from 1 to n-k, where n is the length of the exon and k is the length of the read, both in bases.”
§ Sources of bias in measures of allele-specific expression derived from RNA-seq data aligned to a single reference genome > Results and discussion > The systematic bias in measures of ASE correlates with the density of differentiating sites
“We generated 36-base reads from each allele starting at every possible position in each exon”
Rated minor: it would not touch a result — a value no result rests on, a p-value that stays on the same side of the significance level, or a conflict that is clerical, resolved elsewhere in the paper, or outside its own findings.
In the paper
§ Sources of bias in measures of allele-specific expression derived from RNA-seq data aligned to a single reference genome > Results and discussion > Aligning real sequencing data to a single genome can produce reliable measures of relative ASE
“subsequently excluding differentiating sites with indels nearby increased the percentage of genes with equal allelic abundance an additional ~0.1%”
§ Sources of bias in measures of allele-specific expression derived from RNA-seq data aligned to a single reference genome > Results and discussion > Aligning real sequencing data to a single genome can produce reliable measures of relative ASE
“determined the percentage of differentiating sites retained that had no statistically significant difference in abundance between alleles”
Rated minor: it would not touch a result — a value no result rests on, a p-value that stays on the same side of the significance level, or a conflict that is clerical, resolved elsewhere in the paper, or outside its own findings.
In the paper
§ Sources of bias in measures of allele-specific expression derived from RNA-seq data aligned to a single reference genome > Results and discussion > Excluding selected differentiating sites maintains ability to measure relative ASE for most exons
“as well as sites with one or more nearby indels in the intraspecific dataset”
§ Sources of bias in measures of allele-specific expression derived from RNA-seq data aligned to a single reference genome > Results and discussion > Allele-specific differences in mappability and insertions/deletions affect measurements of ASE
“Indels were not a factor in our comparisons of the two D. melanogaster strains because the alternative allele was constructed by changing only single nucleotides in the reference allele.”
Citations
Cites
The Sequence Alignment/Map format and SAMtools
Li, H., Handsaker, B., Wysoker, A., Fennell, T., Ruan, J., Homer, N., Marth, G., Abecasis, G., Durbin, R., & 1000 Genome Project Data Processing Subgroup (2009) · Bioinformatics · doi:10.1093/bioinformatics/btp352 · Cited by 62,041
Fast and accurate short read alignment with Burrows-Wheeler transform
Li, H., & Durbin, R. (2009) · Bioinformatics · doi:10.1093/bioinformatics/btp324 · Cited by 58,607
Ultrafast and memory-efficient alignment of short DNA sequences to the human genome.
Langmead, B., Trapnell, C., Pop, M., & Salzberg, S. L. (2009) · Genome Biology · doi:10.1186/gb-2009-10-3-r25 · Cited by 21,849
Mapping and quantifying mammalian transcriptomes by RNA-Seq
Mortazavi, A., Williams, B. A., McCue, K., Schaeffer, L., & Wold, B. (2008) · Nature Methods · doi:10.1038/nmeth.1226 · Cited by 13,696
RNA-Seq: a revolutionary tool for transcriptomics
Wang, Z., Gerstein, M., & Snyder, M. (2009) · Nature Reviews Genetics · doi:10.1038/nrg2484 · Cited by 13,174
Fast and accurate long-read alignment with Burrows-Wheeler transform.
Li, H., & Durbin, R. (2010) · Bioinformatics · doi:10.1093/bioinformatics/btp698 · Cited by 12,063
Sequencing technologies – the next generation
Metzker, M. L. (2010) · Nature Reviews Genetics · doi:10.1038/nrg2626 · Cited by 7,066
RNA-seq: An assessment of technical reproducibility and comparison with gene expression arrays
Marioni, J. C., Mason, C. E., Mane, S. M., Stephens, M., & Gilad, Y. (2008) · Genome Research · doi:10.1101/gr.079558.108 · Cited by 2,771
Mapping short DNA sequencing reads and calling variants using mapping quality scores
Li, H., Ruan, J., & Durbin, R. (2008) · Genome Research · doi:10.1101/gr.078212.108 · Cited by 2,638
Fast and SNP-tolerant detection of complex variants and splicing in short reads
Wu, T. D., & Nacu, S. (2010) · Bioinformatics · doi:10.1093/bioinformatics/btq057 · Cited by 1,894
Cited by
Sorted by citations
Kukurba, K. R., & Montgomery, S. B. (2015) · Cold Spring Harbor Protocols · doi:10.1101/pdb.top084970 · Cited by 924
Tools and best practices for data processing in allelic expression analysis.
Castel, S. E., Levy-Moonshine, A., Mohammadi, P., Banks, E., & Lappalainen, T. (2015) · Genome Biology · doi:10.1186/s13059-015-0762-6 · Cited by 375
Eizenga, J. M., Novak, A. M., Sibbesen, J. A., Heumos, S., Ghaffaari, A., Hickey, G., Chang, X., Seaman, J. D., Rounthwaite, R., Ebler, J., et al. (2020) · Annual Review of Genomics and Human Genetics · doi:10.1146/annurev-genom-120219-080406 · Cited by 320
Effect of predicted protein-truncating genetic variants on the human transcriptome
Rivas, M. A., Pirinen, M., Conrad, D. F., Lek, M., Tsang, E. K., Karczewski, K. J., Maller, J. B., Kukurba, K. R., DeLuca, D. S., Fromer, M., et al. (2015) · Science · doi:10.1126/science.1261877 · Cited by 313
Kim, J. K., Kolodziejczyk, A. A., Ilicic, T., Teichmann, S. A., & Marioni, J. C. (2015) · Nature Communications · doi:10.1038/ncomms9687 · Cited by 251
Metadata
- Authors
- Stevenson, K. R., Coolon, J. D., & Wittkopp, P. J.
- Affiliations
- University of Michigan (US)
- Corresponding author
- Wittkopp, Patricia J
- Venue
- BMC Genomics
- Published
- 2013-08-07
- Volume
- 14
- Issue
- 1
- Pages
- 536-536
- ISSN
- 1471-2164 (ISSN-L)
- PMC
- PMC3751238
- OpenAlex
- W2164158485
- Cited by
- 140
- References
- 29
- Citations by year
- 2026: 3 · 2025: 7 · 2024: 7 · 2023: 8 · 2022: 4 · 2021: 15 · 2020: 14 · 2019: 12 · 2018: 9 · 2017: 9 · 2016: 14 · 2015: 16 · 2014: 19 · 2013: 2
- FWCI
- 6.86
- Type
- journal article
- Language
- en
- Open access
- gold
- doi.org
- Licence
- cc-by
- Locations
- BMC Genomics (publishedVersion, cc-by)
- PubMed (publishedVersion)
- Deep Blue (University of Michigan) (submittedVersion)
- Europe PMC (PubMed Central) (submittedVersion, cc-by)
- PubMed Central (submittedVersion, cc-by)
- Funders
- National Science Foundation (1021398, 0903629)
- National Institutes of Health (1f32gm089009-01a1)
- National Institute of General Medical Sciences (1F32-GM089009-01A1)
- Topics
- Life Sciences › Biochemistry, Genetics and Molecular Biology › Molecular Biology › Genomics and Phylogenetic Studies
- Life Sciences › Biochemistry, Genetics and Molecular Biology › Molecular Biology › Single-cell and spatial transcriptomics
- Life Sciences › Biochemistry, Genetics and Molecular Biology › Molecular Biology › RNA Research and Splicing
- Keywords
- allele-specific expression, RNA-seq, reference genome bias, indels, non-model organisms, read mapping
- MeSH terms
- Alleles, Animals, Drosophila, Exons, Genome, Sequence Analysis, RNA
About these checks
Registry, retraction, Cites and statistics results are computed, not judged, with one exception: a printed reference that no index lists is read once by a model before it counts as a citation error. Claims are extracted by a model and kept only when their quote appears verbatim in the text; each cited source is then checked, with a model’s help, for whether it says what the claim relies on. Those verdicts can be wrong — read the claim’s quote and the cited source before relying on one.
A language model drew the claims from the paper on 2026-10-13, under version 3 of the claim definition (model deepseek-v4.1-flash, prompt extract-v3).
A second model labelled each claim on 2026-10-13 (model jev-1.13-20260917, definition revision gold-guideline-v0.2).
Cited sources are checked with a language model’s help (gpt-6-sol).
Statistics and arithmetic are recomputed, not judged.
Confidence bands are shown only for fields calibrated on our annotated test set. None is calibrated yet, so no band is shown.
What counts as a claim ›How we measure confidence ›How we check this ›
Are you an author, or do you see a problem with this page? Request a review
