

The DOI matches its Crossref record; 54 of the 54 references it cites were found in a registry or an index.
A graphical vector autoregressive modelling approach to the analysis of electronic diary data
Open accessAbstract
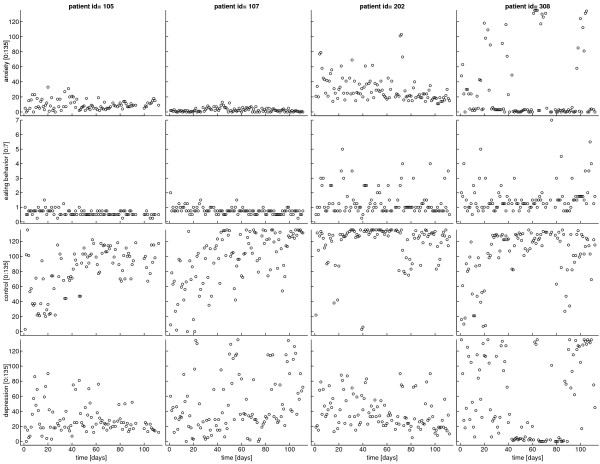
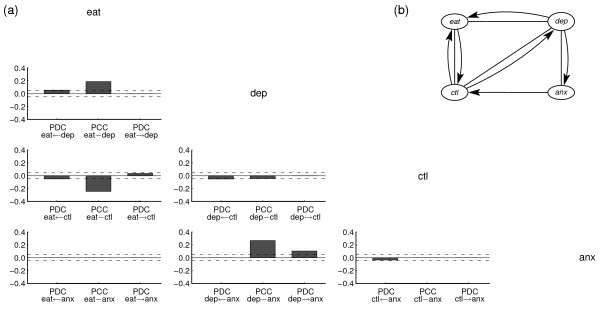
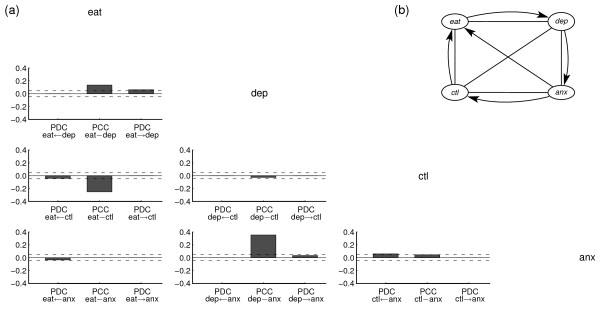
BACKGROUND: In recent years, electronic diaries are increasingly used in medical research and practice to investigate patients' processes and fluctuations in symptoms over time. To model dynamic dependence structures and feedback mechanisms between symptom-relevant variables, a multivariate time series method has to be applied. METHODS: We propose to analyse the temporal interrelationships among the variables by a structural modelling approach based on graphical vector autoregressive (VAR) models. We give a comprehensive description of the underlying concepts and explain how the dependence structure can be recovered from electronic diary data by a search over suitable constrained (graphical) VAR models. RESULTS: The graphical VAR approach is applied to the electronic diary data of 35 obese patients with and without binge eating disorder (BED). The dynamic relationships for the two subgroups between eating behaviour, depression, anxiety and eating control are visualized in two path diagrams. Results show that the two subgroups of obese patients with and without BED are distinguishable by the temporal patterns which influence their respective eating behaviours. CONCLUSION: The use of the graphical VAR approach for the analysis of electronic diary data leads to a deeper insight into patient's dynamics and dependence structures. An increasing use of this modelling approach could lead to a better understanding of complex psychological and physiological mechanisms in different areas of medical care and research.
Overview
The claims and statistics of this paper haven’t been checked yet.
Run the check — free, no account needed. It reads the open-access text and checks the sources it cites.
Integrity signals
Registry
Cites
Statistics
Figures
Verification
Claims the paper makes
The claims and statistics of this paper haven’t been checked yet.
Run the check — free, no account needed. It reads the open-access text and checks the sources it cites.
Claims other papers make about this one
Each is checked against this paper’s own text: does it say what the citing paper says it does?
In the citing paper
“The temporal dynamics between two or more variables may be investigated using vector auto-regression (VAR) models. This way complex relationships between variables can be unraveled, such that it becomes possible to make inferences about person-level cause -effect relationships (Wild et al., 2010).”
From Mood Disorders in Everyday Life: A Systematic Review of Experience Sampling and Ecological Momentary Assessment Studies (2012) · cites this paper as Wild et al., 2010
Self-check
Percentages, sums and reported differences re-computed from the paper’s own numbers.
The self-check needs the paper’s full text.
Citations
Cites
Estimating the Dimension of a Model
Schwarz, G. (1978) · The Annals of Statistics · doi:10.1214/aos/1176344136 · Cited by 47,033
Investigating causal relations by econometric models and cross-spectral methods
Granger, C. W. J. (1969) · Econometrica · doi:10.2307/1912791 · Cited by 22,989
Diagnostic and Statistical Manual of Mental Disorders (DSM-IV)
Hu, R. J. (2003) · Elsevier eBooks · doi:10.1016/b0-12-226870-9/01070-4 · Cited by 9,168
New Introduction to Multiple Time Series Analysis
Lütkepohl, H. (2005) · Springer eBooks · doi:10.1007/978-3-540-27752-1 · Cited by 5,972
Investigating Causal Relations by Econometric Models and Cross-Spectral Methods
Granger, C. W. J. (2010) · Essays in Econometrics · doi:10.1017/cbo9780511753978.002 · Cited by 4,762
Lauritzen, S. L. (1996) · doi:10.1093/oso/9780198522195.001.0001 · Cited by 2,976
Introduction to Multiple Time Series Analysis
Jolliffe, I. T., Lütkepohl, H., & Lütkepohl, H. (1993) · Technometrics · doi:10.2307/1269296 · Cited by 1,912
Introduction to Graphical Modelling
Edwards, D. (2000) · Springer texts in statistics · doi:10.1007/978-1-4612-0493-0 · Cited by 809
Goebel, R., Roebroeck, A. F., Kim, D., & Formisano, E. (2003) · Magnetic Resonance Imaging · doi:10.1016/j.mri.2003.08.026 · Cited by 678
Binge eating disorder and obesity
de Zwaan, M. (2001) · International Journal of Obesity · doi:10.1038/sj.ijo.0801699 · Cited by 522
Research works printed but not linked: 1
- Schlittgen R, Streitberg BHJ: Zeitreihenanalyse. 1997, München: Oldenbourg
Cited by
Sorted by citations
Items 101–122 of 122
Group Iterative Multiple Model Estimation Approaches in Clinical Science
Lee, C., & Gates, K. M. (2026) · Annual Review of Clinical Psychology · doi:10.1146/annurev-clinpsy-061724-080138 · Cited by 2
Jia, Z., Wang, L., Jiang, Y., & Liu, X. (2025) · Mathematics · doi:10.3390/math13142230 · Cited by 2
Surała, O., Malczewska‐Lenczowska, J., & Crewther, B. T. (2021) · The Journal of Sports Medicine and Physical Fitness · doi:10.23736/s0022-4707.20.11757-2 · Cited by 2
Change-point detection in low-rank VAR processes
Enikeeva, F., Klopp, O., & Rousselot, M. (2025) · Bernoulli · doi:10.3150/24-bej1760 · Cited by 1
Chaos to clarity: interpreting time series complexity metrics with an application to depression
George, S. V. (2025) · Discover Mental Health · doi:10.1007/s44192-025-00231-4 · Cited by 1
Estimating personal temporal symptom networks for childhood cancer survivors
Zhou, Y., Deshpande, S., Horan, M. R., Choi, J., Mulrooney, D. A., Ness, K. K., Hudson, M. M., Srivastava, D. K., & Huang, I. (2025) · Communications Medicine · doi:10.1038/s43856-025-01105-0 · Cited by 1
Lin, Y., White, M. L., Zhang, J., & Braver, T. S. (2026) · Network Neuroscience · doi:10.1162/netn.a.555 · Cited by 1
Boolani, A., Lindsey, B., Petricoin, E. F., Zhou, W., Alhammad, R., Butcher, J. T., & Martin, J. W. (2026) · Research in Health and Medicine · doi:10.53520/rhm2026.104193 · Cited by 1
Dimension reduction in vector autoregressive models for macroeconomic applications
Herath, H. M. W. B. (2025) · Statistics · doi:10.1080/02331888.2025.2499921 · Cited by 1
Under pressure : Studying complex and causal systems in psychopathology
Kossakowski, J. J. (2020) · Data Archiving and Networked Services (DANS) · Cited by 1
Kelly, D. P., Weigard, A. S., & Beltz, A. M. (2021) · Journal of Psychosomatic Research · doi:10.1016/j.jpsychores.2021.110428 · Cited by 1
New Methods in Exploring Old Topics: Case Studying Brittle Diabetes in the Family Context
Günther, M. P., Winker, P., Wudy, S. A., & Brosig, B. (2015) · Journal of Diabetes Research · doi:10.1155/2016/6437452
Sparse estimation of high-dimensional time series models.
Wilms, I. (2016) · Lirias
Cross-Autocorrelation, Risk Transmission and Contagion in the Global CDS MarketsPreprint
Cai, C. X., Hu, M., & Ye, X. (2020) · SSRN Electronic Journal · doi:10.2139/ssrn.3826385
Fatimah, H. (2020) · Digital Commons - University of South Florida (University of South Florida)
Konaç, D., Lau, J. Y. F., Salum, G. A., Manfro, G. G., Rohde, L. A., Gadelha, A., Miguel, E. C., & Barker, E. D. (2022) · SSRN Electronic Journal · doi:10.2139/ssrn.4180185
Mochizuki, K., Maeno, K., & Ogawa, T. (2024) · IEEE International Conference on Software Engineering and Artificial Intelligence (SEAI) · doi:10.1109/seai62072.2024.10674254
Li, M., Chan, R. H., Huang, Y., & Zeng, T. (2025) · Journal of Scientific Computing · doi:10.1007/s10915-025-03126-2
Dependency modelling in co-evolving time series
Owusu, P. (2024) · theses.fr (ABES) · doi:10.70675/f3a6218cz3d13z4bc4z9adfze2f8a893f728 · Cited by 1
Examining the Dynamics of Mind-Wandering During Music Listening: A Network Perspective
Taruffi, L., & Vroegh, T. (2026) · Music & Science · doi:10.1177/20592043261466437
Veer, I. M., Wiers, R. W. H. J., Epskamp, S., Freichel, R., & McNally, R. J. (2026) · PsyArXiv (OSF Preprints)
Kalantari, E., Allocca, C., Ail, R., Giuliani, F., Ricciardi, F., Cosmo, S. D., Georgoula, M., Georga, E. I., Haleem, M. S., Kouchaki, S., et al. (2026) · Scientific Reports · doi:10.1038/s41598-026-64281-6
Metadata
- Authors
- Wild, B., Eichler, M., Friederich, H.-C., Hartmann, M., Zipfel, S., & Herzog, W.
- Affiliations
- University Hospital Heidelberg (DE)
- Maastricht University (NL)
- Universitätsklinikum Tübingen (DE)
- Corresponding author
- Wild, Beate
- Eichler, Michael
- ORCID
- Venue
- BMC Medical Research Methodology
- Published
- 2010-04-01
- Volume
- 10
- Issue
- 1
- Pages
- 28-28
- ISSN
- 1471-2288 (ISSN-L)
- PMC
- PMC2869334
- OpenAlex
- W2028782034
- Cited by
- 123
- References
- 54
- Citations by year
- 2026: 4 · 2025: 10 · 2024: 7 · 2023: 10 · 2022: 12 · 2021: 18 · 2020: 22 · 2019: 6 · 2018: 13 · 2017: 2 · 2016: 8 · 2015: 3 · 2014: 4 · 2013: 1 · 2012: 3
- FWCI
- 1.67
- Type
- journal article
- Language
- en
- Open access
- gold
- doi.org
- Licence
- Locations
- BMC Medical Research Methodology (publishedVersion, cc-by)
- Europe PMC (PubMed Central) (publishedVersion, cc-by)
- PubMed Central (publishedVersion, cc-by)
- PubMed (publishedVersion)
- Research Publications (Maastricht University) (publishedVersion, cc-by)
- DOAJ (DOAJ: Directory of Open Access Journals) (submittedVersion, cc-by-sa)
- Research Publications (Maastricht University) (submittedVersion, other-oa)
- Topics
- Social Sciences › Psychology › Experimental and Cognitive Psychology › Mental Health Research Topics
- Physical Sciences › Computer Science › Artificial Intelligence › Bayesian Modeling and Causal Inference
- Social Sciences › Psychology › Clinical Psychology › Eating Disorders and Behaviors
- Keywords
- electronic diary, multivariate time series, binge eating disorder, obesity, eating behaviour, depression, anxiety, food intake regulation, path diagrams
- MeSH terms
- Adult, Anxiety, Computer Graphics, Depression, Female, Humans, Male, Models, Theoretical, Obesity, Regression Analysis, Multivariate Analysis, Computers, Handheld, Young Adult, Binge-Eating Disorder
About these checks
Registry, retraction, Cites and statistics results are computed, not judged, with one exception: a printed reference that no index lists is read once by a model before it counts as a citation error. Claims are extracted by a model and kept only when their quote appears verbatim in the text; each cited source is then checked, with a model’s help, for whether it says what the claim relies on. Those verdicts can be wrong — read the claim’s quote and the cited source before relying on one.
Statistics and arithmetic are recomputed, not judged.
Confidence bands are shown only for fields calibrated on our annotated test set. None is calibrated yet, so no band is shown.
What counts as a claim ›How we measure confidence ›How we check this ›
Are you an author, or do you see a problem with this page? Request a review
